Recently, Oke Cloud Chain Research Institute has observed significant changes in the U.S. bond yield curve, which may drive huge changes in the current macroeconomic cycle and even profoundly affect the future of the financial asset market. In this regard, Ouke Cloud Chain Research Institute specially invited Dr. Yi to conduct an in-depth analysis of the development trends of the global high interest rate environment.
The author of this article: Dr. Yi, a special researcher of Ouke Cloud Chain, a senior practitioner of traditional financial institutions, with more than ten years of macroeconomic research experience and nearly ten years of alternative asset investment research experience. Welcome to follow X (Twitter): @Dr_Yi_SH
1. The comeback of the 1970s—the materialization of the phantom of inflation
Looking back at history, we will find that the causes of long-term inflation mainly come from three aspects: labor unions, wars and the Federal Reserve. They represent core inflation (labor costs) and non-core inflation (resource prices) and monetary factors (interest rates) respectively. From the 1970s to the end of the 1980s, the combined effect of these three factors promoted the long era of stagflation in the United States. In the current post-epidemic era, these three factors are likely to make a comeback.
1) Twilight of Empire—The End of America’s Demographic Dividend
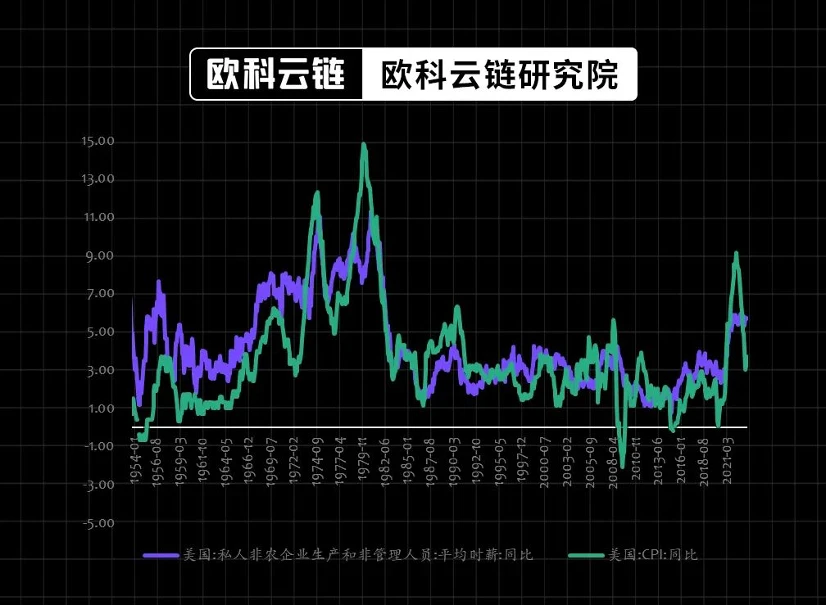
Since 2010, the aging of the U.S. population has begun to become an unavoidable issue, and as the baby boom generation ages, U.S. labor costs are rising steadily. Although the new immigration policy launched by the United States during the Obama era partially alleviated the rise in labor pressure before 2016, with the policy adjustments during the Trump era and the impact of the COVID-19 epidemic, the pressure on the U.S. labor supply began to become more apparent. Against this background, job vacancies remain high, hourly wages continue to rise, and the power of labor unions rises again, which will be long-term problems that plague the U.S. labor market.
Figure 1: Compensation is the core factor affecting US inflation (%)
Source: Wind, Ouke Cloud Chain Research Institute
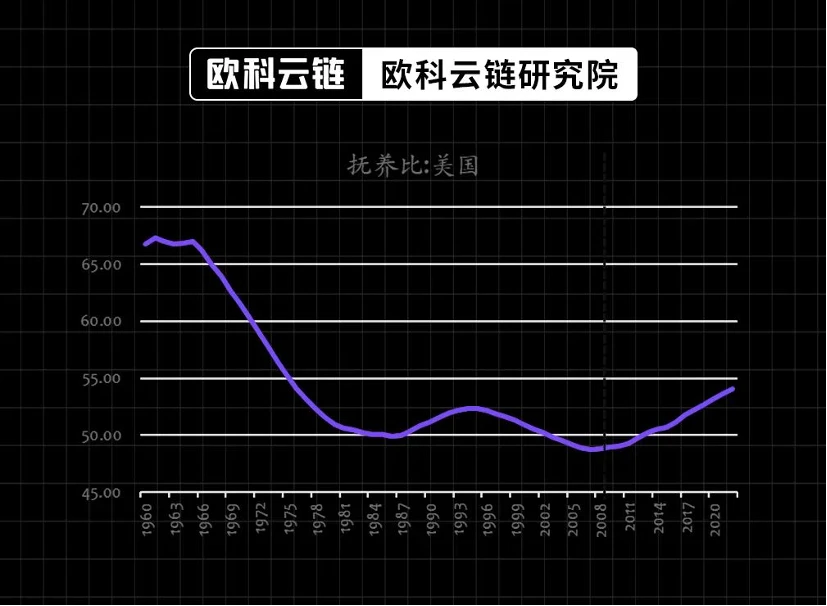
America has become increasingly older since 2010. Data show that from 2010 to 2020, the U.S. population over the age of 55 grew by 27%, which is 20 times the growth rate of the overall population under the age of 55 (1.3%). The biggest reason for this divide lies with the baby boomer generation. The population in the 65-74 age group has increased by half in the past decade. All U.S. states, metro areas, and most counties can be expected to experience growth in the population aged 55 and older. Even in areas where population growth has stagnated, the aging of the baby boom generation will lead to a significant increase in the elderly population.
Figure 2: Demographic changes in the United States (%)
Source: Wind, Ouke Cloud Chain Research Institute
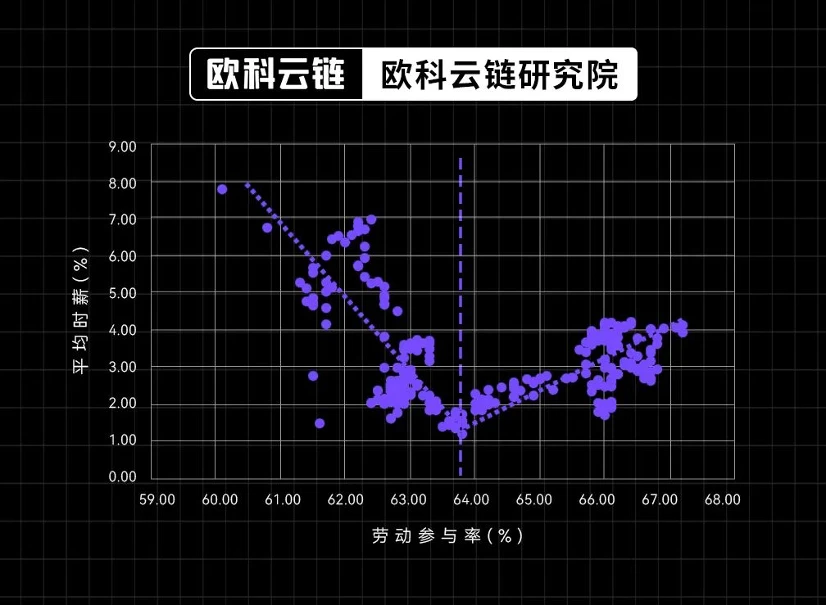
The U.S. labor market is shifting from buyers pricing to sellers pricing. Studying the correlation between the U.S. labor participation rate and average hourly wages since 2000, we can also find that there was a significant change around 2010. Before 2010, there was a higher labor participation rate, and there was a positive correlation between the labor participation rate and wages. This means that higher wages can attract more workers to participate in economic activities. After 2010, this relationship changed to a lower labor participation rate, and a significant negative correlation between salary and labor participation rate, which means that in the labor market, the bargaining power of workers has increased significantly, and this change The direct impact is the rise of labor unions and the increase in strike activity.
Figure 3: The correlation between the U.S. labor force participation rate and hourly wage growth is changing since 2000
Source: Wind, Ouke Cloud Chain Research Institute
2) Serious imbalance between crude oil supply and demand - a victim of U.S. political correctness
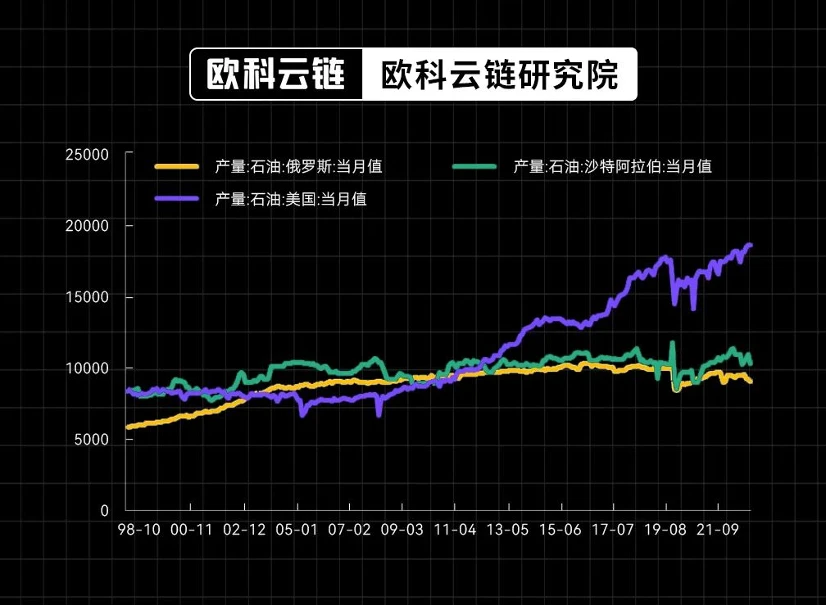
As for energy prices, U.S. factors remain the core factor causing high oil prices. Judging from the current production situation of major crude oil-producing countries, since the shale oil revolution in 2013, the United States has been the worlds largest oil producer. As of May 2022, U.S. crude oil production reached 21.5 million barrels, even surpassing the ranking The combined total of Saudi Arabia (11.5 million barrels) in second place and Russia (9.95 million barrels) in third place. Therefore, understanding changes in U.S. crude oil production capacity is the core factor in understanding oil price fluctuations.
Figure 4: Production changes of the world’s major crude oil producing countries (thousand barrels)
Source: Wind, Ouke Cloud Chain Research Institute
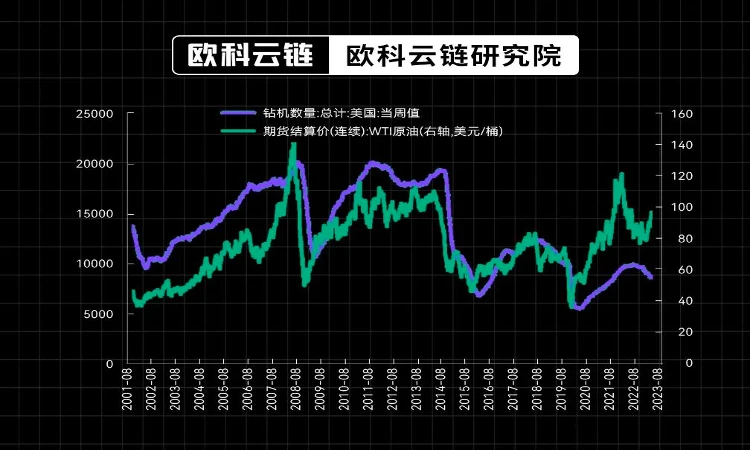
The Biden administrations green energy policy has become a bottleneck restricting U.S. crude oil production capacity. Since the Biden administration came to power, ESG-oriented green investment concepts have tended more toward clean energy investments, while having a strong inhibitory effect on traditional oil and gas investments. On the one hand, in order to achieve the goal of carbon neutrality, the financing of oil and gas companies has Availability has dropped significantly compared with before. On the other hand, ESG requirements have caused listed shale oil companies to spend more money on controlling methane emissions, reducing methane combustion, and carbon capture. In addition, changes in policies regarding the development of new oil wells will also restrict long-term sustainable shale oil extraction activities. Since May 2023, although U.S. crude oil production continues to hit records, the number of U.S. rigs has begun to fall, which also reflects the depletion of potential U.S. crude oil production capacity.
Figure 5: Crude Oil Prices and U.S. Rig Count
Source: Wind, Ouke Cloud Chain Research Institute
On the other hand, the long-term trend of the Russia-Ukraine conflict also makes it difficult for Russias crude oil production capacity to further expand. Since the Russia-Ukraine conflict in 2022, Russias energy production and sales have been affected to a certain extent. Although exports have since been adjusted from Europe to East Asian and South Asian countries, the overall crude oil supply is still difficult to return to pre-conflict levels. At least for now, the impact of this factor still shows no signs of ending, and Russias subsequent energy supply capacity may remain limited for a long time.
In such an environment, coupled with the recent announcement by OPEC countries led by Saudi Arabia to reduce production, the output of the worlds three largest crude oil producing countries has been suppressed, and supply will continue to support crude oil prices for a long time. The price of global resource products will also provide continued support.
3) The freak under MMT theory—the global fiscal “Great Leap Forward”
Modern Monetary Theory (MMT) is a relatively new economic theory that believes that governments should influence the economy through fiscal policy, rather than monetary policy. It emphasizes that the accumulation of national fiscal deficits and public debt does not necessarily lead to an economic crisis, but can serve as important tools in a modern economic system to achieve higher employment and economic growth. In MMTs view, the governments approach to controlling the economy through borrowing and taxation is unnecessary—the government can do whatever it can to create as many jobs and economic growth as possible until the economy gets super hot (i.e., inflationary).
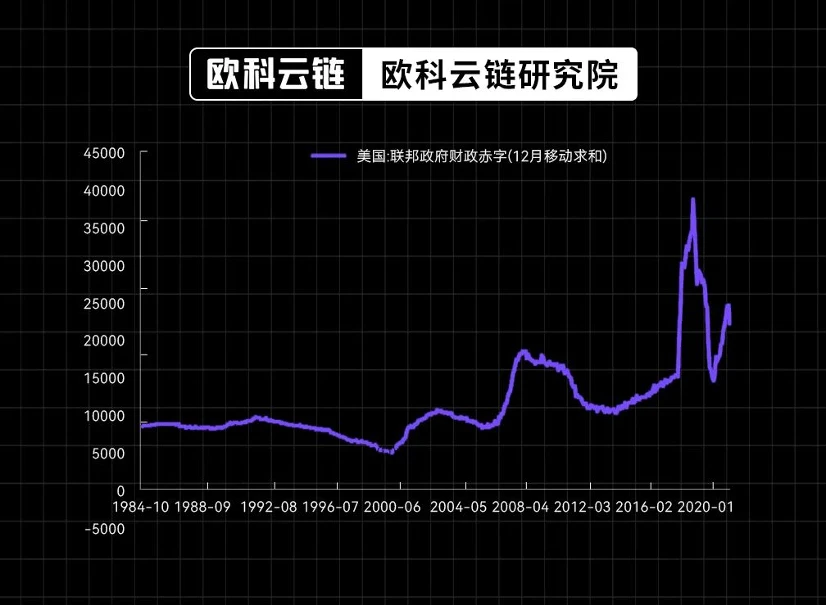
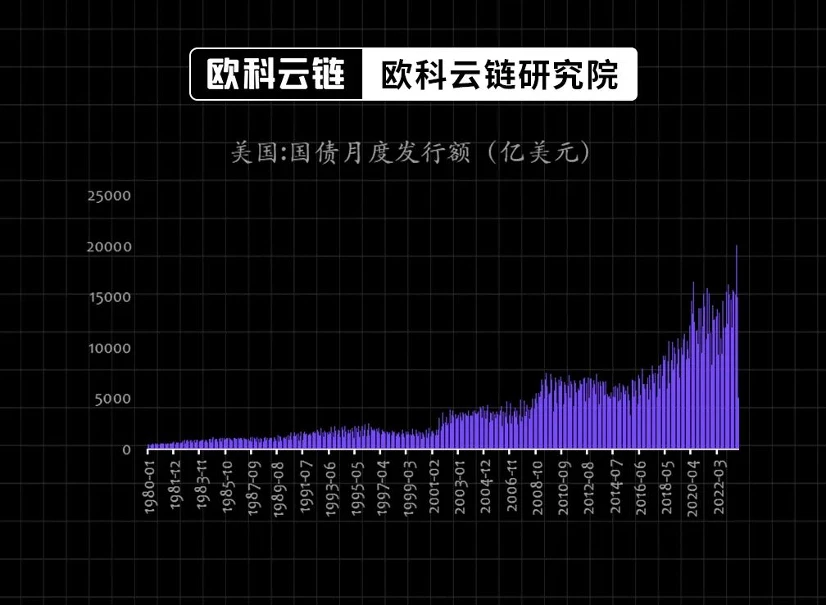
It is under the guidance of this idea that developed economies represented by the United States have opened the door to fiscal expansion at an unimaginable speed. Since Yellen became the U.S. Treasury Secretary in 2021, the size of the U.S. fiscal deficit has continued to be at historically high levels. Especially since 2023, the rapid rise in U.S. policy interest rates has caused fiscal interest payments to rise rapidly, pushing the U.S. fiscal deficit to highs again. Historically, the advancement of U.S. fiscal and monetary policies has tended to be highly synchronized, that is, active fiscal policies have been adopted during easing cycles, while more prudent fiscal policies have been adopted during monetary contraction cycles. The current over-reliance on finance has caused the fiscal deficit to continue to rise during the period of monetary tightening, and fiscal problems can only be solved through the issuance of more government bonds, especially for long-term bonds. The further expansion of their financing scale will affect their The upward trend in interest rates provides continued support.
Figure 6: The size of the U.S. fiscal deficit remains high (millions of dollars)
Source: Wind, Ouke Cloud Chain Research Institute
Figure 7: U.S. Treasury bond issuance (billion yuan)
Source: Wind, Ouke Cloud Chain Research Institute
2. From Panic to Response—Changes in the Global Financial Environment
Facing the rapidly changing macro interest rate environment since 2022, the capital market is gradually shifting from initial panic to active response.
1) Changes in the anchor of global risk assets—the long-term high interest rate environment
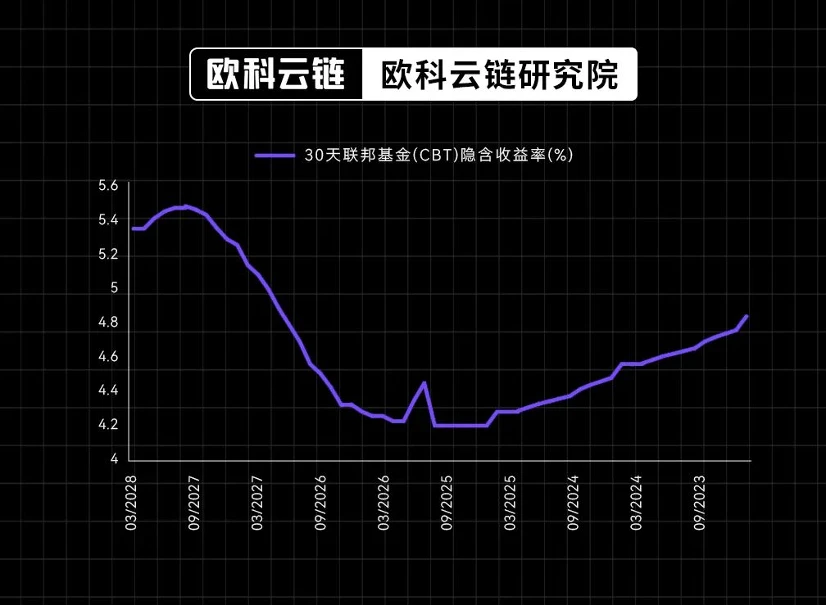
The interest rate hike is coming to an end, but it is difficult to say that it will be loose. On September 23, the Federal Reserve held its September interest rate meeting, suspending the pace of interest rate increases, but at the same time revised its real GDP and PCE forecasts higher, and the future expected interest rate path shown in the dot plot has also increased and become flatter. Judging from the expectations of financial market transactions, although the Federal Reserve is expected to start an interest rate cut cycle starting next year (2024), the downward space for interest rates is only 125 bp - from the high of 5.45% in November this year to 4.20%. Subsequently, under the environment of economic recovery, the interest rate center will rise again to 4.83% in 2028 - in other words, in the next five years, U.S. bond yields of 4% to 5% will be the norm.
Figure 8: Fed Fed Rate Futures Hidden Interest Rate (%)
Source: CME, Ouke Cloud Chain Research Institute
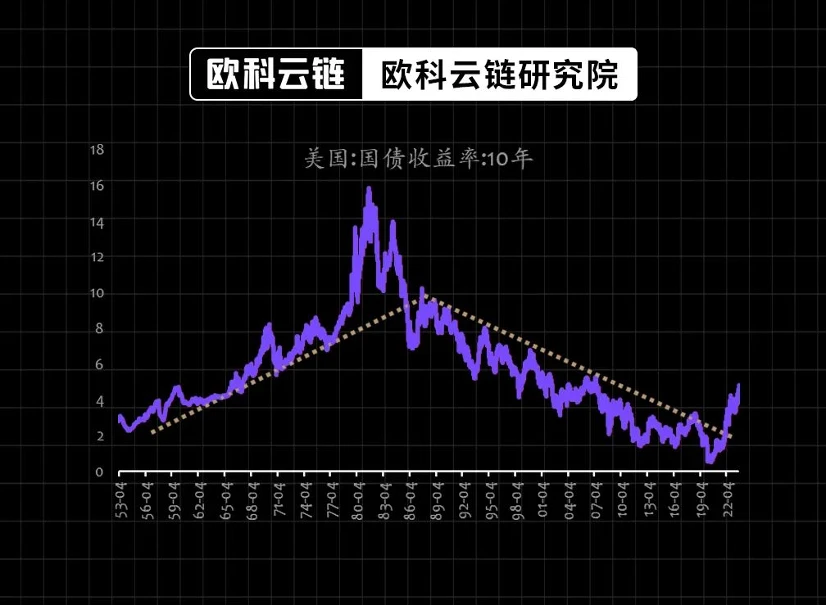
U.S. long-term interest rates are entering a new upward channel. If we look at it from a longer-term perspective, U.S. bond yields are breaking out of their long-term downward channel since the 1980s and beginning a new upward trend. Among them, changes in the U.S.s own demographic structure, the return of overseas capital amid changes in international relations, and the impact of the COVID-19 epidemic on the traditional economic model have all formed a supporting force for the upward movement of the interest rate center.
Figure 9: U.S. Treasury yields are breaking out of the downward channel they have been in for the past 20 years (%)
Source: Wind, Ouke Cloud Chain Research Institute
2) The allocation value of physical assets is a major turning point relative to financial assets
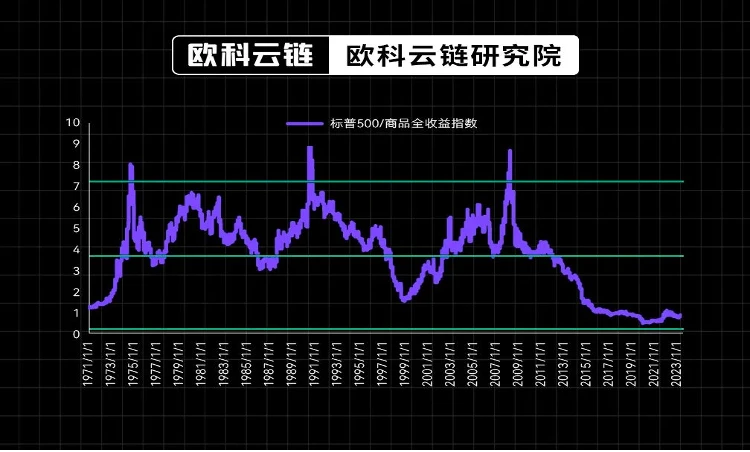
Real assets are extremely undervalued relative to financial assets. Although the prices of real assets represented by commodities have rebounded rapidly since the 2020 epidemic, they are still extremely undervalued relative to financial assets represented by the SP 500. Part of this is due to the decline in the proportion of real estate allocated to the U.S. household sector after the subprime mortgage crisis in 2008. On the other hand, it is also due to the systematic decline in the price center of resource products after the shale oil revolution in 2013, including the structure of China’s economy. In the process of transformation, the combined effect of various factors such as the decline in demand for traditional resource products. However, from the current point of view, with the emergence of the resilience of the U.S. economy, especially the labor market, and the profound changes in the supply and demand structure of resource products, including changes in China’s real estate industry policies, compared with financial assets whose valuations are still at high levels, entities The allocation value of assets is becoming highlighted.
Figure 10: The value of real assets relative to financial assets is at historically low levels
Source: Wind, Ouke Cloud Chain Research Institute
For investors, there is no need to be overly afraid in the face of a high interest rate environment - even in the 1970s and 1980s, when inflation was rampant, there were not no investment opportunities at all - from 1970 to 1979, the benchmark U.S. stocks represented by the SP 500 still rose by 17.2%, while the prices of real assets represented by gold and crude oil achieved huge increases of 1,428% and 1,481%; at the same time, the high interest rate environment also gave birth to the U.S. mutual fund market. Rapid development, especially currency funds and mortgage REITs funds achieved tremendous development in the 1970s. Facing the current macro environment similar to that of the 1970s, finding more financial assets that have a high mapping relationship with real inflation or interest-earning assets will be a weapon to face and defeat high interest rates.
Write at the end of the article
This article comes from a special researcher of Ouke Cloud Chain Research Institute. The views represent only the authors personal views and are not investment advice. The Ouke Cloud Chain Research Institute is a strategic research institution under the Ouke Cloud Chain Group. Its mission is to help global business, public and social sectors gain a deeper understanding of the evolution of financial technology and the blockchain economy, and to output in-depth analysis and professional content. Covering topics such as technology application and innovation, technology and social evolution, and financial technology challenges, it is committed to promoting the application and sustainable development of cutting-edge technologies such as blockchain technology.


