
Crypto Market Sentiment Research Report (2024.04.19–04.26): A quiet week after Bitcoin halving
A quiet week after Bitcoin’s halving
1. USDT leveraged lending annual interest rate drops sharply
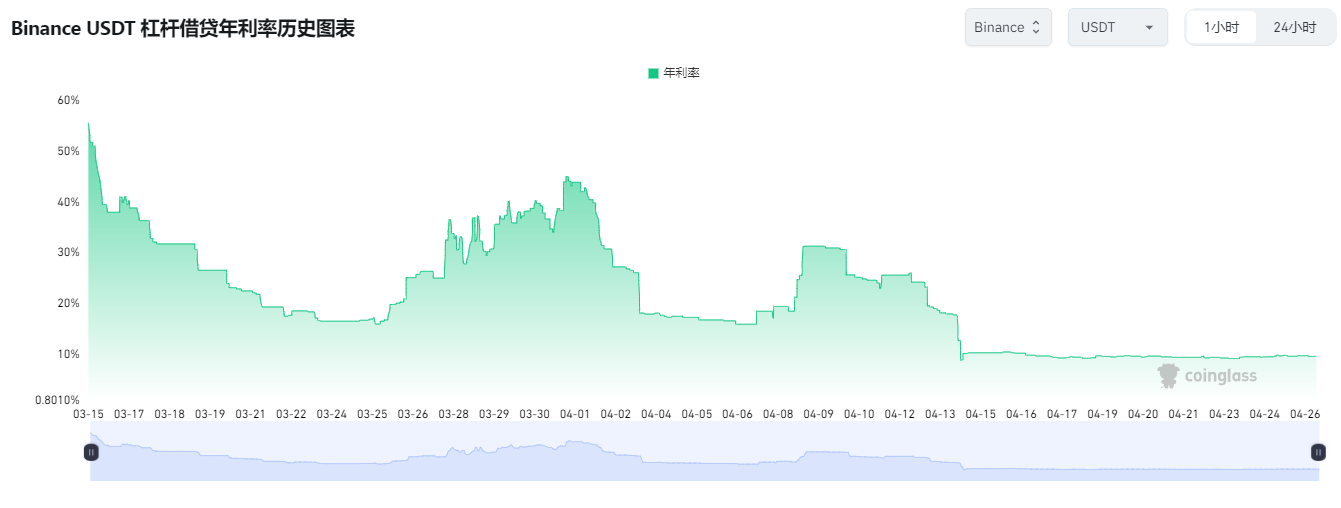 Data source: https://www.coinglass.com/zh/pro/i/MarginFeeChart
In leveraged trading, borrowers can increase their trading funds by borrowing certain assets (such as USDT) and use them to conduct larger transactions. This operation usually involves paying a certain amount of interest, which is the annual interest rate for leveraged lending.
However, when the USDT margin lending annual interest rate fell sharply, it meant that the market sentiment for margin trading was low. Lower interest rates indicate low demand for lending, which may be due to investors being cautious about market risks or declining interest in margin trading.
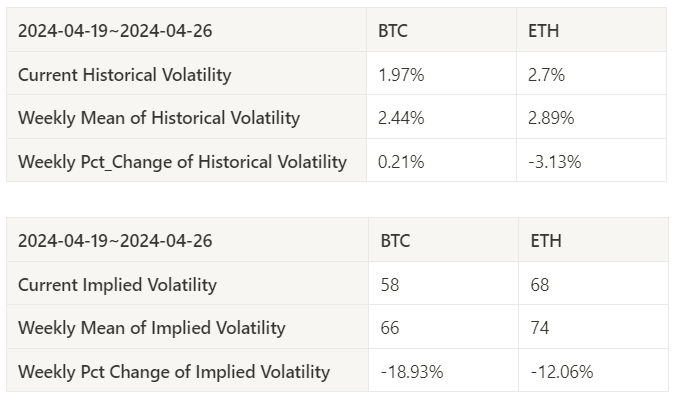
2. Implied volatility has dropped significantly
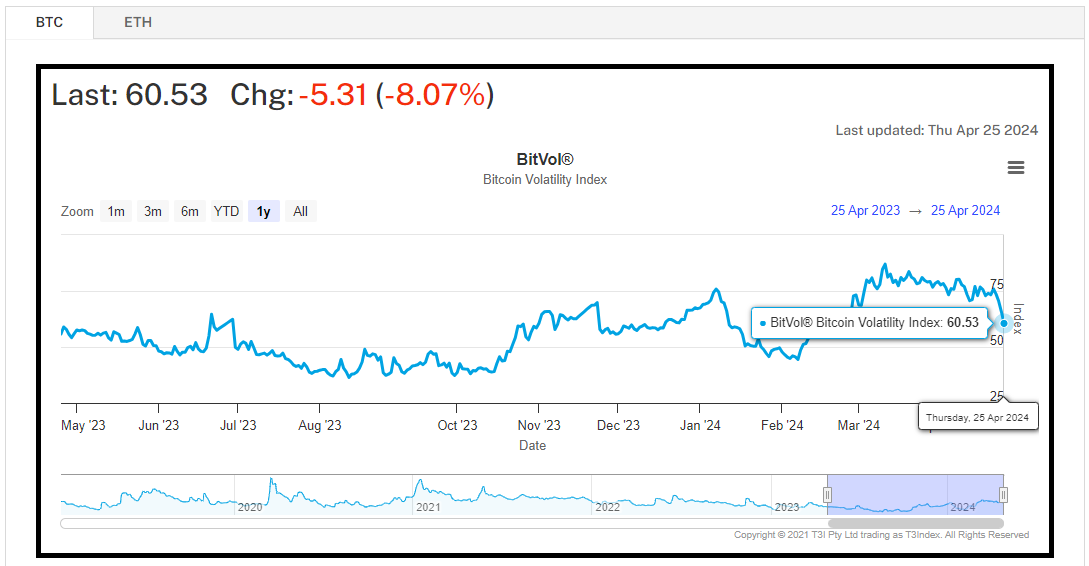
Data source: https://t3index.com/indexes/bit-vol/
In the options market, implied volatility is a measure of the market's expectations of future asset price volatility. It is calculated from option prices and reflects the market participants' expectations of future price fluctuations.
When implied volatility drops significantly, it means that option market participants have lower expectations of future asset price volatility. This may be because market participants are more cautious about the stability of the market or the expected level of volatility.
Both of the above situations show that investors are taking a wait-and-see attitude towards the market this week, assessing risks more cautiously and choosing conservative trading strategies or reducing the volatility risk of trading strategies.
There are about 6 days left until the Federal Reserve interest rate meeting (2024.05.02)
https://hk.investing.com/economic-calendar/interest-rate-decision-168
Market technical and sentiment environment analysis
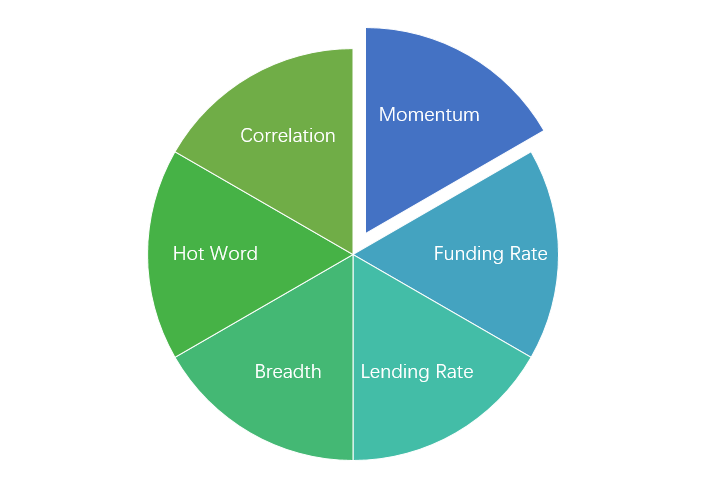
Sentiment Analysis Components
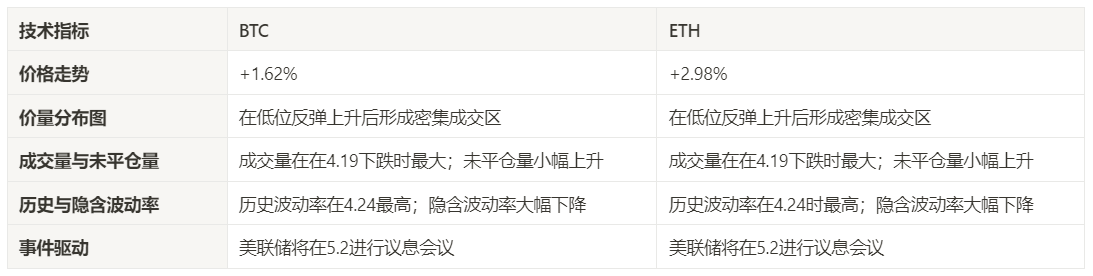
Technical indicators
Price trend
Over the past week, BTC prices have risen by 1.62% and ETH prices have risen by 2.98%.
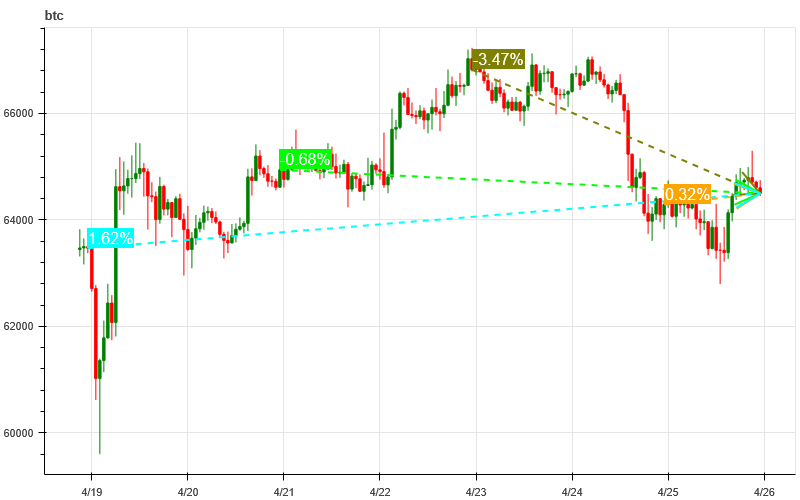
The above picture is the price chart of BTC in the past week.
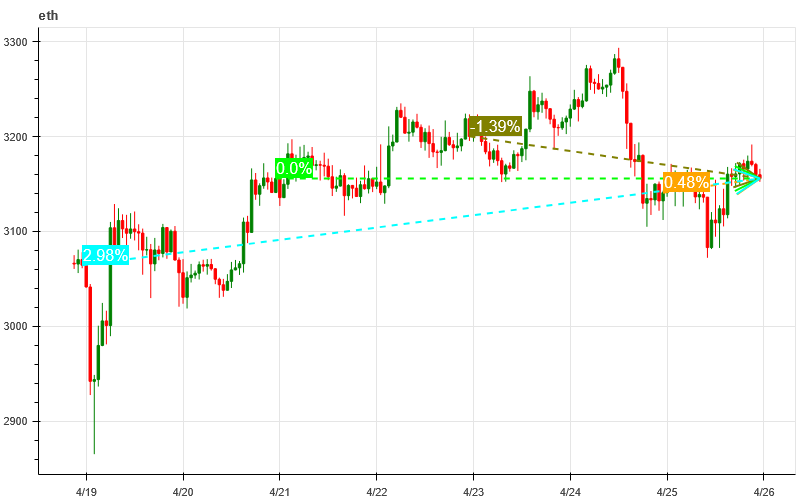
The above picture is the price chart of ETH in the past week.
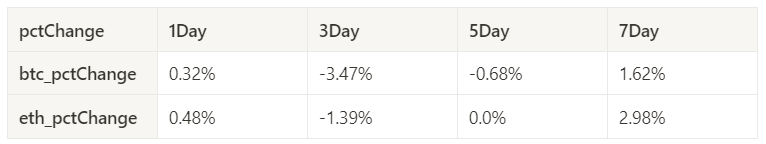
The table shows the price change rate over the past week.
Price Volume Distribution Chart (Support and Resistance)
In the past week, BTC and ETH prices rebounded from low levels and formed a dense trading area.
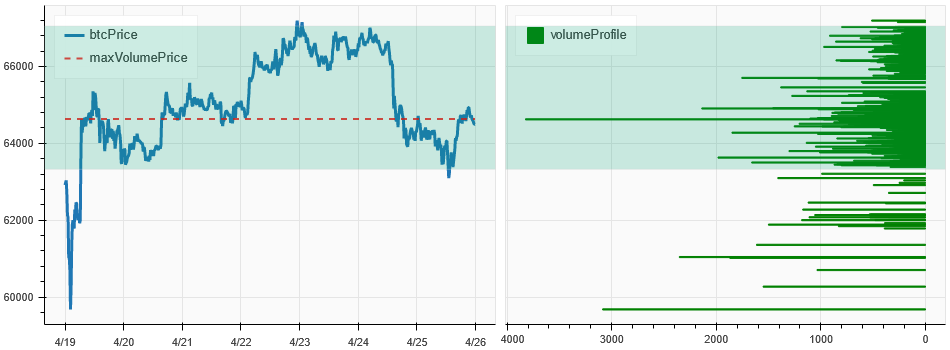
The above picture shows the distribution of BTC's dense trading areas in the past week.
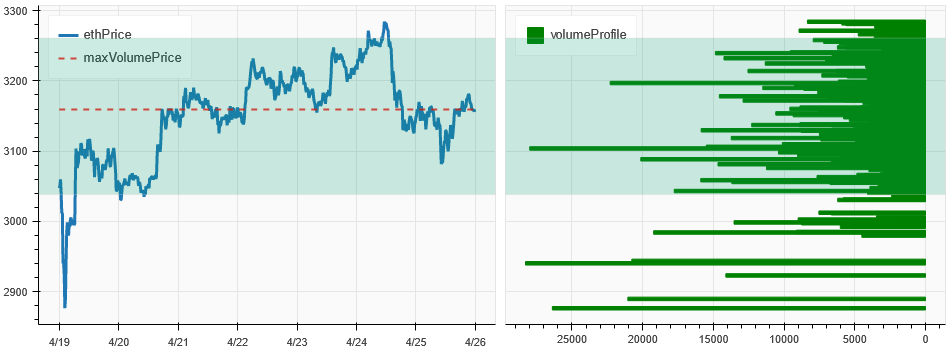
The above picture shows the distribution of ETH's dense trading areas in the past week.
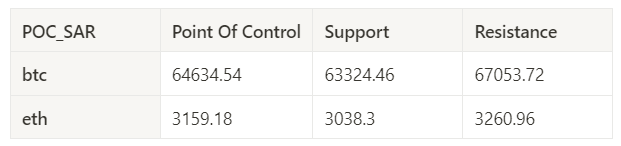
The table shows the weekly intensive trading range of BTC and ETH in the past week.
POC_SARPoint Of ControlSupportResistancebtc64634.5463324.4667053.72 eth 3159.183038.33260.96
Volume and Open Interest
In the past week, the trading volume of BTC and ETH was the largest when it fell on 4.19; the open interest of BTC and ETH both rose slightly.
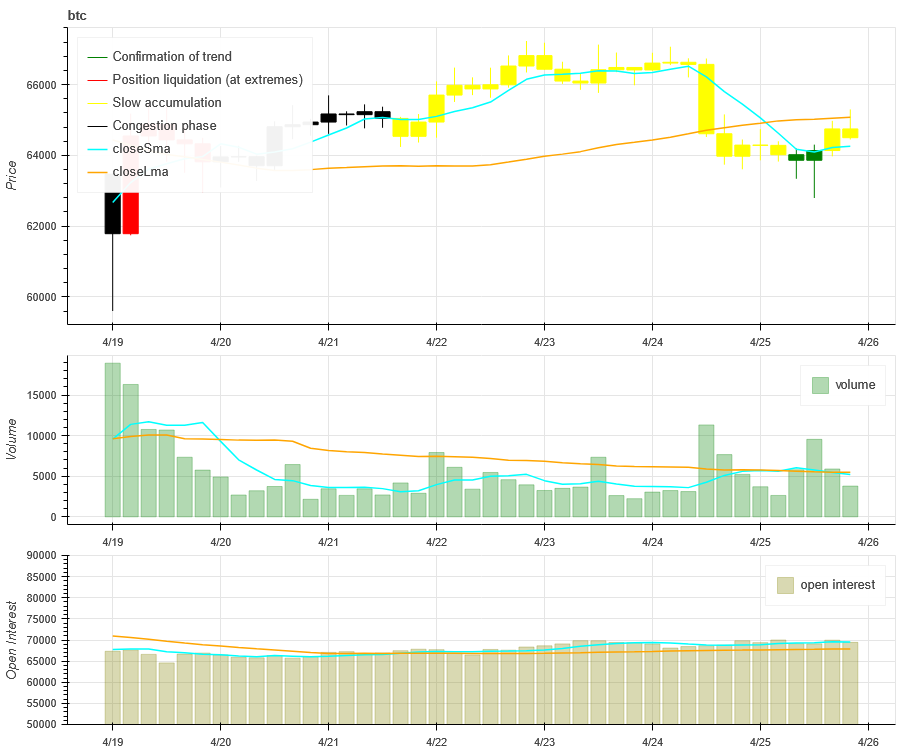
The top of the above picture shows the price trend of BTC, the middle shows the trading volume, the bottom shows the open interest, the light blue is the 1-day average, and the orange is the 7-day average. The color of the K-line represents the current state, green means the price rise is supported by the trading volume, red means closing positions, yellow means slowly accumulating positions, and black means crowded state.
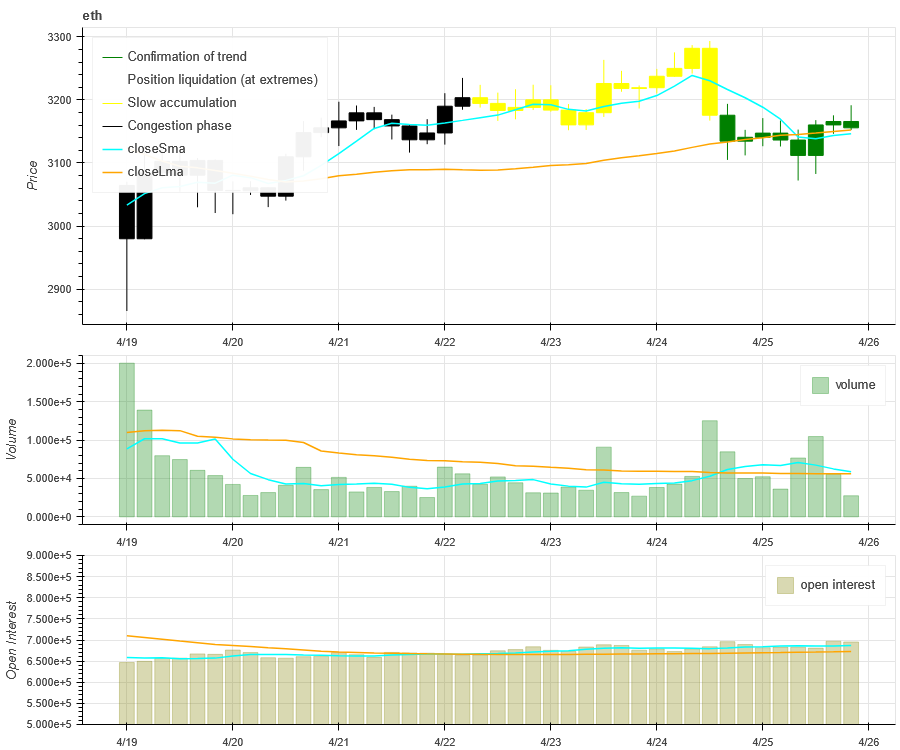
The top of the above picture shows the price trend of ETH, the middle is the trading volume, the bottom is the open interest, the light blue is the 1-day average, and the orange is the 7-day average. The color of the K-line represents the current state, green means the price rise is supported by the trading volume, red is closing positions, yellow is slowly accumulating positions, and black is crowded.
Historical Volatility vs. Implied Volatility
In the past week, the historical volatility of BTC and ETH was the highest when they fell from a high of 4.24; the implied volatility of BTC and ETH fell sharply.
The yellow line is the historical volatility, the blue line is the implied volatility, and the red dot is its 7-day average.
Event-driven
Waiting for the Federal Reserve interest rate meeting on May 2, 2024.
Sentiment Indicators
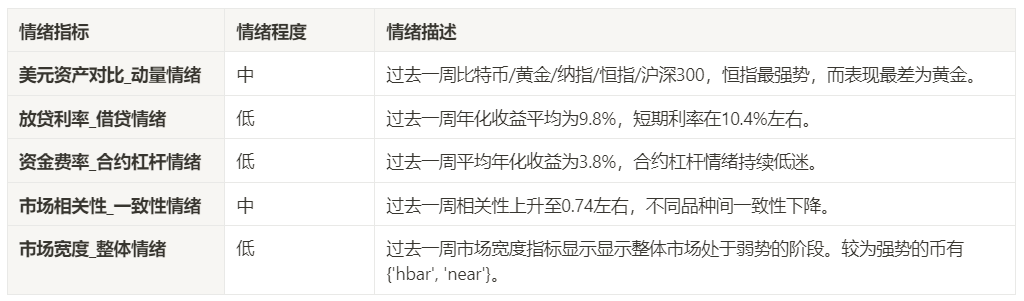
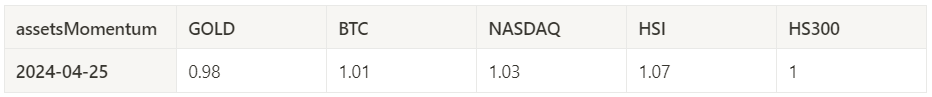
Momentum Sentiment
In the past week, among Bitcoin/gold/Nasdaq/Hang Seng Index/CSI 300, Hang Seng Index was the strongest, while gold performed the worst.
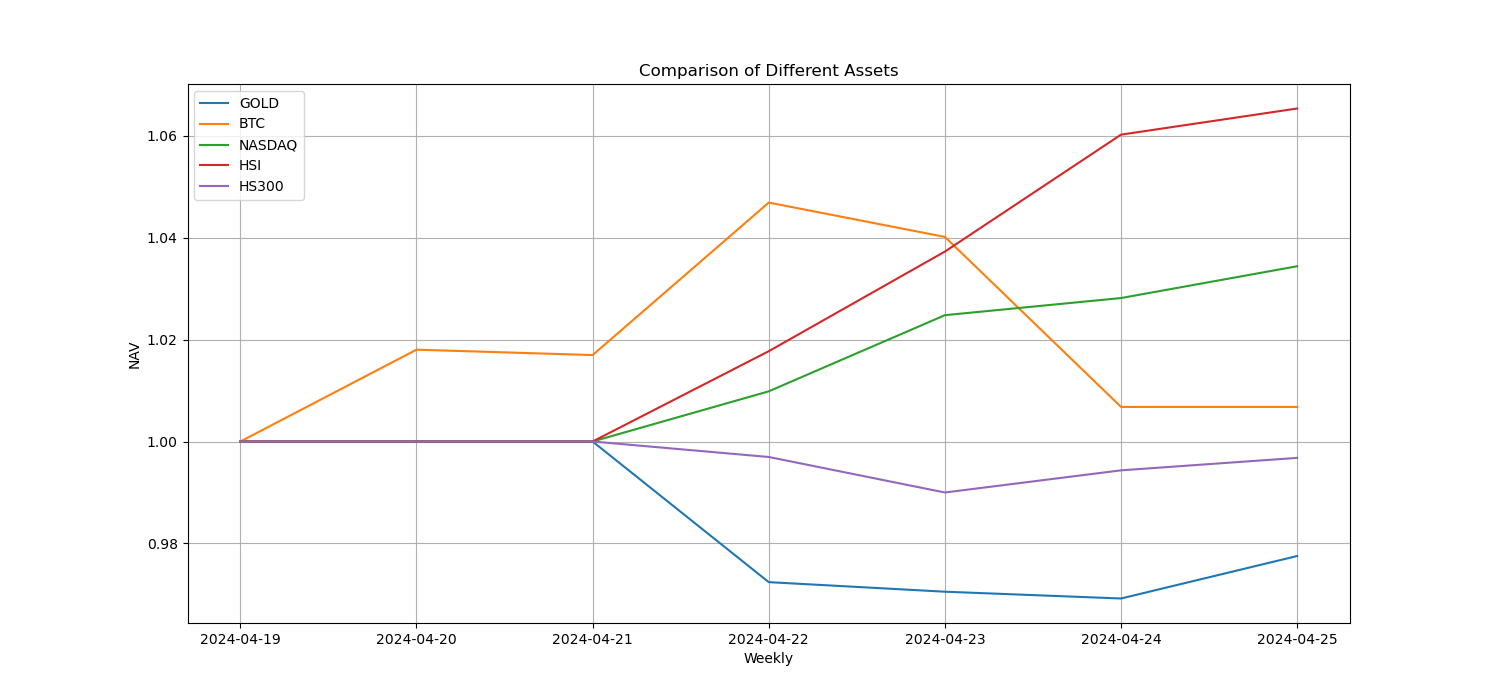
The above picture shows the trend of different assets in the past week.
Lending Rate_Lending Sentiment
Over the past week, the average annualized return on USD lending was 9.8%, and the short-term interest rate was around 10.4%.
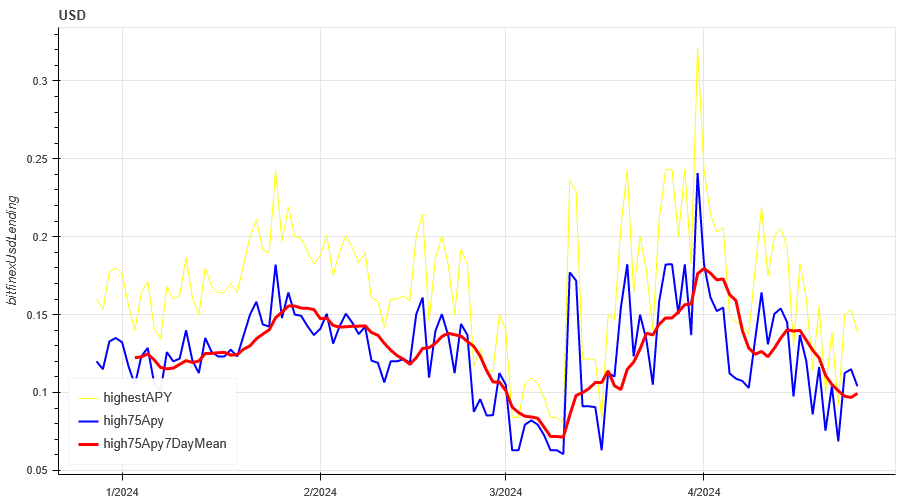
The yellow line is the highest price of USD interest rate, the blue line is 75% of the highest price, and the red line is the 7-day average of 75% of the highest price.
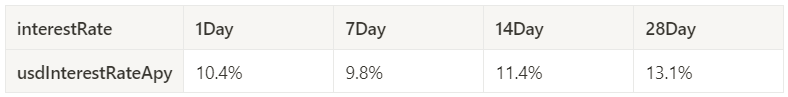
The table shows the average returns of USD interest rates for different holding days in the past
Funding Rate_Contract Leverage Sentiment
The average annualized return on BTC fees in the past week was 3.5%, and contract leverage sentiment was low.
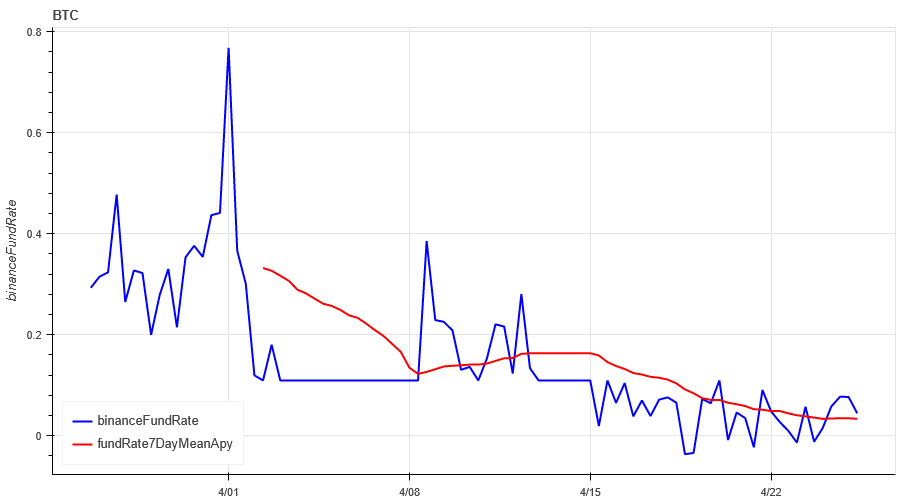
The blue line is the funding rate of BTC on Binance, and the red line is its 7-day average
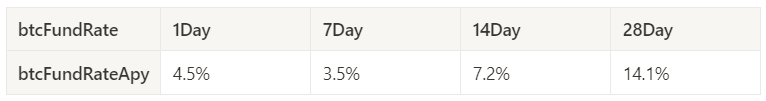
The table shows the average return of BTC fees for different holding days in the past.
Market Correlation_Consensus Sentiment
The correlation among the 129 coins selected in the past week dropped to around 0.74, and the consistency between different varieties decreased.
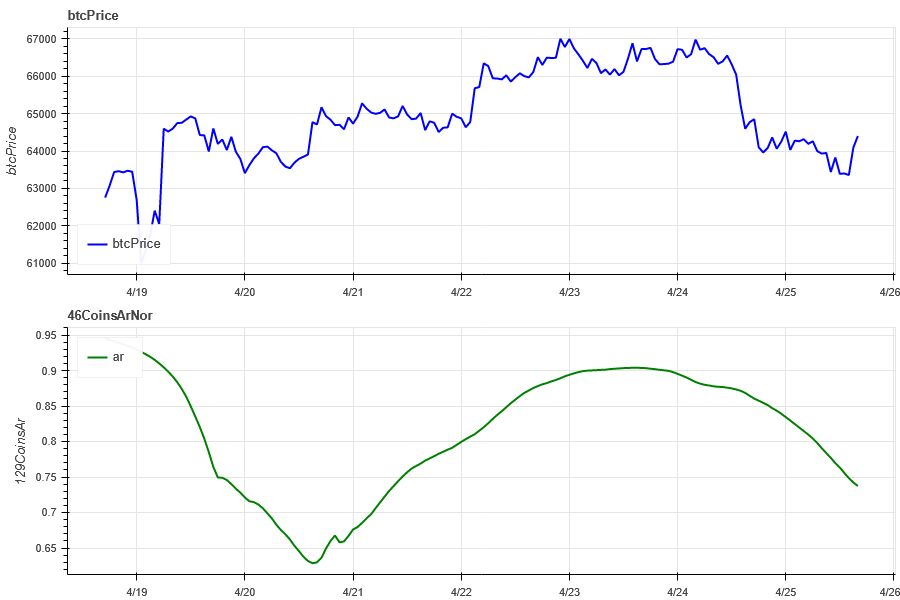
In the above figure, the blue line is the price of Bitcoin, and the green line is ['1000 floki', '1000 lunc', '1000 pepe', '1000 shib', '100 0x ec', '1inch', 'aave', 'ada', 'agix', 'algo', 'ankr', 'ant', 'ape', 'apt', 'arb', 'ar', 'astr', 'atom', 'audio', 'avax', 'axs', 'bal', 'band', 'bat', 'bch', 'bigtime', 'blur', 'bnb', 'btc', 'celo', 'cfx', 'chz', 'ckb', 'comp', 'crv', 'cvx', 'cyber', 'dash', 'doge', 'dot', 'dydx', 'egld', 'enj', 'ens', 'eos','etc', 'eth', 'fet', 'fil', 'flow', 'ftm', 'fxs', 'gala', 'gmt', 'gmx', 'grt', 'hbar', 'hot', 'icp', 'icx', 'imx', 'inj', 'iost', 'iotx', 'jasmy', 'kava', 'klay', 'ksm', 'ldo', 'link', 'loom', 'lpt', 'lqty', 'lrc', 'ltc', 'luna 2', 'magic', 'mana', 'matic', 'meme', 'mina', 'mkr', 'near', 'neo', 'ocean', 'one', 'ont', 'op', 'pendle', 'qnt', 'qtum', 'rndr', 'rose', 'rune', 'rvn', 'sand', 'sei', 'sfp', 'skl', 'snx', 'sol', 'ssv', 'stg', 'storj', 'stx', 'sui', 'sushi', 'sxp', 'theta', 'tia', 'trx', 't', 'uma', 'uni', 'vet', 'waves', 'wld', 'woo', 'xem', 'xlm', 'xmr', 'xrp', 'xtz', 'yfi', 'zec', 'zen', 'zil', 'zrx'] overall correlation
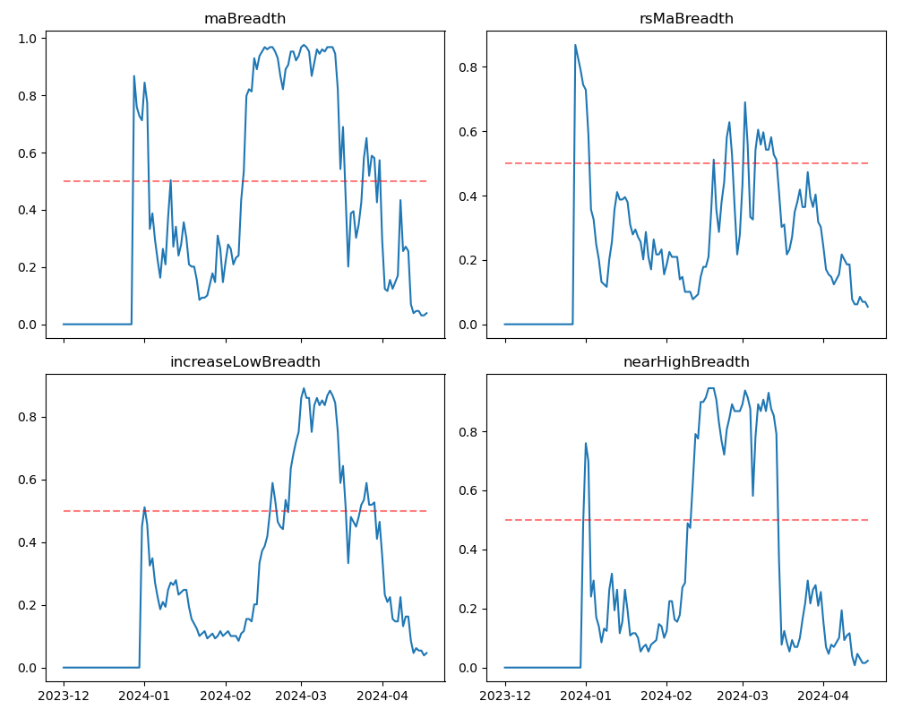
Market Breadth_Overall Sentiment
Among the 129 coins selected in the past week, 8.5% of the coins were priced above the 30-day moving average, 15.5% of the coins were priced above the 30-day moving average relative to BTC, 10% of the coins were more than 20% away from the lowest price in the past 30 days, and 5.4% of the coins were less than 10% away from the highest price in the past 30 days. The market breadth indicator in the past week showed that the overall market was in a weak stage.
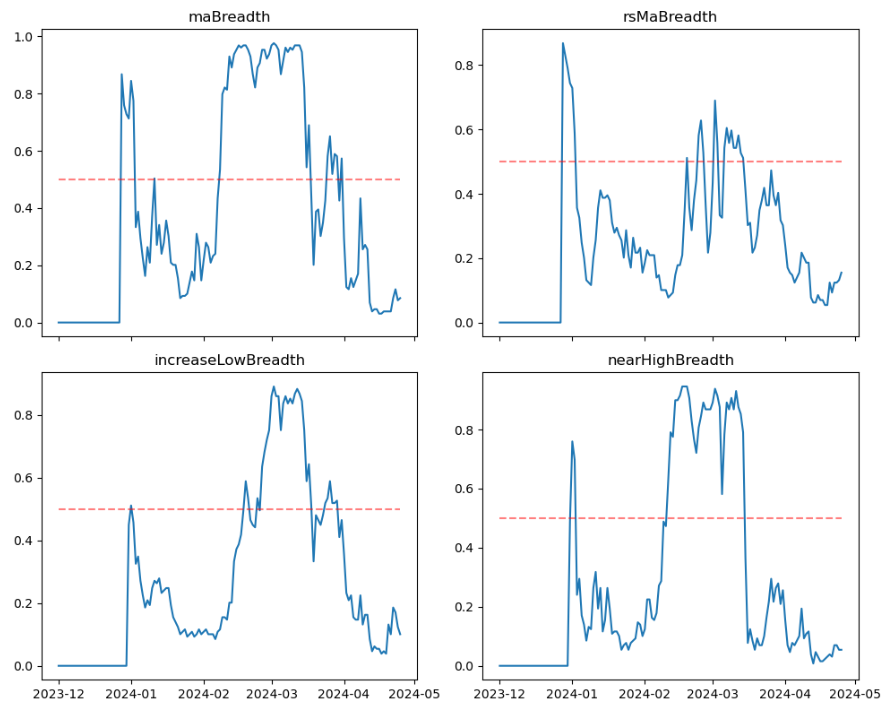
The above picture is ['1000 floki', '1000 lunc', '1000 pepe', '1000 shib', '100 0x ec', '1inch', 'aave', 'ada', 'agix', 'algo', 'ankr', 'ant', 'ape', 'apt', 'arb', 'ar', 'astr', 'atom', 'audio', 'avax', 'axs', 'bal', 'band', 'bat', 'bch', 'bigtime', 'blur', 'bnb', 'btc', 'celo', 'cfx', 'chz', 'ckb', 'comp', 'crv', 'cvx', 'cyber', 'dash', 'doge', 'dot', 'dydx', 'egld', 'enj', 'ens', 'eos','etc', 'eth', 'fet', 'fil', 'flow', 'ftm', 'fxs', 'gala', 'gmt', 'gmx', 'grt', 'hbar', 'hot', 'icp', 'icx', 'imx', 'inj', 'iost', 'iotx', 'jasmy', 'kava', 'klay', 'ksm', 'ldo', 'link', 'loom', 'lpt', 'lqty', 'lrc', 'ltc', 'luna 2', 'magic', 'mana', 'matic', 'meme', 'mina', 'mkr', 'near', 'neo', 'ocean', 'one', 'ont', 'op', 'pendle', 'qnt', 'qtum', 'rndr', 'rose', 'rune', 'rvn', 'sand', 'sei', 'sfp', 'skl', 'snx', 'sol', 'ssv', 'stg', 'storj', 'stx', 'sui', 'sushi', 'sxp', 'theta', 'tia', 'trx', 't', 'uma', 'uni', 'vet', 'waves', 'wld', 'woo', 'xem', 'xlm', 'xmr', 'xrp', 'xtz', 'yfi', 'zec', 'zen', 'zil', 'zrx'] 30-day proportion of each width indicator

Summarize
In the past week's market, the prices of Bitcoin (BTC) and Ethereum (ETH) both fell and rebounded at the beginning of the week. The historical volatility was the largest when it fell from the high of 4.24, the trading volume was large when it fell from 4.19, and the open interest increased slightly. The implied volatility of BTC and ETH has dropped significantly. In addition, the funding rate remains at a low level, indicating that the contract trading sentiment continues to be sluggish. The overall market is still in a weak stage in terms of market breadth indicators. In terms of events, we need to wait for the Federal Reserve's interest rate meeting on May 2. After the Bitcoin halving, various indicators show that investors are temporarily waiting to see the market.
Twitter: @DerivativesCN
Website: https://dcbot.ai/


