


In the cryptocurrency market, data has always been an important tool for people to make trading decisions. How can we clear the fog of data and discover effective data to optimize trading decisions? This is a topic that the market continues to pay attention to. This time, OKX specially planned the Insight Data column, and jointly with industry data platforms such as CoinGlass, AICoin, Coingecko and 0x Scope, based on common user needs, we hope to dig out a more systematic data methodology for market reference and learning.
The following is the fifth issue, which was jointly discussed by the OKX Web3 team and the 0x Scope team around topics such as How to establish an on-chain data analysis methodology. I hope it will be helpful to you.
About 0x Scope: 0x Scope is a leading data analysis and AI data provider for Web3. It is creating a universal Web3 LLM, dedicated to using AI to reduce the difficulty for users to understand and interact with Web3. This is due to the rich Web3-related data that the 0x Scope team has accumulated since 2022, which has been adopted by nearly 200 Web3 professional institutions. Currently, Scopescan and Scopechat under 0x Scope have accumulated more than 1 million users.
About OKX Web3: The team brings together top talents with deep technical background and rich industry experience. Over the years, they have continuously innovated and practiced in the field of Crypto, and continue to focus on user experience and security. At present, the OKX Web3 wallet is the most comprehensive decentralized multi-chain wallet on the market, supporting 90+ public chains, with built-in wallets, transactions, NFT markets, DeFi, and Dapp discovery. Users can view multi-chain tokens, NFTs, and DeFi assets through the App, plug-ins, and web pages.
1. On-chain data analysis is very important. How should novices take the first step?
0x Scope: First, you need to understand the basic concepts and logic, such as address, amount, sender (from), receiver (to), and fuel cost (gas). Try to use and understand the most basic blockchain browser, and then use other tools for more detailed analysis.
In general, commonly used analysis platforms or tools include on-chain data platforms, blockchain browsers, and API interfaces. On-chain data platforms (such as ScopeScan, ScopeChat, Nansen, Glassnode, and Dune Analytics) provide convenient data access and analysis functions. Blockchain browsers (such as Etherscan and Blockchain.com Explorer) can manually query blocks, transactions, and account information. In addition, many blockchain networks and data providers (such as Etherscan API and Coingecko API) provide API interfaces that can obtain on-chain data programmatically.
In addition, on-chain data analysis is mainly divided into two categories: transaction and investigation. Transaction data analysis can discover early alpha or trends through on-chain data, or formulate trading strategies by analyzing the fundamental data of the transaction target. Investigation data analysis can discover the flow of funds and potential address map relationships through on-chain data, or find the real reasons behind abnormal events through data association.
OKX Web3: On-chain data analysis is to gain insights into network activity, user behavior, and market trends by examining and interpreting data recorded directly on the blockchain. For new users who want to take the first step in on-chain analysis, here are some key points:
First, familiarize yourself with blockchain explorers such as Etherscan to understand basic transaction data and wallet activity. Second, focus on key on-chain metrics such as active addresses, transaction volume, and supply distribution. Next, explore user-friendly on-chain analysis tools like Nansen, Debank, and Glassnode to visualize on-chain data.
Start with basic metrics, tracking simple data points like daily active addresses or number of transactions. At the same time, understand how on-chain data relates to market trends and trader behavior, and identify patterns and correlations in price movements by analyzing historical data. Finally, combine on-chain analysis with fundamental and technical analysis to gain a more comprehensive perspective.
2. Which key indicators need to be focused on?
0x Scope: It mainly depends on the needs and scenarios:
If your strategy is fundamental analysis or long-term trading, we recommend paying attention to the following 10 indicators:
• Transaction volume, which is the total number of transactions that occur on the blockchain network over a period of time, which generally reflects the activity and usage of the network;
• The number of active addresses, which is the number of unique addresses with transaction records in a period of time. The more active addresses there are, the higher the level of network user participation;
• The number of new addresses refers to the number of new addresses created within a period of time. The increase in the number of new addresses usually indicates that the network has attracted new users, indicating the user growth of the network;
• Transaction fees, the total fees paid by users for transactions. High transaction fees may indicate high demand on the network, reflecting the level of network congestion and the costs users are willing to pay;
• Average transaction value, the average amount of each transaction. A higher average transaction value may indicate more large transactions, which helps to understand the flow of funds and user trading habits;
• Liquidity, which is the amount of assets that can be traded in decentralized exchanges (DEX). Markets with high liquidity are usually more stable and healthy, affecting transaction slippage and market depth;
• Token holding concentration, the distribution of token holders, such as the proportion of the total amount held by the top 10/50/100 holders. High holding concentration may lead to increased risk of market volatility. Understand the concentration of token holdings and market risks;
• Total Value Locked (TVL), the total value locked in the DeFi protocol. A high TVL usually indicates that the protocol is popular and widely used, which measures the scale and popularity of the DeFi protocol;
• Smart contract call count, which is the number of calls to a smart contract over a period of time. A high number of calls indicates that the contract is widely used, reflecting the usage and popularity of the smart contract;
• Developer activity, the update frequency of the project code base and the number of contributors. High developer activity indicates that the project is continuously improving and developing, reflecting the development progress and activity of the project.
If your strategy is short-term trading or you hope to make profits by catching trends, we recommend paying attention to the overbought and oversold conditions of decentralized exchanges, which reflect the abnormal fluctuations in current market demand, as well as large deposits or withdrawals from exchanges, which can reveal the potential buying and selling intentions of the main players.
If your strategy is copy trading, you can pay more attention to the dynamics of smart money. For example, the historical returns of smart money can help identify traders with strong long-term profitability; the frequency and number of transactions can let you know the activity and market participation of smart money. The transaction success rate evaluates the trading accuracy of smart money, while the holding time reveals whether its strategy is short-term or long-term. The asset distribution shows the degree of diversification of its portfolio, and the transaction fee reflects its transaction costs. The risk-adjusted return measures the ability of smart money to gain returns while controlling risks, and the on-chain reputation of smart money shows its evaluation in the community. In addition, the liquidity supply situation helps to understand whether smart money is also providing liquidity, which may affect its trading behavior. Through these indicators, the dynamics of smart money can be better understood and tracked.
If you are testing risks, it is recommended to focus on at least the following 10 key indicators:
• Abnormal transaction volume, which is the number of transactions significantly higher than normal within a specific time period, which helps identify potential attacks or unusual activities, such as hacking or fund transfers;
• Large transfers, which refer to transactions exceeding a certain monetary threshold, may indicate asset theft, money laundering, or evasion of detection;
• Transaction frequency, which is the number of transactions per unit time. Abnormally high transaction frequency may indicate an ongoing attack or fraud;
• A large number of transactions from new addresses. Newly created addresses that make a large number of transactions in a short period of time may be a means for attackers to hide their identities. By observing these addresses, the source of the attack can be identified;
• Smart contract calls, which involve transaction calls of smart contracts. Smart contracts may be targets or tools of attacks. By analyzing these calls, we can understand the attackers operating methods;
• Token transfers, the transfer of specific tokens in the network. Abnormal transfers can point to specific attacks, such as token theft or illegal transfers;
• Abnormal gas fees, which are significantly higher or lower than the average transaction fees. Attackers may use high gas fees to speed up transactions, or use low gas fees to hide a large number of small transactions;
• Trading intervals, i.e. the time interval between consecutive trades. Consecutive trades within a short period of time may indicate an automated attack or the use of trading scripts;
• Abnormal activity of on-chain protocols and contracts. A surge in activity of a specific protocol or smart contract may be caused by an attacker exploiting a vulnerability or a problem within the protocol;
• Account balance changes, i.e. significant changes in account balances, which can help users identify situations where funds have been stolen or transferred.
In fact, in general, these indicators are essentially traces left by the main traders. Beginners can feel the market changes by analyzing these traces.
OKX Web3: For beginners, we recommend following these 4 key indicators to gain a deeper understanding of blockchain networks and market dynamics:
• Active Addresses: This metric provides a basic understanding of network usage and economic activity. By observing the changes in active addresses, beginners can understand the actual application level and user engagement of the network.
• Volume: Volume is an important indicator for assessing market activity, helping to understand the buying or selling pressure in the market. High volume generally means that market participants are active, while low volume may indicate that the market is in a wait-and-see mode.
• MVRV (Market to Realized Value Ratio) and NUPL (Unrealized Profit and Loss): These metrics provide deep insights into market valuations and overall sentiment. MVRV can help assess whether a token is fairly priced in the market, while NUPL shows whether investors are currently making a profit or a loss.
• Supply distribution: This metric shows the concentration of token ownership. By analyzing the supply distribution, beginners can understand whether the token is too concentrated in a few addresses, which may have an impact on the liquidity and stability of the market.
As beginners become more familiar with these basic metrics, they can gradually incorporate other more complex metrics into their analysis, such as on-chain transaction fees, mining difficulty, network hash rate, etc., thereby comprehensively improving their understanding of blockchain networks and markets.
3. How to identify emerging Web3 projects through on-chain data?
0x Scope: A very simple way is to pay attention to the GAS consumption rankings every day. Most of the abnormally increased contracts reflect some of the hottest projects on that day or recently.
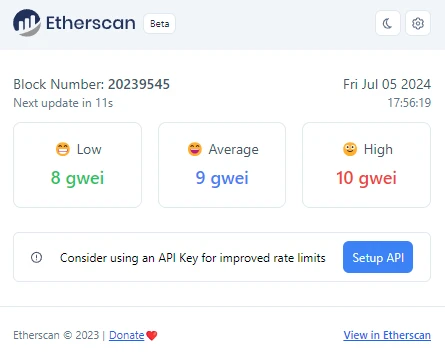
A more efficient way is to use Etherscans Chrome GAS plug-in. You can always see the current GAS level in the upper right corner of the browser. When you find that GAS has soared, you can use the Top Gas Consumer rankings we just mentioned or Etherscans Gas Tracker to see where everyones GAS is spent. Usually in this case you can discover some new projects.
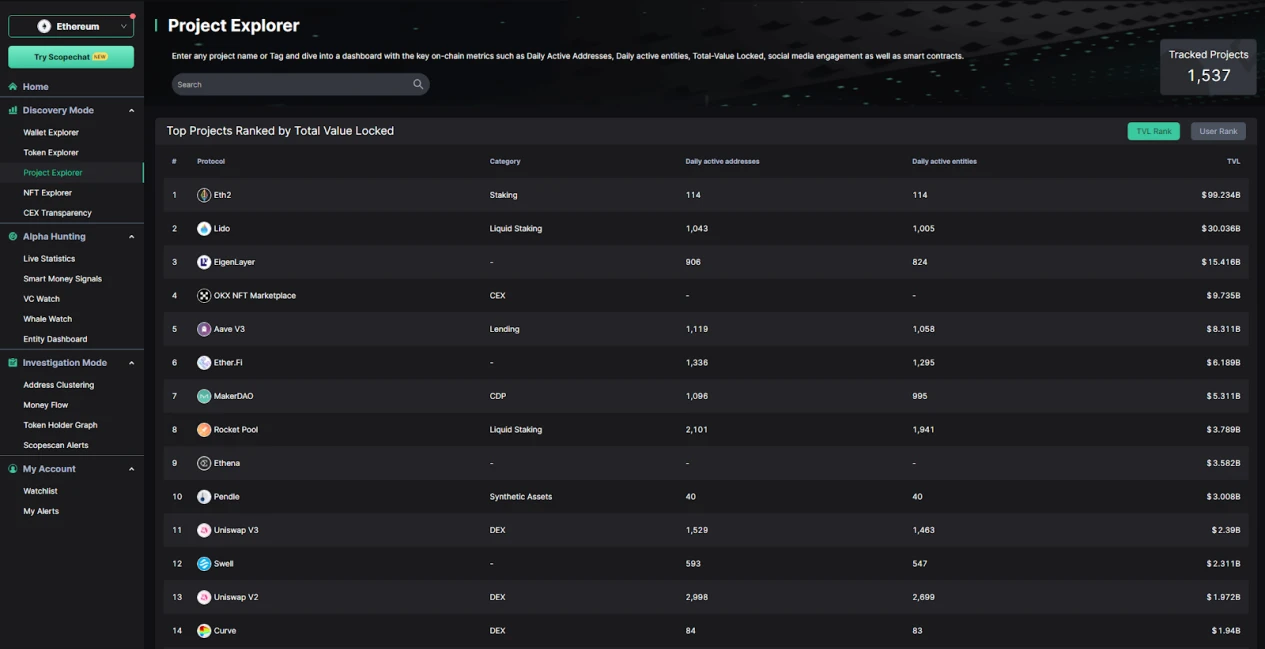
The most commonly used one is the Top Gas Consumer ranking of Scopescan. If you often look at this ranking, you will find that in most cases, the top few rankings of the ETH chain are Uniswap router, USDT contract, and several TG bots such as Banana Gun. If you find a contract that you are not familiar with in this ranking, you can check whether the contract has a label on Scopescan or Etherscan; for students with better hands-on ability, you can also check who deployed the contract and where his handling fee comes from. Another way is to look at the Project Explorer ranking on our Scopescan. If you suddenly find a project you have never seen before appears on this ranking (TVL Rank and User Rank), it also means that this project is worth your attention.
OKX Web3: In fact, there are many ways to identify emerging on-chain projects. First, monitoring on-chain activities is a crucial step. This includes tracking new smart contract deployments, looking for increased transaction volume, and unique addresses interacting with contracts. By analyzing the gas usage of new projects, we can gain insight into their activity and development progress in the blockchain ecosystem.
Secondly, key metrics of emerging projects can be tracked and analyzed more effectively using customized dashboards provided by data aggregation platforms such as Dune Analytics, nansen, and Glassnode. These platforms can not only monitor the growth of total value locked in decentralized financial projects, but also track the daily active users of dApps and games, and evaluate the transfer volume and holder growth of new tokens.
In addition to on-chain data, it is also necessary to pay attention to cross-references of off-chain data. Monitoring social media activities and community growth, observing developer activities on GitHub repositories, and analyzing the price trends of project tokens and trading volumes on exchanges are all important supplements for assessing the potential of emerging projects. The combined use of these methods and data sources will help to comprehensively evaluate and identify emerging Web3 projects with value and development potential.
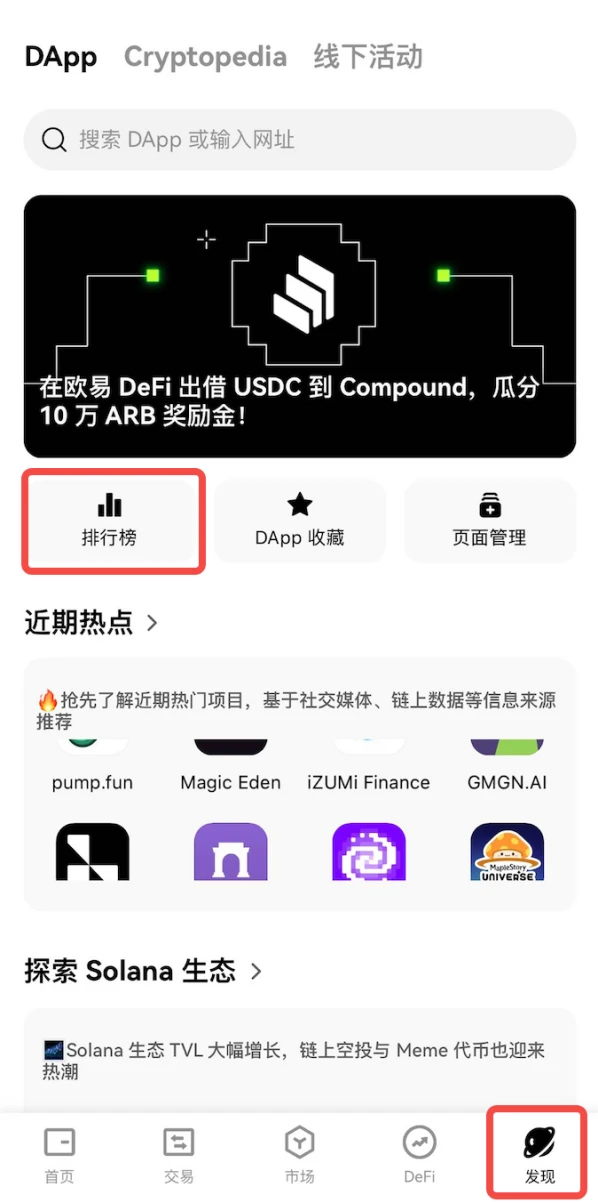
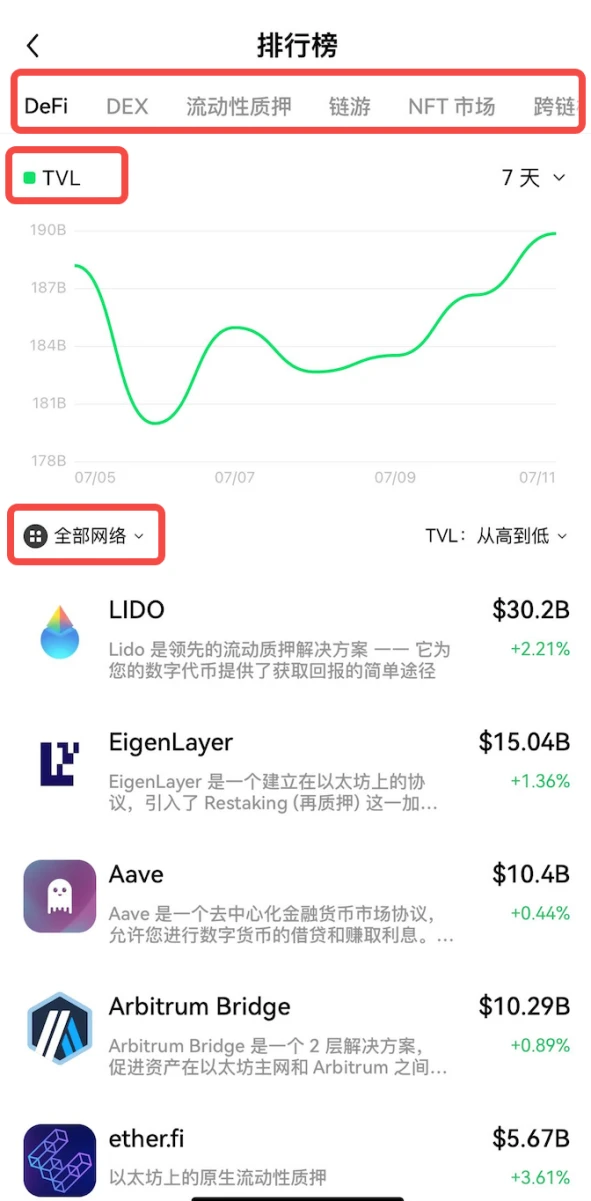
But if you find it cumbersome, you can also directly view the locked-in TVL, DEX transaction volume, lending status and other information of on-chain protocols such as DeFi and DEX in the rankings in the OKX Web3 wallet discovery section, which is very convenient.
4. What are the common misunderstandings and precautions when conducting on-chain data analysis?
0x Scope: We believe that there are several common misunderstandings and important matters to pay attention to when analyzing on-chain data:
First, a common misunderstanding is about the understanding of address tags and activities. For example, transfers do not always represent buying and selling behavior, and deposit and withdrawal activities on exchanges do not necessarily reflect actual buying and selling behavior. Market makers frequently perform deposit and withdrawal operations in order to provide liquidity, so these operations should only be considered as potential market signals when the volume is significantly higher than usual.
Secondly, most users usually use more than one address, so the activity of the whole rather than a single address should be considered when conducting analysis. However, smart money may transfer funds through deposit and withdrawal operations of centralized exchanges, which means that analysis that relies solely on on-chain data does not always successfully capture all situations. In addition, over-reliance on a single data source is risky, and it is recommended to combine off-chain data for comprehensive analysis. For example, when there is a sudden fluctuation in the market, understanding possible background news, such as important economic data released by the government, can help provide a more comprehensive market context.
In addition, the information or opinions released by KOLs usually only focus on specific transaction events, and do not deeply analyze the real situation of the addresses and entities behind them. Therefore, analysts should dig deeper and understand the stories behind the data on their own. Finally, it is recommended to choose data analysis products that have been in operation for a long time and have a good reputation, which can improve the reliability of data and the accuracy of analysis.
OKX Web3: I agree with 0x scope’s point of view. New users must pay attention to several common misunderstandings and important matters when analyzing on-chain data.
First, the accuracy and reliability of the data are of paramount importance. On-chain data may be affected by various factors, resulting in incomplete or inaccurate data. In addition, we need to be wary of possible data manipulation by project teams or large holders, which may mislead the analysis results.
Secondly, a common misunderstanding is the misinterpretation of data. When analyzing on-chain indicators, it is critical to understand the context and avoid drawing conclusions based on isolated data points while ignoring the impact of the overall market situation.
In addition, over-reliance on a single indicator is also a risk. You should avoid relying on only one or two on-chain indicators to make decisions. Instead, you should use a combination of indicators and cross-reference them with off-chain data to obtain more comprehensive and reliable analysis results.
Finally, be aware that there is a gap between on-chain data and reality. For example, some on-chain activities may not be fully captured, such as off-chain transactions or the impact of second-layer solutions. Therefore, understanding the limitations of the data used is a key step in conducting effective analysis.
Conclusion
The above is the fifth issue of the Insight Data column launched by OKX, focusing on practical topics such as how novice players can establish on-chain data analysis methodology, hoping to provide a reference for new players. In future series of articles, we will continue to explore more practical data usage/analysis methods to provide references for traders and novice players to learn trading and understand the industry.
Risk Warning and Disclaimer
This article is for reference only. This article only represents the authors views and does not represent the position of OKX. This article is not intended to provide (i) investment advice or investment recommendations; (ii) an offer or solicitation to buy, sell or hold digital assets; (iii) financial, accounting, legal or tax advice. We do not guarantee the accuracy, completeness or usefulness of such information. Holding digital assets (including stablecoins and NFTs) involves high risks and may fluctuate significantly. You should carefully consider whether trading or holding digital assets is suitable for you based on your financial situation. Please consult your legal/tax/investment professionals for your specific situation. Please be responsible for understanding and complying with local applicable laws and regulations.


