


The market fluctuated and corrected in August, and we are waiting to see the new trend of the market
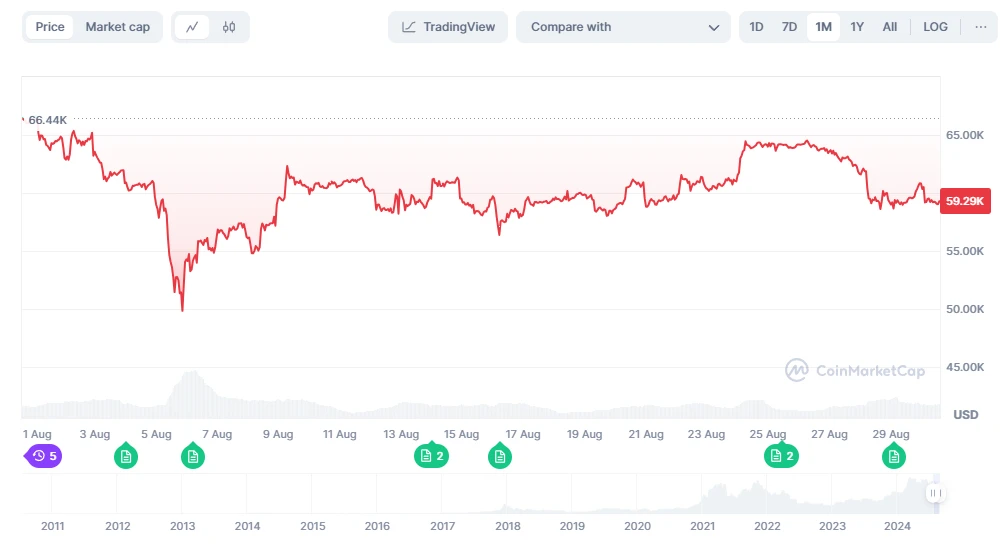
Data source: coinmarketcap
After the release of non-agricultural data in early August, the mainstream currency market experienced a sharp drop in price. Subsequently, the market has repeatedly experienced a trend of rising and falling, and the implied volatility has gradually declined from the highest level on August 5, and the overall market has shown a wide range of fluctuations. The current market urgently needs the guidance of a new round of economic data to promote the development of the next stage of the market.
The market generally expects the Fed to announce a rate cut at its meeting on September 19. However, the new non-farm payrolls data to be released on September 6 will be key. If the data is strong, it will significantly reduce the probability of the Fed cutting interest rates in mid-September. In addition, the PPI and CPI data to be released on September 11 and September 12 will also be closely watched. If these inflation indicators do not show a significant decline, it will also reduce the possibility of the Fed cutting interest rates. Therefore, investors need to pay close attention to the upcoming economic data to judge future market trends.
There are about 19 days until the next Federal Reserve interest rate meeting (September 19, 2024)
https://hk.investing.com/economic-calendar/interest-rate-decision-168
Market technical and sentiment environment analysis
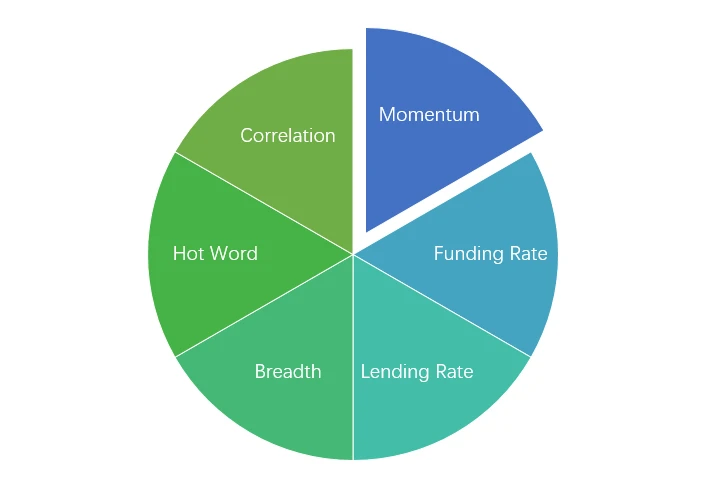
Sentiment Analysis Components

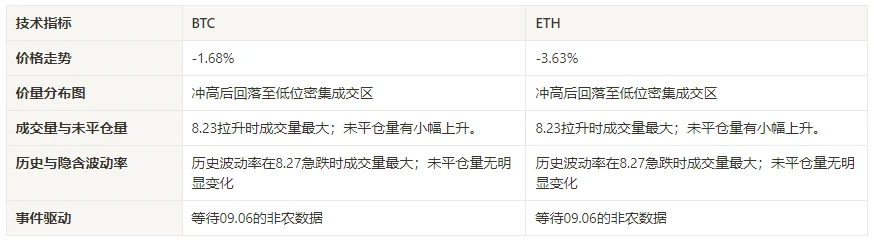
Technical indicators
Price Trends
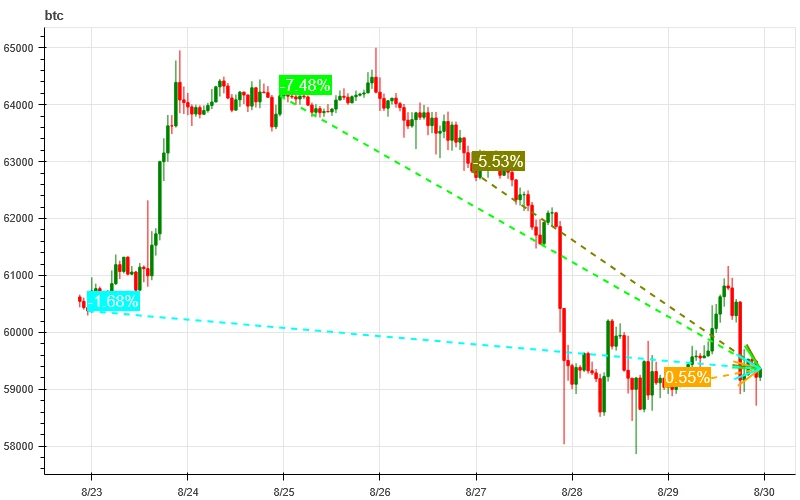
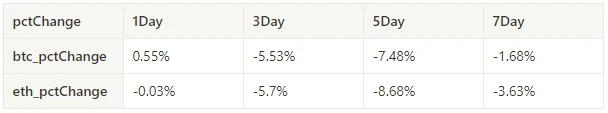
BTC price fell -1.68% and ETH price fell -3.63% over the past week.
The above picture is the price chart of BTC in the past week.
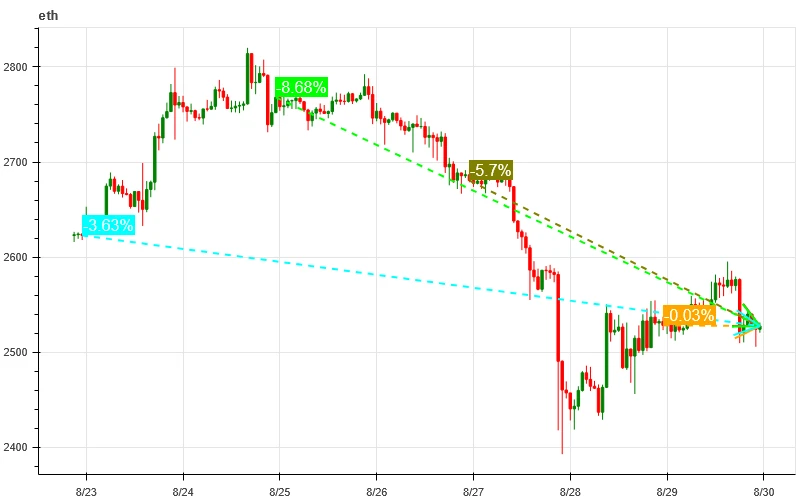
The above picture is the price chart of ETH in the past week.
The table shows the price change rate over the past week.
pctChange1Day3Day5Day7Daybtc_pctChange0.55% -5.53% -7.48% -1.68% eth_pctChange-0.03% -5.7% -8.68% -3.63%
Price Volume Distribution Chart (Support and Resistance)
In the past week, both BTC and ETH hit a high point and then fell back to a high-volume trading area.
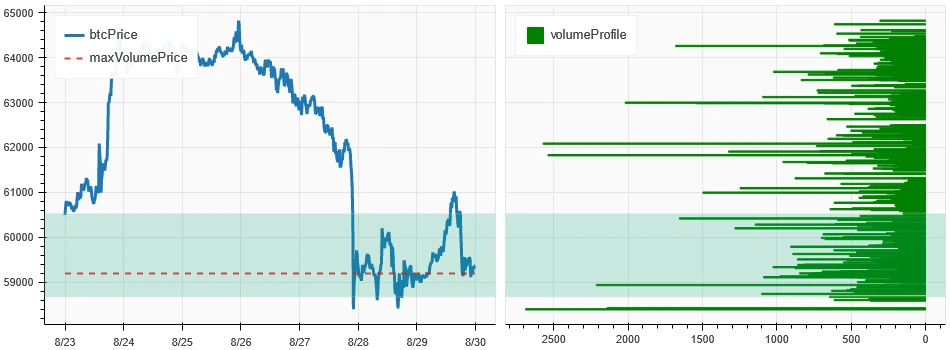
The above picture shows the distribution of BTCs dense trading areas in the past week.
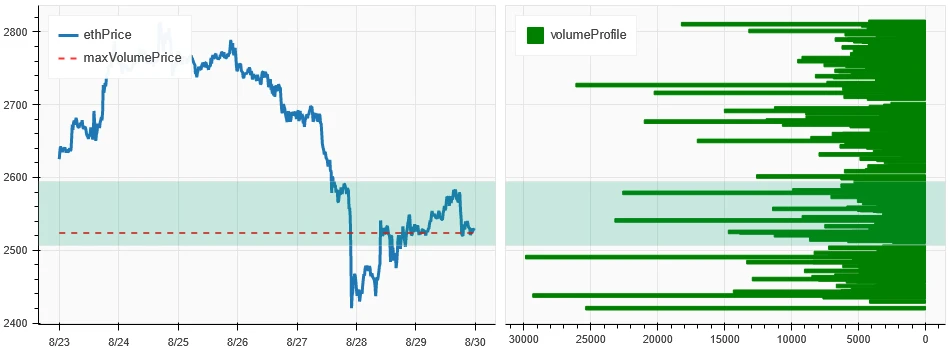
The above picture shows the distribution of ETHs dense trading areas in the past week.
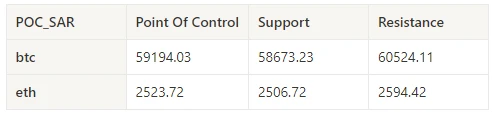
The table shows the weekly intensive trading range of BTC and ETH in the past week.
Volume and Open Interest
In the past week, the trading volume of BTC and ETH was the largest when they plummeted to 8.27; the open interest of BTC and ETH did not change significantly.
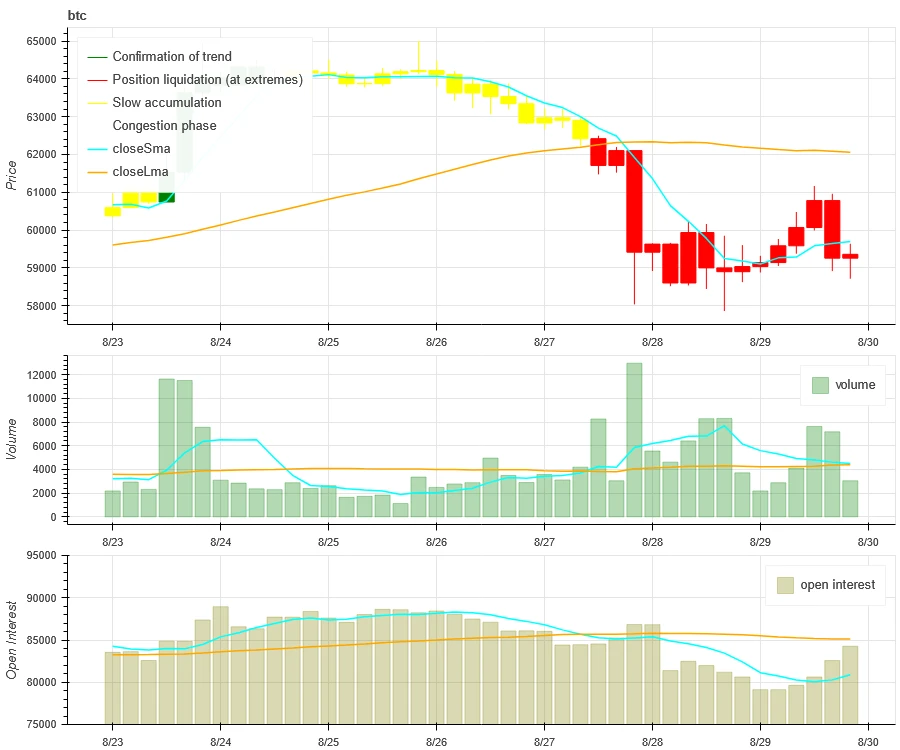
The top of the above picture shows the price trend of BTC, the middle shows the trading volume, the bottom shows the open interest, the light blue is the 1-day average, and the orange is the 7-day average. The color of the K-line represents the current state, green means the price rise is supported by the trading volume, red means closing positions, yellow means slowly accumulating positions, and black means crowded state.
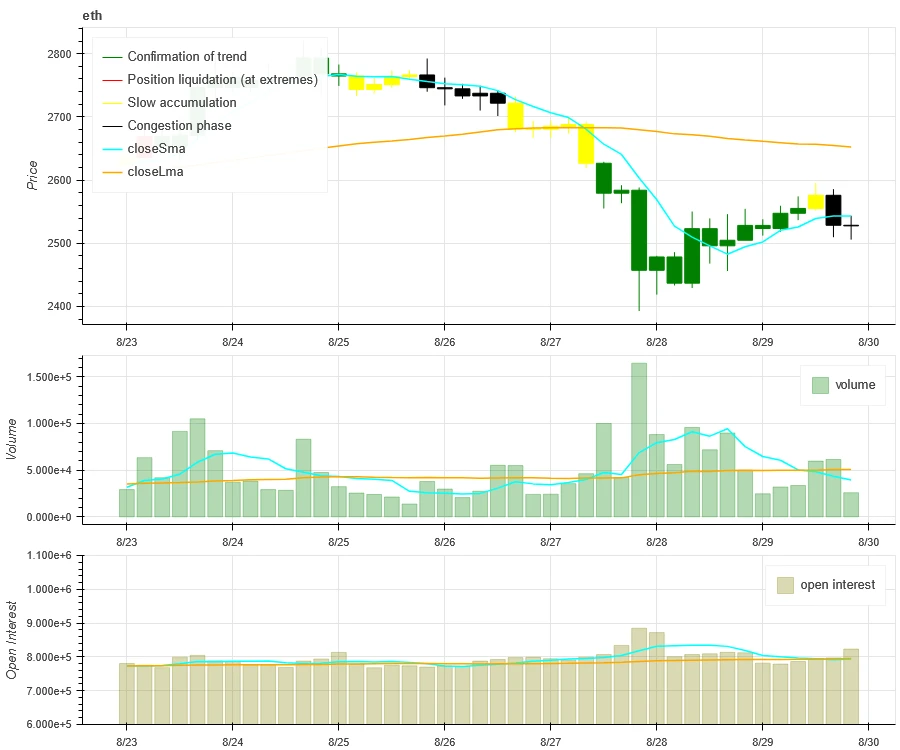
The top of the above picture shows the price trend of ETH, the middle is the trading volume, the bottom is the open interest, the light blue is the 1-day average, and the orange is the 7-day average. The color of the K-line represents the current state, green means the price rise is supported by the trading volume, red is closing positions, yellow is slowly accumulating positions, and black is crowded.
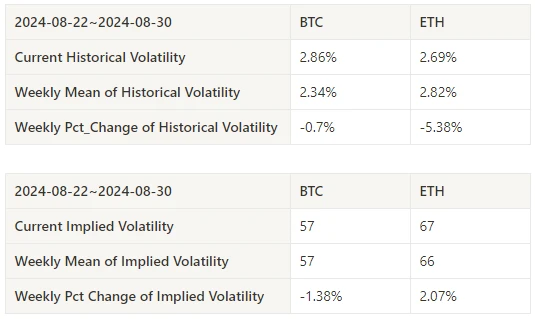
Historical Volatility vs. Implied Volatility
Historical volatility for BTC and ETH was highest this past week at 8.27; implied volatility for BTC fell while ETH rose.
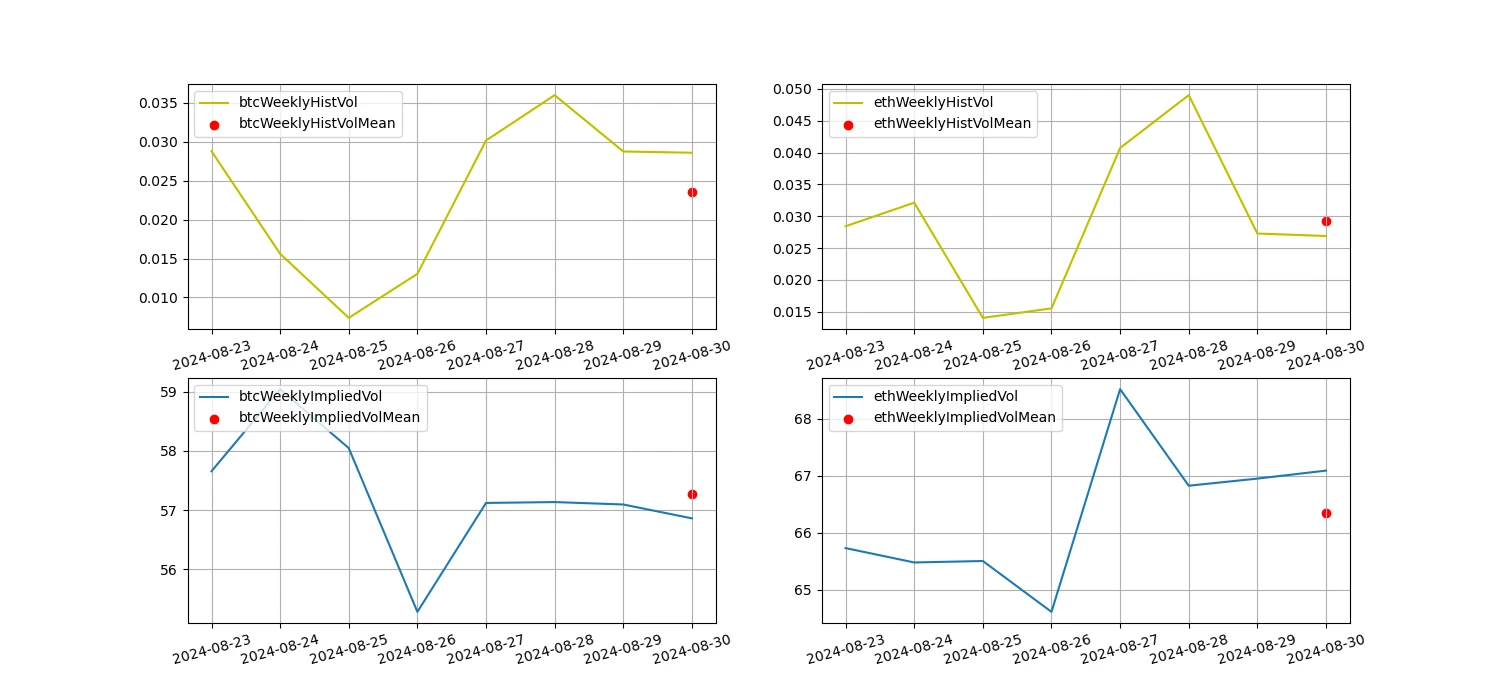
The yellow line is the historical volatility, the blue line is the implied volatility, and the red dot is its 7-day average.
Event-driven
No major data was released in the past week, and we are waiting for the release of non-farm data on 09.06.
Emotional indicators
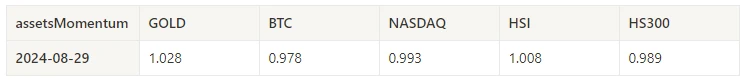
Momentum Sentiment
In the past week, among Bitcoin/Gold/Nasdaq/Hang Seng Index/SSE 300, gold was the strongest, while Bitcoin performed the worst.
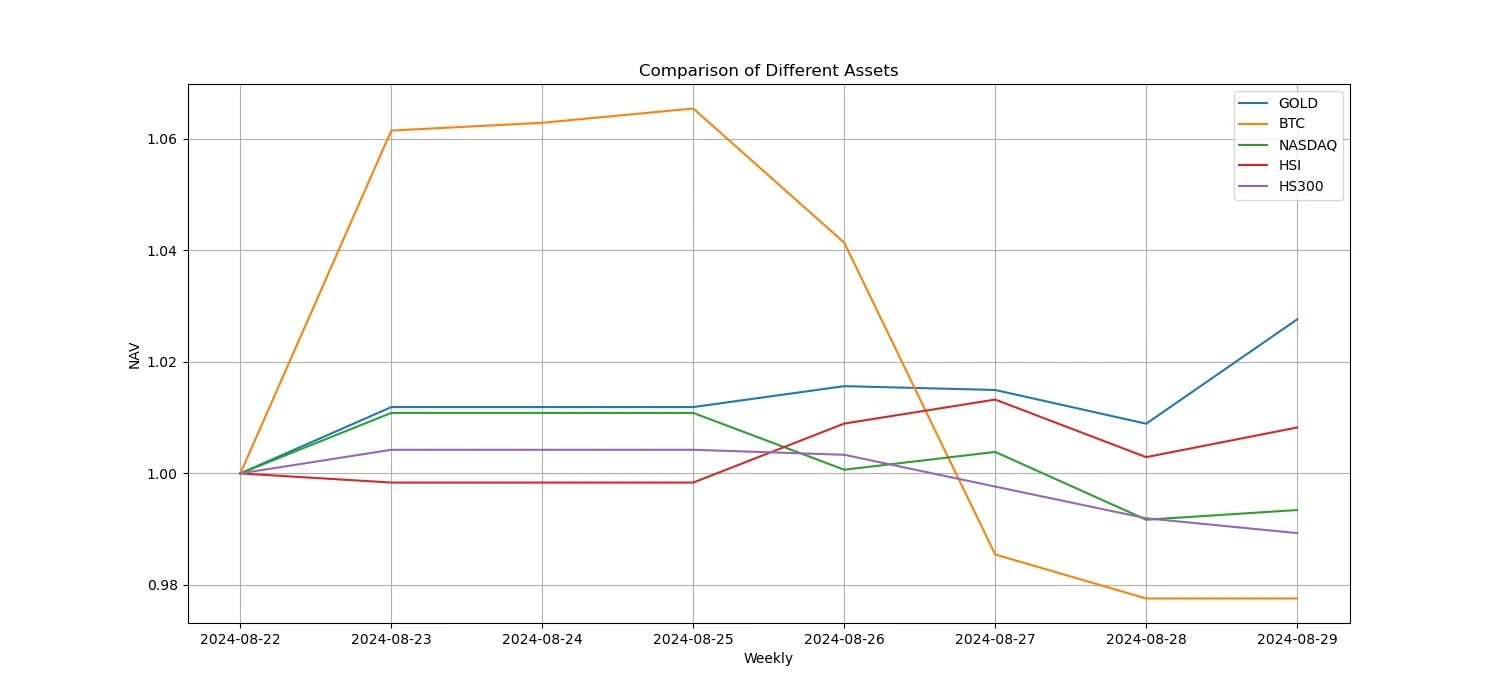
The above picture shows the trend of different assets in the past week.
Lending Rate_Lending Sentiment
The average annualized return on USD lending over the past week was 9.9%, and short-term interest rates rose to 12%.
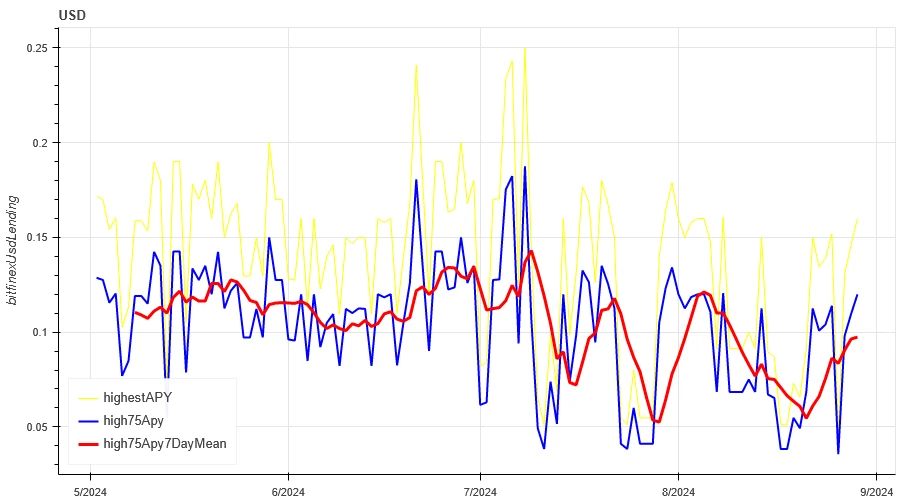
The yellow line is the highest price of USD interest rate, the blue line is 75% of the highest price, and the red line is the 7-day average of 75% of the highest price.
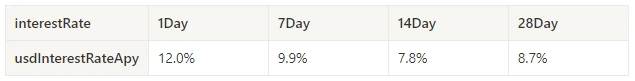
The table shows the average returns of USD interest rates at different holding days in the past
Funding Rate_Contract Leverage Sentiment
The average annualized return on BTC fees in the past week was 0.3%, and contract leverage sentiment remained low.
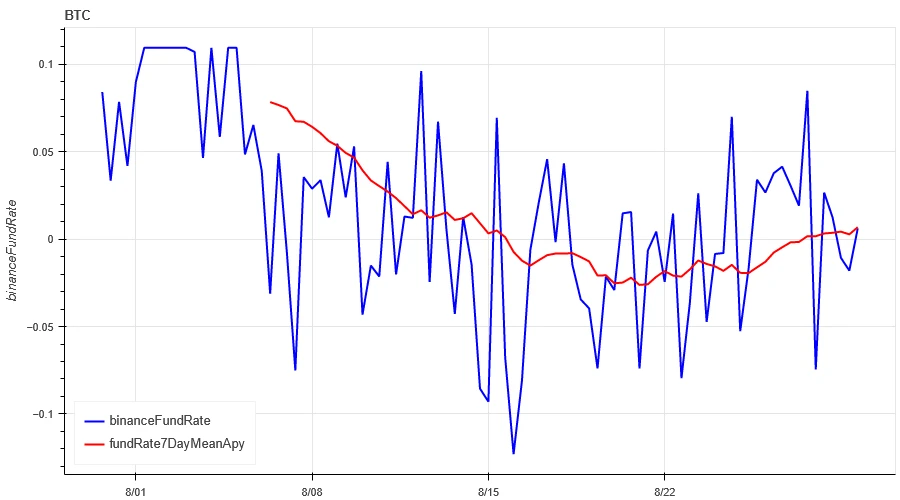
The blue line is the funding rate of BTC on Binance, and the red line is its 7-day average
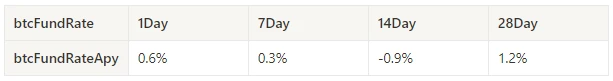
The table shows the average return of BTC fees for different holding days in the past.
Market Correlation_Consensus Sentiment
The correlation among the 129 coins selected in the past week was around 0.8, and the consistency between different varieties was high.
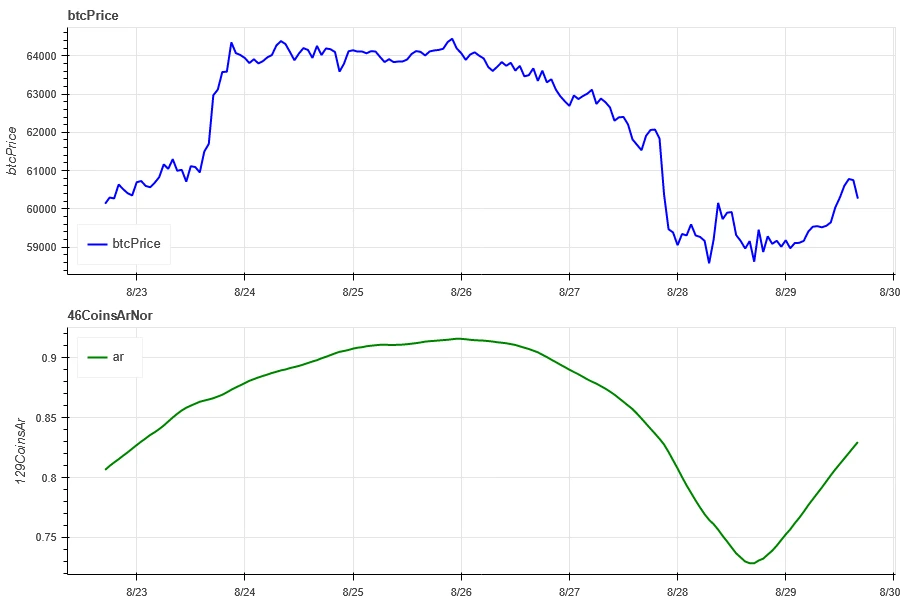
In the above picture, the blue line is the price of Bitcoin, and the green line is [1000 floki, 1000 lunc, 1000 pepe, 1000 shib, 100 0x ec, 1inch, aave, ada, agix, algo, ankr, ant, ape, apt, arb, ar, astr, atom, audio, avax, axs, bal, band, bat, bch, bigtime, blur, bnb, btc, celo, cfx, chz, ckb, comp, crv, cvx, cyber, dash, doge, dot, dydx, egld, enj, ens, eos,etc, eth, fet, fil, flow, ftm, fxs, gala, gmt, gmx, grt, hbar, hot, icp, icx , imx, inj, iost, iotx, jasmy, kava, klay, ksm, ldo, link, loom, lpt, lqty, lrc, ltc, luna 2, magic, mana, matic, meme, mina, mkr, near, neo, ocean, one, ont, op, pendle, qnt, qtum, rndr, rose, rune, rvn, sand, sei, sfp, skl, snx , sol, ssv, stg, storj, stx, sui, sushi, sxp, theta, tia, trx, t, uma, uni, vet, waves, wld, woo, xem, xlm, xmr, xrp, xtz, yfi, zec, zen, zil, zrx] overall correlation
Market Breadth_Overall Sentiment
Among the 129 coins selected in the past week, 41% of the coins were priced above the 30-day moving average, 48% of the coins were priced above the 30-day moving average relative to BTC, 18% of the coins were more than 20% away from the lowest price in the past 30 days, and 10% of the coins were less than 10% away from the highest price in the past 30 days. The market breadth indicator in the past week showed that most coins in the overall market returned to a downward trend.
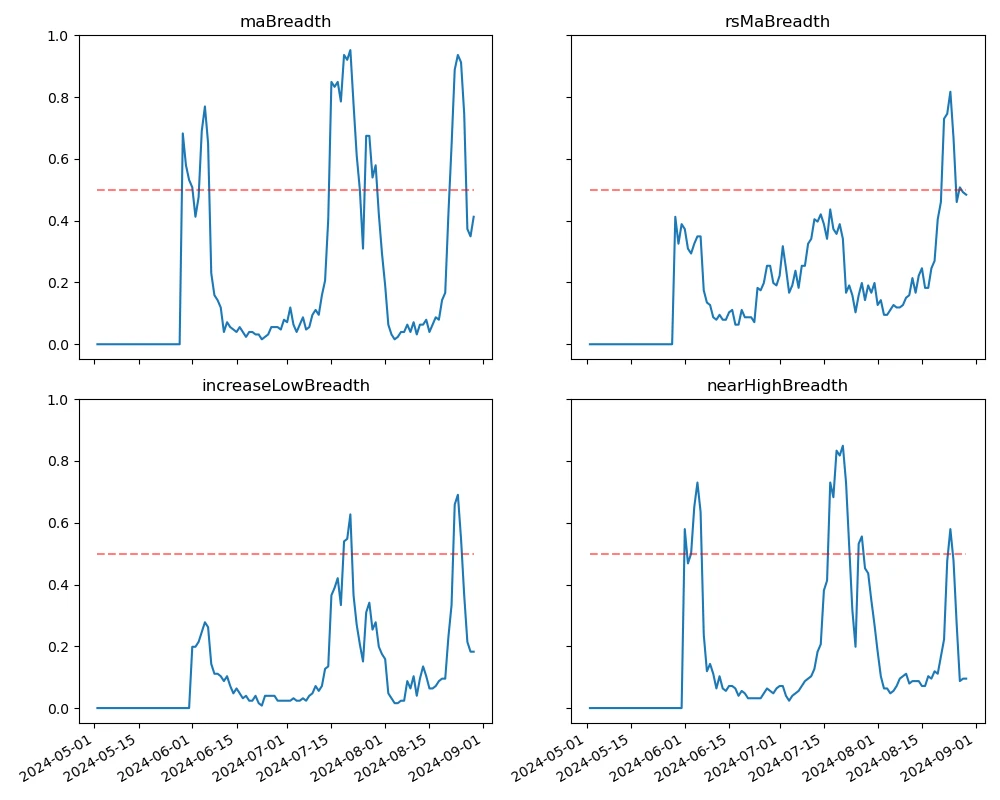
The picture above is [bnb, btc, sol, eth, 1000 floki, 1000 lunc, 1000 pepe, 1000 sats, 1000 shib, 100 0x ec, 1inch, aave, ada, agix, ai, algo, alt, ankr, ape, apt, arb, ar, astr, atom, avax, axs, bal, band, bat, bch, bigtime, blur, cake, celo, cfx, chz, ckb, comp, crv, cvx, cyber, dash, doge, dot, dydx, egld, enj, ens, eos,etc, fet, fil, flow, ftm, fxs, gala, gmt, gmx, grt, hbar, hot , icp, icx, idu, imx, inj, iost, iotx, jasmy, jto, jup, kava, klay, ksm, ldo, link, loom, lpt, lqty, lrc, ltc, luna 2, magic, mana, manta, mask, matic, meme, mina, mkr, near, neo, nfp, ocean, one, ont, op, ordi, pendle, pyth, qnt, qtum, rndr, robin, rose, rune, rvn, sand, sei, sfp, skl, snx, ssv, stg, storj, stx, sui, sushi, sxp, theta, tia, trx, t, uma, uni, vet, waves, wif, wld, woo,xai, xem, xlm, xmr, xrp, xtz, yfi, zec, zen, zil, zrx ] 30-day proportion of each width indicator

Summarize
In the past week, the prices of Bitcoin (BTC) and Ethereum (ETH) fell by -1.68% and -3.63% after a short-term surge. After a short-term surge, the prices of both fell back to a low-level dense trading area. On August 27, the prices of both fell sharply, and the trading volume on that day reached a peak, while the open interest did not change significantly. In terms of volatility, the historical volatility reached its highest point on the decline on August 27, however, the implied volatility performance was differentiated: BTC implied volatility fell, while ETH rose. In the performance comparison of different assets, gold was the strongest among Bitcoin, Nasdaq, Hang Seng Index and CSI 300, while Bitcoin performed the weakest. The average annualized yield of USD lending is 9.9%. The average annualized return of BTC funding rate is 0.3%, indicating that the leverage sentiment of the contract is still low. The correlation between the selected 129 currencies remains around 0.8, showing a high consistency between different varieties. Market breadth indicators show that most cryptocurrencies in the overall market have returned to a downward trend.
Twitter: @ https://x.com/CTA_ChannelCmt
Website: channelcmt.com


