


The market fell after the release of non-farm data
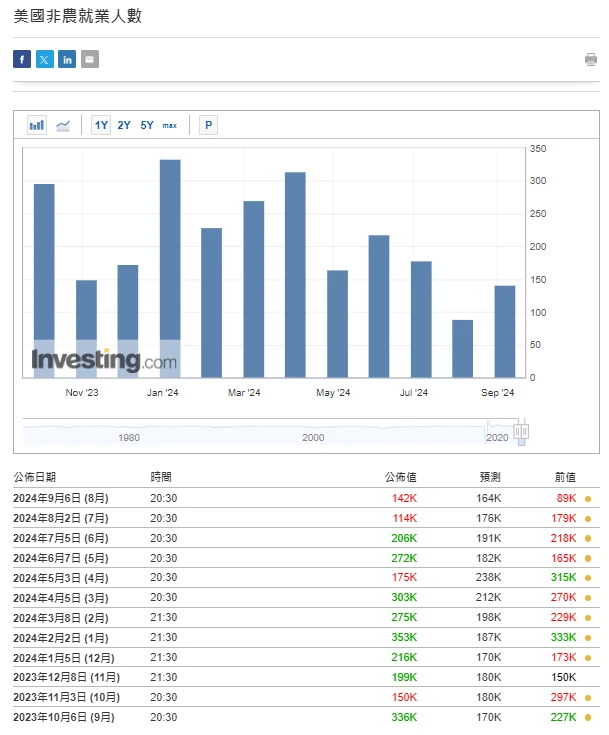
Data source: investing.com
After the release of the US non-farm data for August, the market reaction was mixed, neither fully meeting optimistic expectations nor pessimistic forecasts. The unemployment rate dropped from 4.3% to 4.2%, in line with expectations, eliminating the recession signal released by the Sam Rule. However, the number of new jobs in August was only 142,000, lower than the expected 165,000, and the previous value was significantly revised down, further showing signs of a slowdown in the labor market.
Market funds were in a state of entanglement, and pessimism once pushed the probability of the Federal Reserve cutting interest rates by 50 basis points in September from 40% to 50%, which was the same as the expectation of a 25 basis point cut. Subsequently, the market began to re-evaluate the speeches of Federal Reserve officials.
Fed Governor Waller made dovish remarks, saying that if appropriate, he would advocate for a pre-emptive rate cut and did not rule out the possibility of a substantial rate cut. FOMC permanent voting member and New York Fed President Williams, known as the third person in charge of the Fed, believed that it was appropriate to cut interest rates at this time, but did not explicitly support a 50 basis point rate cut.
After the data was released, Bitcoin rose slightly from $56,000 to $57,000, but then began to fall, dropping to a low of about $52,500. The overall digital currency market fell accordingly, showing a clear state of pressure.
There are about 12 days until the next Fed meeting (September 19, 2024)
https://hk.investing.com/economic-calendar/interest-rate-decision-168
Market technical and sentiment environment analysis

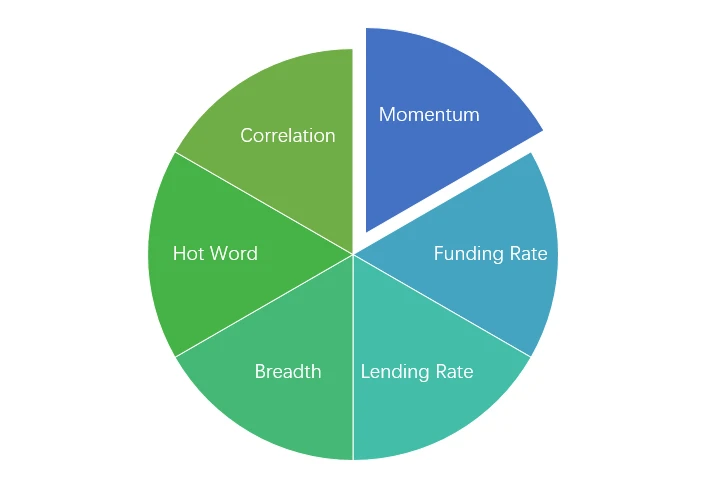
Sentiment Analysis Components

Technical indicators
Price Trends
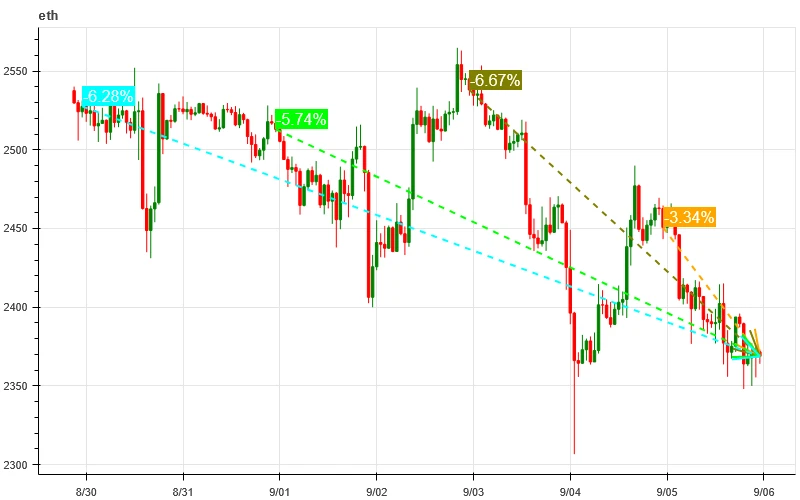
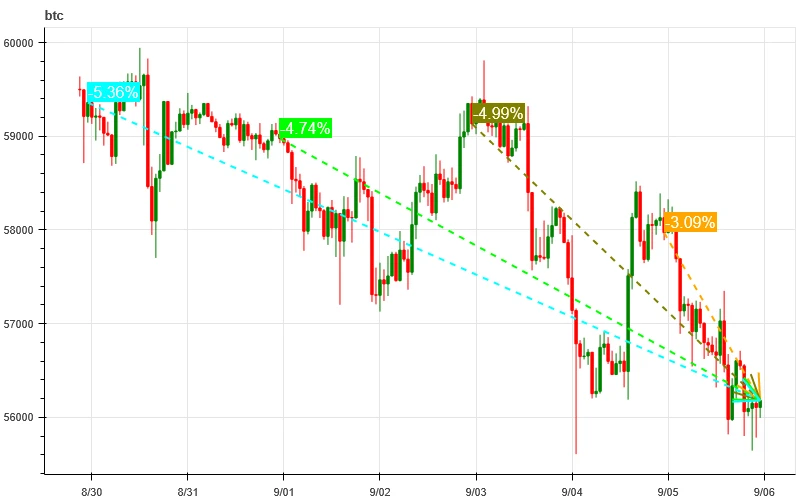
BTC price fell -5.36% and ETH price fell -6.28% in the past week.
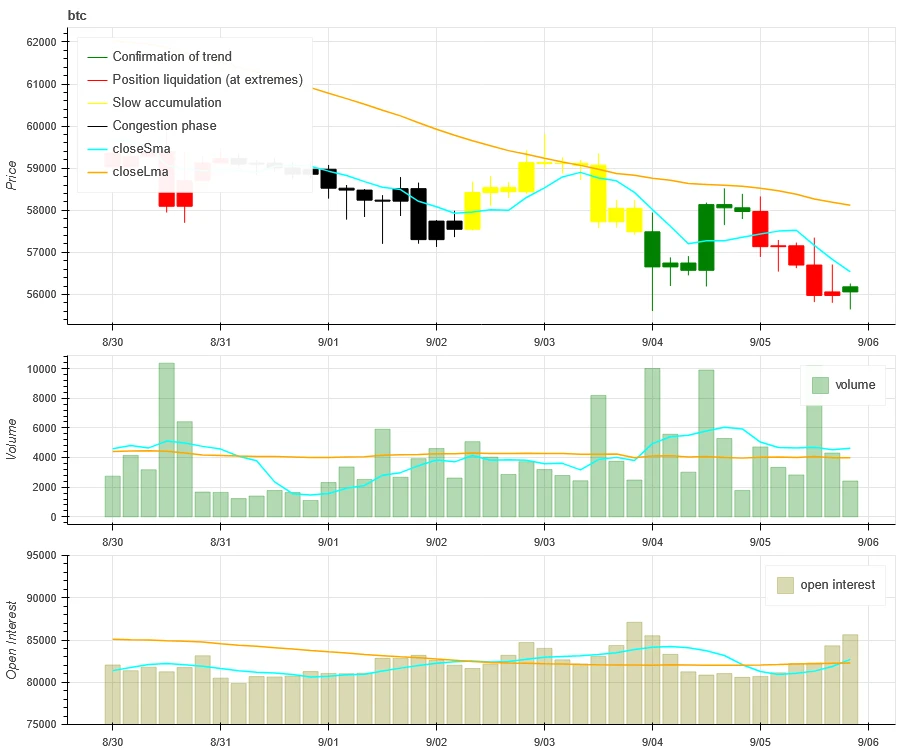
The above picture is the price chart of BTC in the past week.
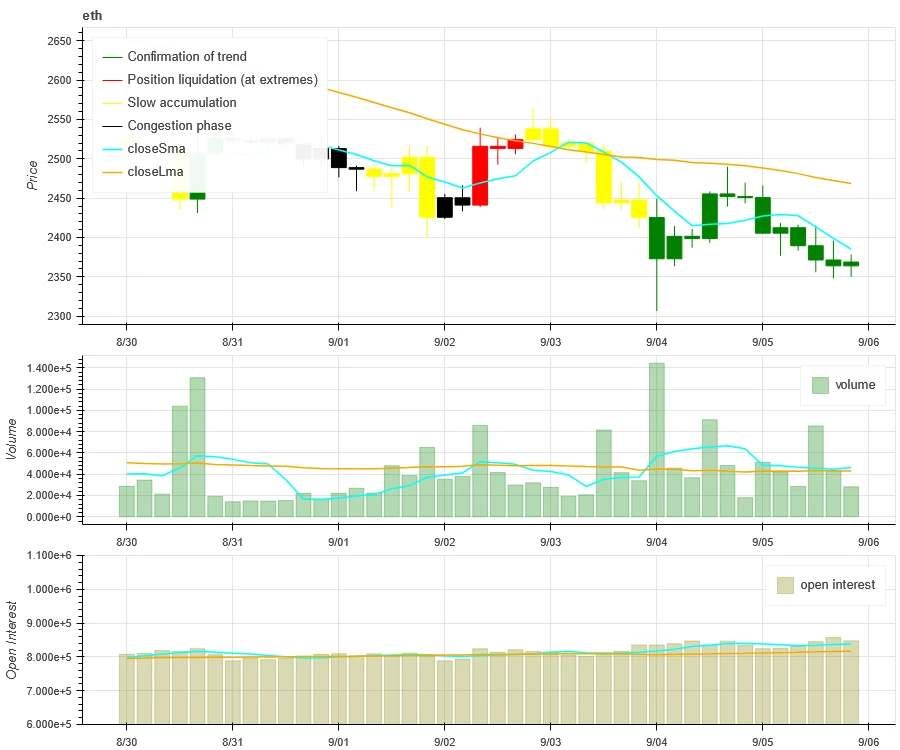
The above picture is the price chart of ETH in the past week.
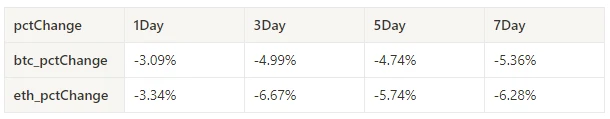
The table shows the price change rate over the past week.
Price Volume Distribution Chart (Support and Resistance)
In the past week, both BTC and ETH fell below the intensive trading area and increased in volume at low levels.
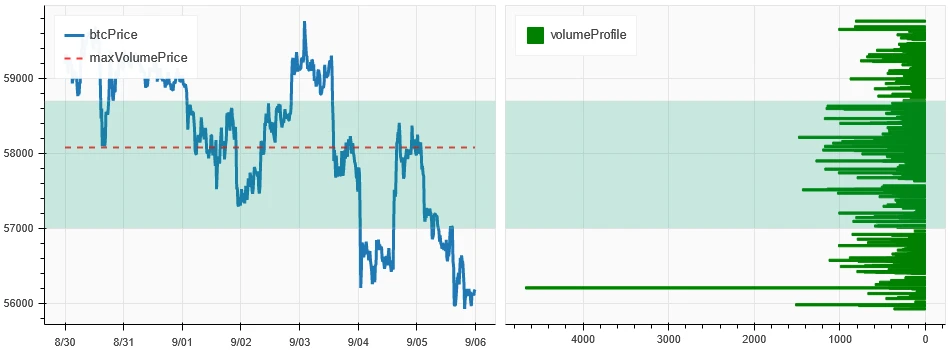
The above picture shows the distribution of BTCs dense trading areas in the past week.
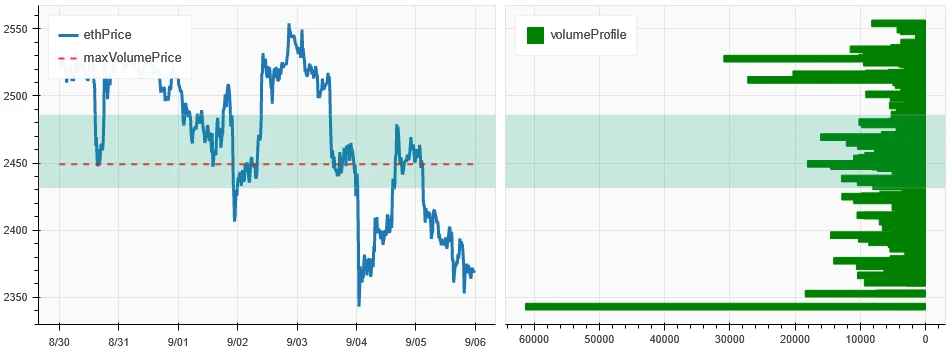
The above picture shows the distribution of ETHs dense trading areas in the past week.
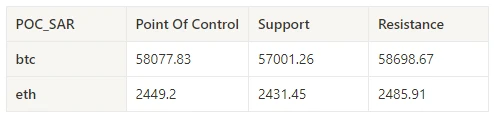
The table shows the weekly intensive trading range of BTC and ETH in the past week.
Volume and Open Interest
In the past week, both BTC and ETH had the largest trading volume when they hit the low on September 4; the open interest of both BTC and ETH increased.
The top of the above picture shows the price trend of BTC, the middle shows the trading volume, the bottom shows the open interest, the light blue is the 1-day average, and the orange is the 7-day average. The color of the K-line represents the current state, green means the price rise is supported by the trading volume, red means closing positions, yellow means slowly accumulating positions, and black means crowded state.
The top of the above picture shows the price trend of ETH, the middle is the trading volume, the bottom is the open interest, the light blue is the 1-day average, and the orange is the 7-day average. The color of the K-line represents the current state, green means the price rise is supported by the trading volume, red is closing positions, yellow is slowly accumulating positions, and black is crowded.
Historical Volatility vs. Implied Volatility
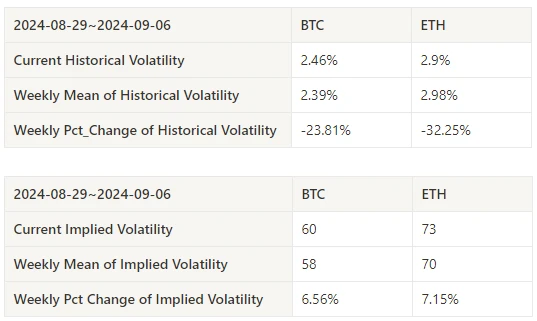
In the past week, the historical volatility of BTC and ETH was the highest when they began to fall at 8.30; the implied volatility of BTC and ETH both increased.
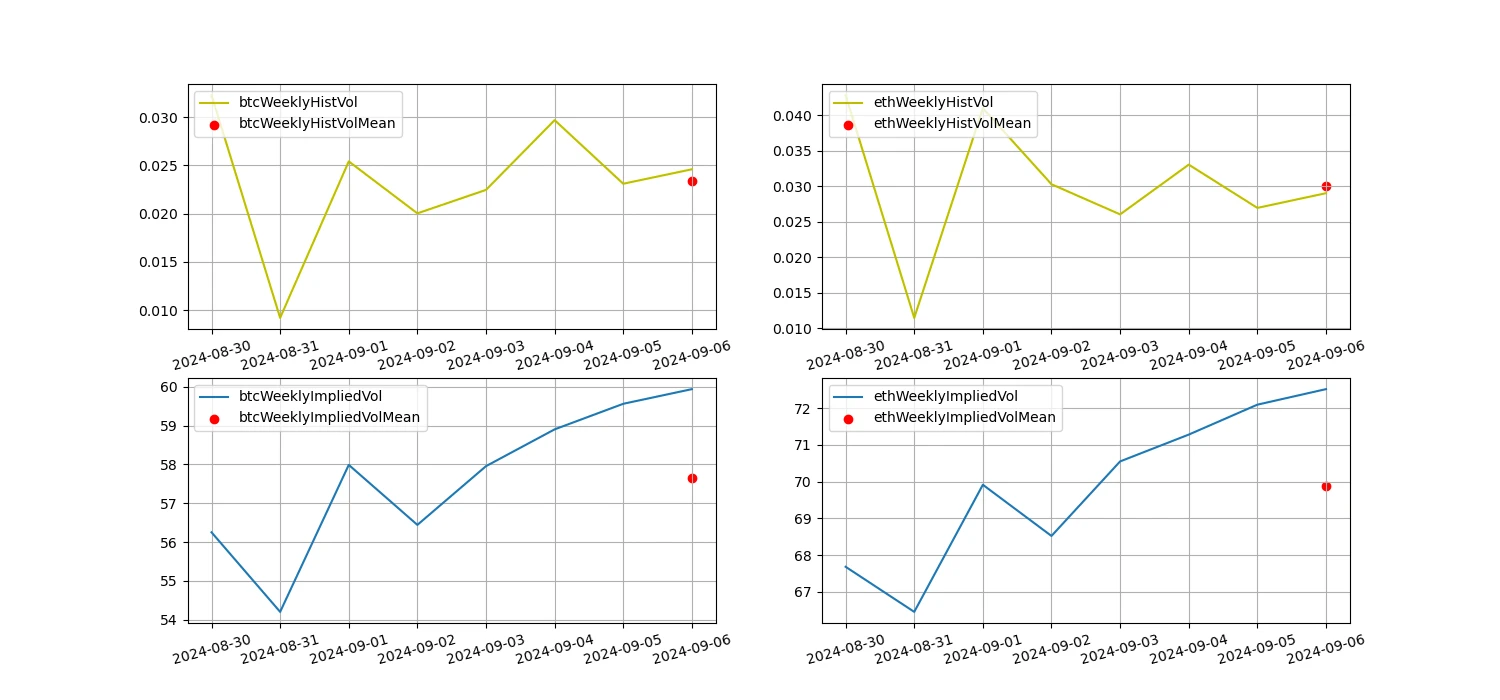
The yellow line is the historical volatility, the blue line is the implied volatility, and the red dot is its 7-day average.
Event-driven
The crypto market as a whole fell after the release of non-farm data this past week.
Sentiment Indicators
Momentum Sentiment
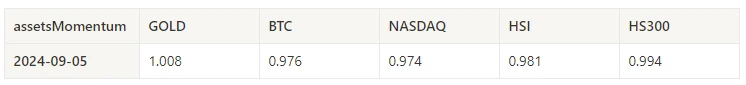
In the past week, among Bitcoin/gold/Nasdaq/Hang Seng Index/CSI 300, gold was the strongest, while Nasdaq performed the worst.
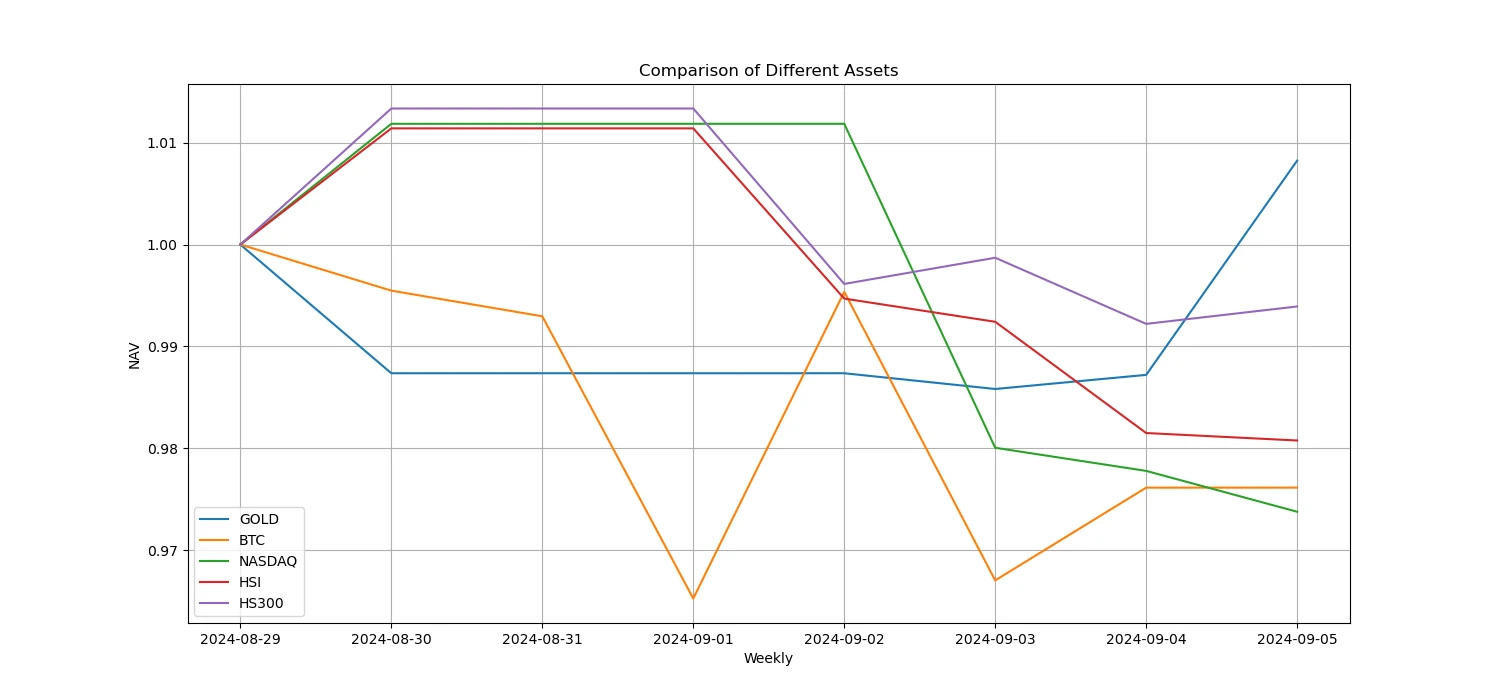
The above picture shows the trend of different assets in the past week.
Lending Rate_Lending Sentiment
The average annualized return on USD lending over the past week was 10.2%, and short-term interest rates rose to 12.9%.
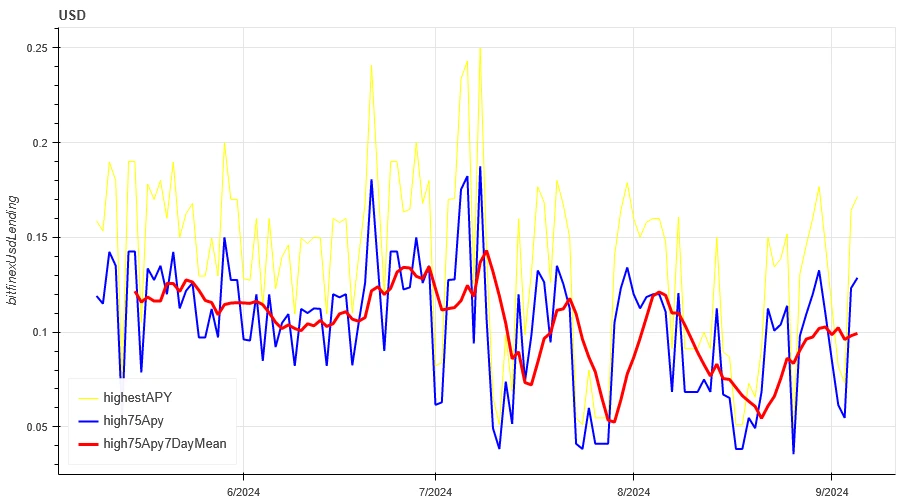
The yellow line is the highest price of USD interest rate, the blue line is 75% of the highest price, and the red line is the 7-day average of 75% of the highest price.
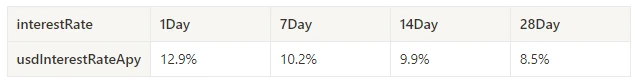
The table shows the average returns of USD interest rates at different holding days in the past
Funding Rate_Contract Leverage Sentiment
The average annualized return on BTC fees in the past week was 1.9%, and contract leverage sentiment remained low.
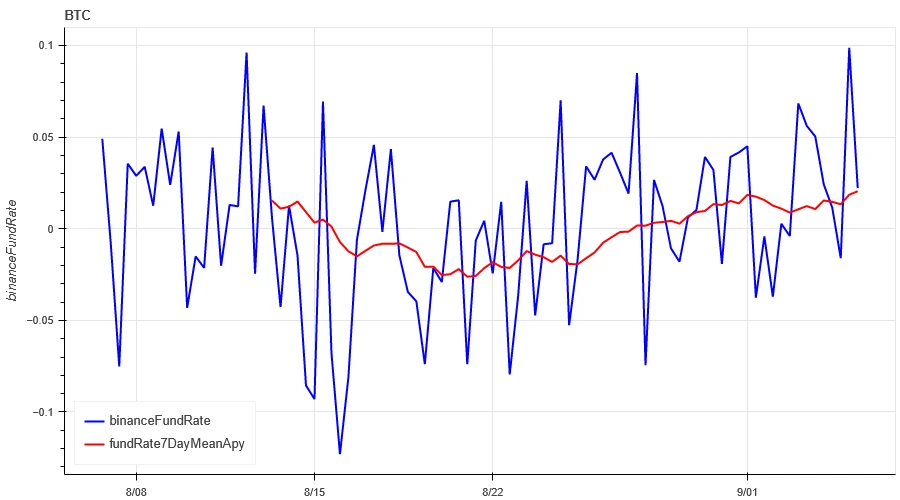
The blue line is the funding rate of BTC on Binance, and the red line is its 7-day average
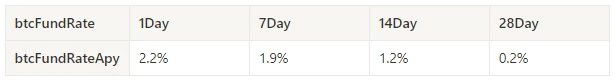
The table shows the average return of BTC fees for different holding days in the past.
Market Correlation_Consensus Sentiment
The correlation among the 129 coins selected in the past week was around 0.72, and the consistency between different varieties has dropped from a high level.
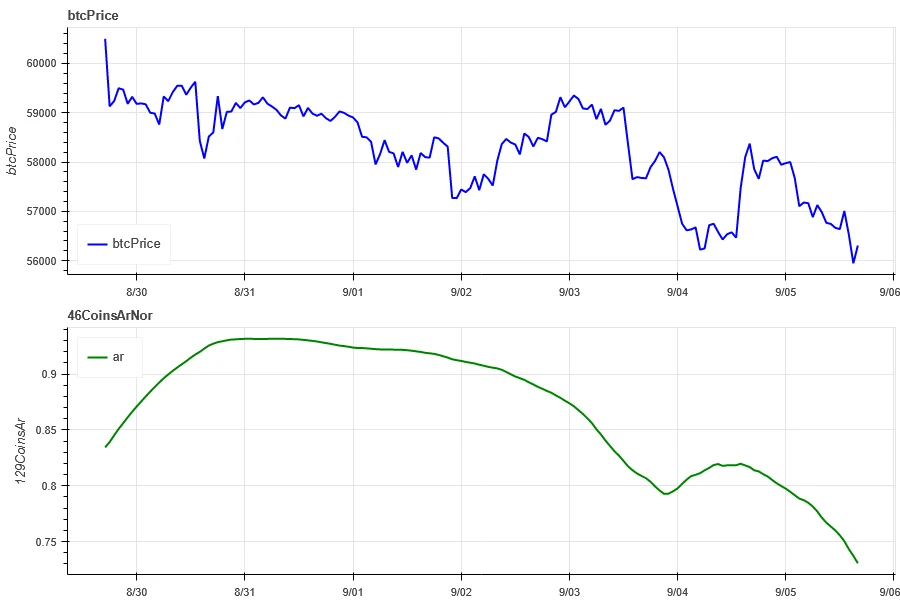
In the above picture, the blue line is the price of Bitcoin, and the green line is [1000 floki, 1000 lunc, 1000 pepe, 1000 shib, 100 0x ec, 1inch, aave, ada, agix, algo, ankr, ant, ape, apt, arb, ar, astr, atom, audio, avax, axs, bal, band, bat, bch, bigtime, blur, bnb, btc, celo, cfx, chz, ckb, comp, crv, cvx, cyber, dash, doge, dot, dydx, egld, enj, ens, eos,etc, eth, fet, fil, flow, ftm, fxs, gala, gmt, gmx, grt, hbar, hot, icp, icx , imx, inj, iost, iotx, jasmy, kava, klay, ksm, ldo, link, loom, lpt, lqty, lrc, ltc, luna 2, magic, mana, matic, meme, mina, mkr, near, neo, ocean, one, ont, op, pendle, qnt, qtum, rndr, rose, rune, rvn, sand, sei, sfp, skl, snx , sol, ssv, stg, storj, stx, sui, sushi, sxp, theta, tia, trx, t, uma, uni, vet, waves, wld, woo, xem, xlm, xmr, xrp, xtz, yfi, zec, zen, zil, zrx] overall correlation
Market Breadth_Overall Sentiment
Among the 129 coins selected in the past week, 7% had prices above the 30-day moving average, 34% had prices above the 30-day moving average relative to BTC, 4% were more than 20% away from the lowest price in the past 30 days, and 6% were less than 10% away from the highest price in the past 30 days. The market breadth indicator in the past week showed that most coins in the overall market continued to fall.
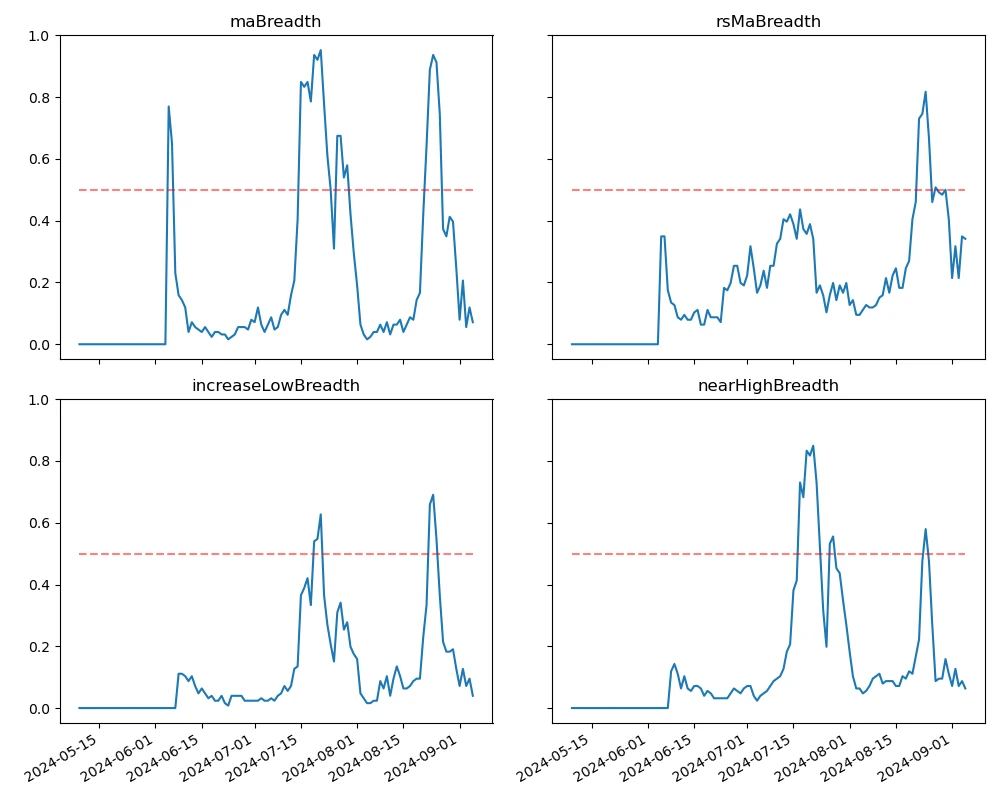
The picture above is [bnb, btc, sol, eth, 1000 floki, 1000 lunc, 1000 pepe, 1000 sats, 1000 shib, 100 0x ec, 1inch, aave, ada, agix, ai, algo, alt, ankr, ape, apt, arb, ar, astr, atom, avax, axs, bal, band, bat, bch, bigtime, blur, cake, celo, cfx, chz, ckb, comp, crv, cvx, cyber, dash, doge, dot, dydx, egld, enj, ens, eos,etc, fet, fil, flow, ftm, fxs, gala, gmt, gmx, grt, hbar, hot , icp, icx, idu, imx, inj, iost, iotx, jasmy, jto, jup, kava, klay, ksm, ldo, link, loom, lpt, lqty, lrc, ltc, luna 2, magic, mana, manta, mask, matic, meme, mina, mkr, near, neo, nfp, ocean, one, ont, op, ordi, pendle, pyth, qnt, qtum, rndr, robin, rose, rune, rvn, sand, sei, sfp, skl, snx, ssv, stg, storj, stx, sui, sushi, sxp, theta, tia, trx, t, uma, uni, vet, waves, wif, wld, woo,xai, xem, xlm, xmr, xrp, xtz, yfi, zec, zen, zil, zrx ] 30-day proportion of each width indicator
intersection (the intersection that satisfies four conditions) {}
Summarize
In the past week, the prices of Bitcoin (BTC) and Ethereum (ETH) fell by -5.36% and -6.38% after hitting a high. The prices of both fell in a wide range and fell below the recent intensive trading area. On September 4, the prices of both broke through the recent low and rebounded. The trading volume on that day reached a peak, and the open interest volume increased slightly. In terms of volatility, the historical volatility reached its highest point during the decline on August 30, however, the implied volatility of BTC and ETH increased. In the performance comparison of different assets, gold is the strongest among Bitcoin, Nasdaq, Hang Seng Index and CSI 300, while Nasdaq is the weakest. The average annualized yield of USD lending is 10.2%. The average annualized return of BTC funding rate is 1.9%, indicating that the leverage sentiment of contracts is still low. The correlation between the selected 129 currencies is around 0.72, showing that the consistency between different varieties has declined from a high level. Market breadth indicators show that most cryptocurrencies in the overall market continue to fall. The overall crypto market fell after the release of non-agricultural data.
Twitter: @ https://x.com/CTA_ChannelCmt
Website: channelcmt.com


