


Introduction: In the altcoin bear market, fundamental investment is still effective
There is no doubt that this bull market cycle is the worst performing one for altcoins.
Unlike the historical pattern that the prices of various altcoins were active after the start of the past few bull markets, resulting in a rapid decline in BTCs market share, in this round of bull market, since the market bottomed out in November 2022, BTCs market share has continued to rise from around 38%, and is currently firmly above 61%. This is against the background of a rapid expansion in the number of altcoins in this cycle, which shows how weak the prices of altcoins are in this round.
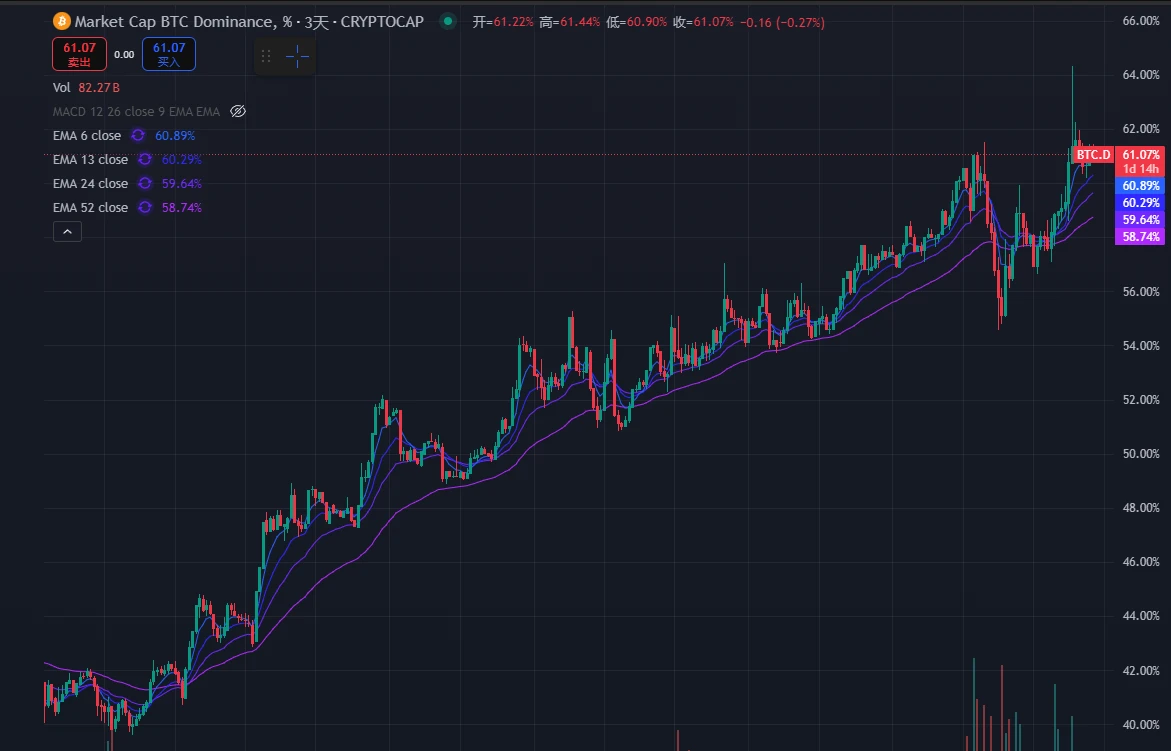
BTC market share trend, source: Tradingview
This round of market has basically confirmed the deduction made by Mint Ventures in the article Preparing for the Main Uptrend of the Bull Market, My Phased Thoughts on This Cycle in March 2024. In the original article, the author believes that:
Of the four major driving factors of this bull market, three are full and one is missing:
BTC halving (expectation of supply and demand adjustment), √
Monetary policy easing or easing expectations, √
Relaxation of regulatory policies,√
New asset model and business model innovation, ×
Therefore, we should lower our price expectations for the last round of altcoins, including smart contract platforms (L1\L2), games, Depin, NFT, and Defi. Therefore, the strategy recommended for this round of bull market was:
Make a higher allocation ratio on BTC and ETH (and be more optimistic about BTC, mainly BTC in the long term)
Control the allocation ratio on Defi, Gamefi, Depin, NFT and other altcoins
Choose new tracks and new projects to Bo Alpha, including: Meme, AI and BTC ecology
As of the publication of this article, the correctness of the above strategy has been basically verified (except that the performance of the BTC ecosystem is not satisfactory).
But it is worth noting that although most altcoin projects have performed poorly in this round, there are still a few altcoin projects whose price performance has been significantly better than BTC and ETH in the past year. The most typical ones are the two projects Aave and Raydium mentioned in the research report Altcoins keep falling, its time to pay attention to Defi again published by Mint Ventures in early July 24 when the altcoin market was at its lowest.
It was also from the beginning of July last year that Aaves highest increase relative to BTC exceeded 215%, and its highest increase relative to ETH was 354%. Even after the current sharp drop in prices, Aaves increase relative to BTC is 77%, and its increase relative to ETH is 251%.
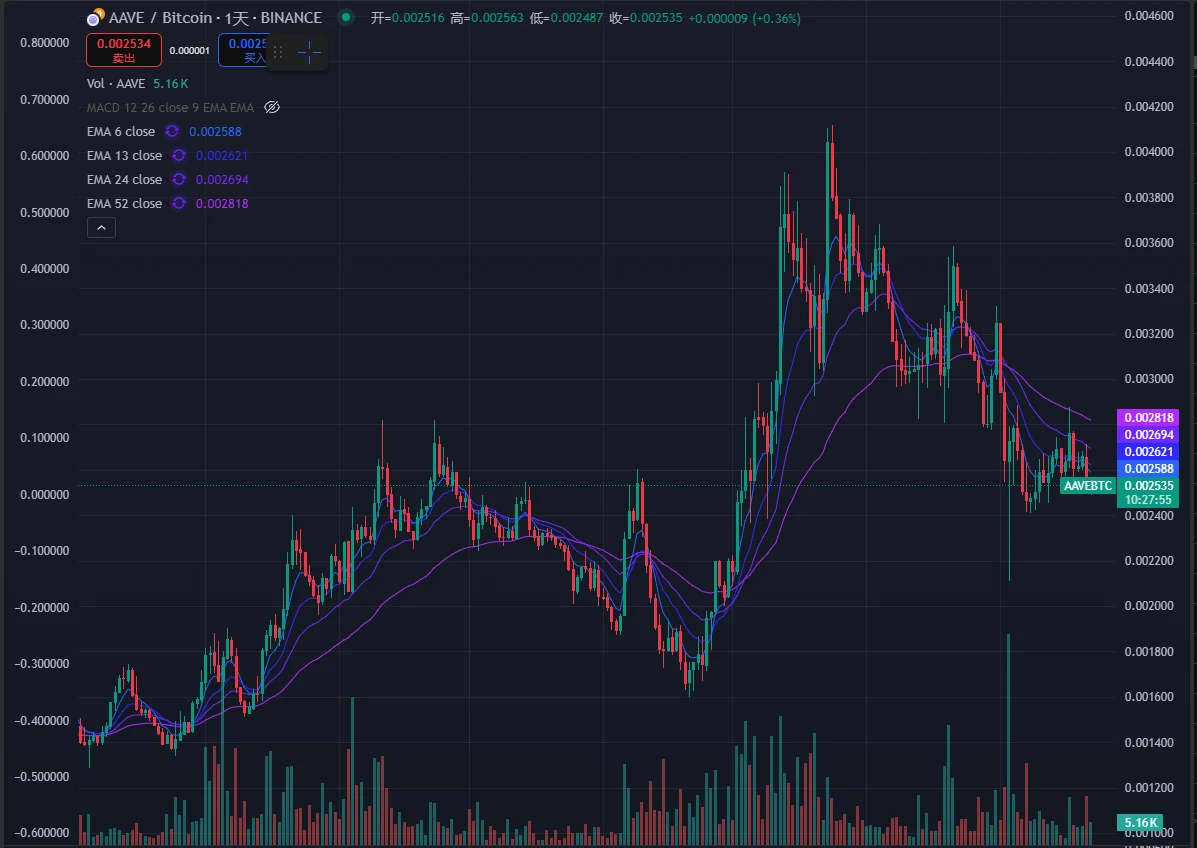
Aave/BTC exchange rate trend, source: Tradingview
Since the beginning of July last year, Ray’s highest increase relative to BTC has exceeded 200%, and its highest increase relative to ETH has reached 324%. However, due to the overall decline of the Solana ecosystem and the significant negative impact of Pump.fun’s self-developed Dex, Ray’s increase relative to BTC is still positive, and it has also significantly outperformed ETH.
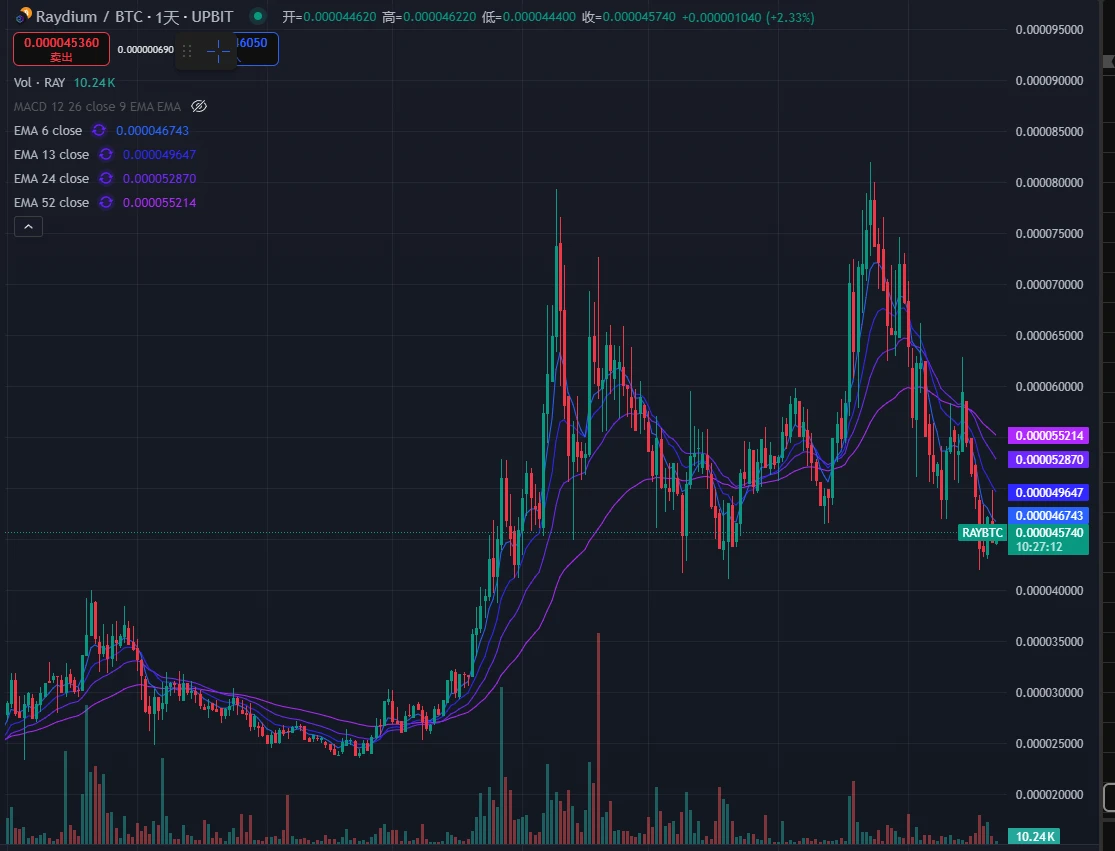
Ray/BTC exchange rate trend, source: Tradingview
Considering that BTC and ETH (especially BTC) have significantly outperformed most altcoins in this cycle, the price performance of Aave and Ray stands out among the altcoins.
This is because compared to most copycat projects, Aave and Raydium have better fundamentals, as evidenced by the fact that their core business data have hit record highs in this cycle, and they have unique moats and stable or rapidly expanding market share.
Even in a “altcoin bear market”, betting on projects with outstanding fundamentals can generate Alpha returns that exceed BTC and ETH, which is also the main purpose of our investment research work.
In this research report, Mint Ventures will identify high-quality projects with solid fundamentals from thousands of listed crypto projects, track their recent business performance and market share, analyze their competitive advantages, evaluate their challenges and potential risks, and provide a certain reference for their valuation.
It is important to emphasize that:
The projects mentioned in this article have advantages and appeal in some aspects, but they also have various problems and challenges. Different people may have completely different judgments on the same project after reading this article.
Similarly, the projects not mentioned in this article do not mean that they have poor fundamentals or that we are not optimistic about them. Please feel free to recommend us the projects you think are good and the reasons for doing so.
This article is the interim thinking of the two authors at the time of publication. It may change in the future, and the opinions are highly subjective. There may also be errors in facts, data, and reasoning logic. All opinions in this article are not investment advice. We welcome criticism and further discussion from peers and readers.
We will analyze the project from several dimensions, including its business status, competition, major challenges and risks, and valuation status. The following is the main text.
1. Lending track: Aave, Morpho, Kamino, MakerDao
DeFi is still the best track for PMF implementation in the crypto business world, and lending is one of the most important sub-tracks. User demand is mature and business revenue is stable. This track has gathered many high-quality new and old projects, each with its own advantages and disadvantages.
For lending projects, the most critical indicators are loan size (Active loans) and protocol revenue (Revenue). In addition, the protocol’s expenditure indicator - Token Incentives - must also be evaluated.
1.1 Aave: The King of Lending
Aave is one of the few projects that has gone through three crypto cycles and has maintained a stable business development. It completed financing through ICO in 2017 (the project was still called Lend at that time, and the model was peer-to-peer lending). In the last cycle, it surpassed the then lending leader Compound, and its business volume has remained at the top of lending to date. Aave currently provides services on most mainstream EVM L1 and L2.
Business Status
Aaves main business model is to operate a peer-to-pool lending platform, earning interest income from lending and liquidation penalties generated when collateral is liquidated. In addition, Aaves stablecoin business GHO has also entered its second year, and GHO will generate direct interest income for Aave.
Active loans
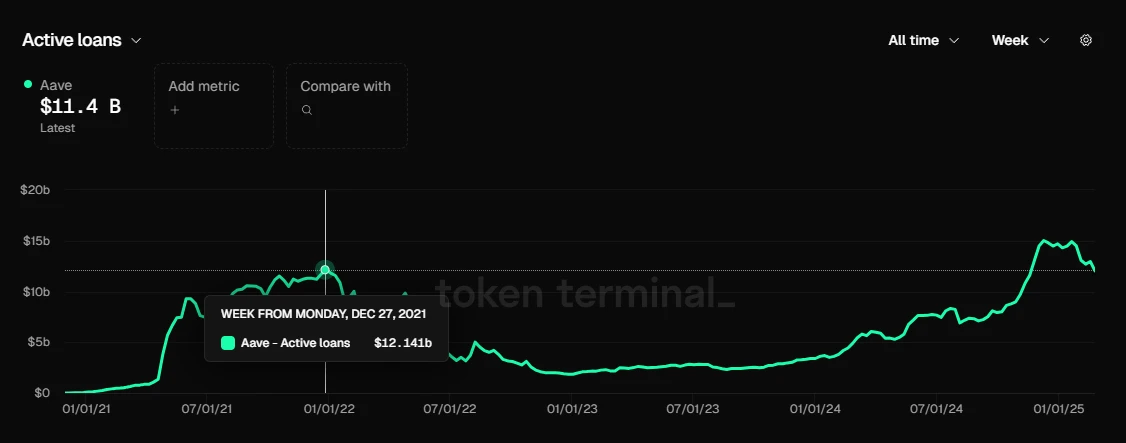
Aave’s loan size, data source: Tokenterminal
Aaves loan scale has exceeded the previous round (November 2021) peak of 12.14 billion since November last year. The current peak was at the end of January 25, with a loan volume of 15.02 billion US dollars. Recently, as market trading enthusiasm has cooled, the loan scale has also declined and is currently about 11.4 billion US dollars.
Revenue
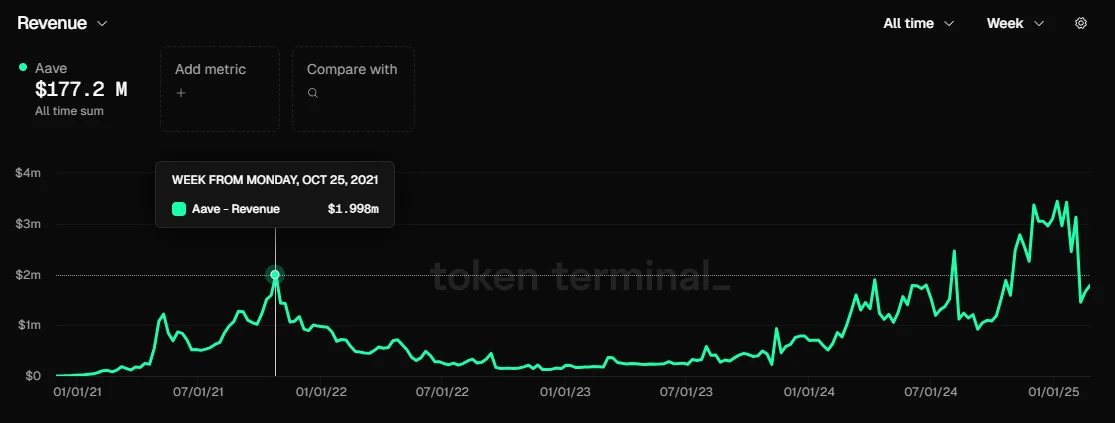
Aave’s protocol revenue, data source: Tokenterminal
Like the loan scale, Aaves protocol revenue has steadily exceeded its peak in October 2021 since November last year. In the past three months, Aaves weekly protocol revenue has been above 3 million US dollars most of the time (excluding interest income from GHO). However, in the past two weeks, as the market heat has cooled and market interest rates have fallen, single-week protocol revenue has fallen back to more than 2 million US dollars.
Token Incentives
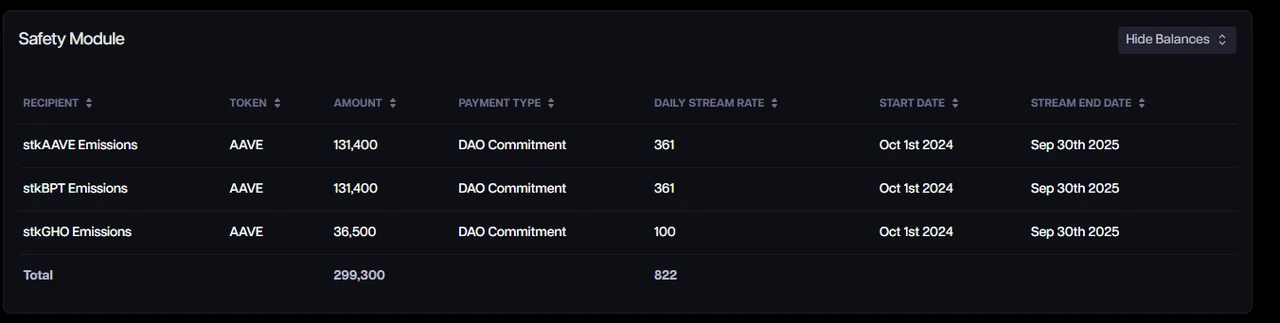
Aave token incentive expenditure, data source: Aave Analytics
Aave currently still has a huge scale of token incentives, and its daily token incentive expenditure is 822 Aaves. Based on the Aave market price of US$245, the corresponding value is approximately US$200,000. This higher incentive value is due to the sharp rise in Aave tokens in the past six months.
However, it should be noted that unlike most practices that directly stimulate business indicators through token incentives, Aaves token incentives do not directly target the core behavior of users deposits and borrowing, but rather incentivize the deposit guarantee fund. Therefore, Aaves deposit and borrowing business data is still generated based on organic demand.
However, in my opinion, the scale of Aaves incentives for the vault is still too high, and the current scale of incentives can be reduced by at least half. However, with the launch of a series of functions of Aaves new economic model, especially the new insurance module Umbrella, Aave will no longer be used for incentives.
For more information about Aave’s new economic model, you can read the article “Starting buybacks and dividends, upgrading security modules: an in-depth interpretation of Aave’s new economic model” published by Mint Ventures last year.
Competition
Judging from the loan scale (EVM chain), Aaves market share has been relatively stable, and it has always occupied the first place in the market since June 2021. In the second half of 2023, its market share once fell below 50%, but it began to rise again in 2024 and is currently basically stable at around 65%.
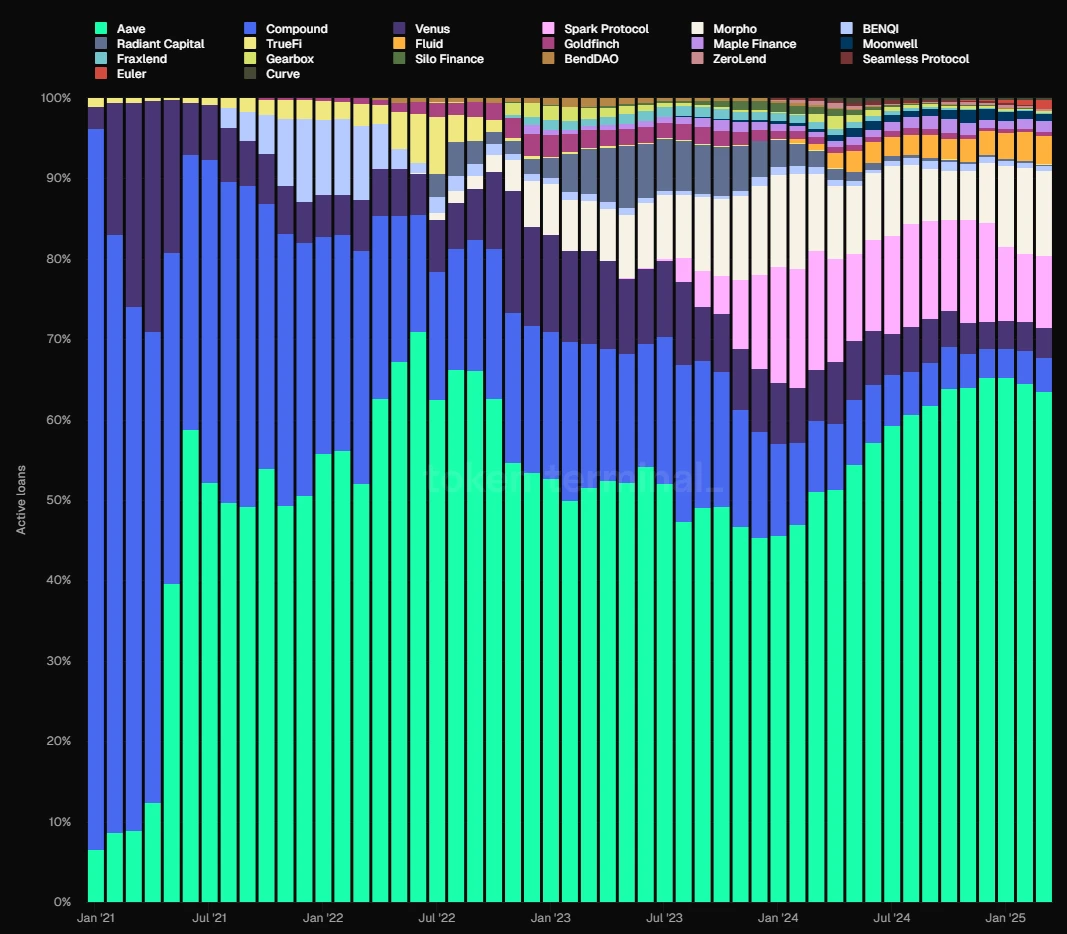
Data source: Tokenterminal
Aave’s Competitive Advantage
Since I started analyzing Aave in July last year, Aave’s core competitive advantages have not changed much, mainly from four aspects:
1. Continuous accumulation of security credit: Most new lending protocols will have security incidents within one year of going online. Aave has not had a single security incident at the smart contract level since its operation. The security credit accumulated by a platforms risk-free and stable operation is often the top priority for DeFi users when choosing a lending platform, especially for whale users with large capital volumes, such as Justin Sun, who is a long-term user of Aave.
2. Bilateral network effect: Like many Internet platforms, Defi lending is a typical bilateral market, where depositors and borrowers are both supply and demand. The unilateral growth of deposits and loans will stimulate the growth of business on the other side, making it more difficult for later competitors to catch up. In addition, the more abundant the overall liquidity of the platform, the smoother the liquidity in and out of both depositors and borrowers, and the more likely it is to be favored by large capital users, which in turn stimulates the growth of the platform business.
3. Excellent DAO management level: The Aave protocol has fully implemented DAO-based management. Compared with the team-centralized management model, DAO-based management has more complete information disclosure and more complete community discussions on important decisions. In addition, a number of professional institutions with high governance levels are active in the Aave DAO community, including top VCs, university blockchain clubs, market makers, risk management service providers, third-party development teams, financial consulting teams, etc. The sources are rich and diverse, and governance participation is relatively active. Judging from the projects operating results, Aave, as a latecomer in peer-to-pool lending services, has better balanced growth and security in product development and asset expansion, and has surpassed its big brother Compound. In this process, DAO governance played a key role.
4. Multi-chain ecological position: Aave is deployed on almost all EVM L1\L2, and TVL is basically at the top of each chain. In the V4 version that Aave is developing, multi-chain liquidity will be connected in series, and the advantages of cross-chain liquidity will be more obvious. Later, Aave will also expand to Aptos (the first non-EVM chain), Linea, and return to Sonic (formerly Fantom).
Main challenges and risks
Although Aaves market share has been steadily increasing over the past year, the development speed of its new competitor Morpho should not be underestimated.
Compared with Aaves collateral asset categories, various risk parameters, oracles, etc., which are centrally managed by Aave Dao, Morpho has taken a more open model: providing an open lending infrastructure protocol that allows the construction of independent lending markets without permission, and the freedom to choose collateral assets, risk parameters and oracles; in addition, it also introduces vaults (similar to wealth management funds) built by professional third-party institutions such as Gaunlet. Users deposit funds directly into the vault, and the management institution then weighs the risks and decides which lending markets to lend the funds to obtain returns.
This open combination approach is more conducive to the Morpho ecosystems rapid entry into newer or niche lending markets. For example, new stablecoin projects Usual and Resolv have built lending markets on Morpho, making it convenient for users to obtain project income or points through revolving loans.
I will provide more information about Morpho in the following article.
In addition to competition from the Ethereum ecosystem, Aaves development is also affected by competition from the Ethereum ecosystem and other high-performance L1s. If the ecosystem represented by Solana continues to erode Ethereums territory, Aave, which is heavily based on the Ethereum ecosystem, will undoubtedly have its business ceiling limited.
In addition, the high cyclicality of the crypto market will also directly affect Aaves user demand. When the market enters a bear market cycle, the speculation and arbitrage space in the market shrink rapidly, and Aaves lending scale and protocol revenue will also drop significantly. This is also a common feature of various lending protocols, and I will not go into details later.
Valuation reference
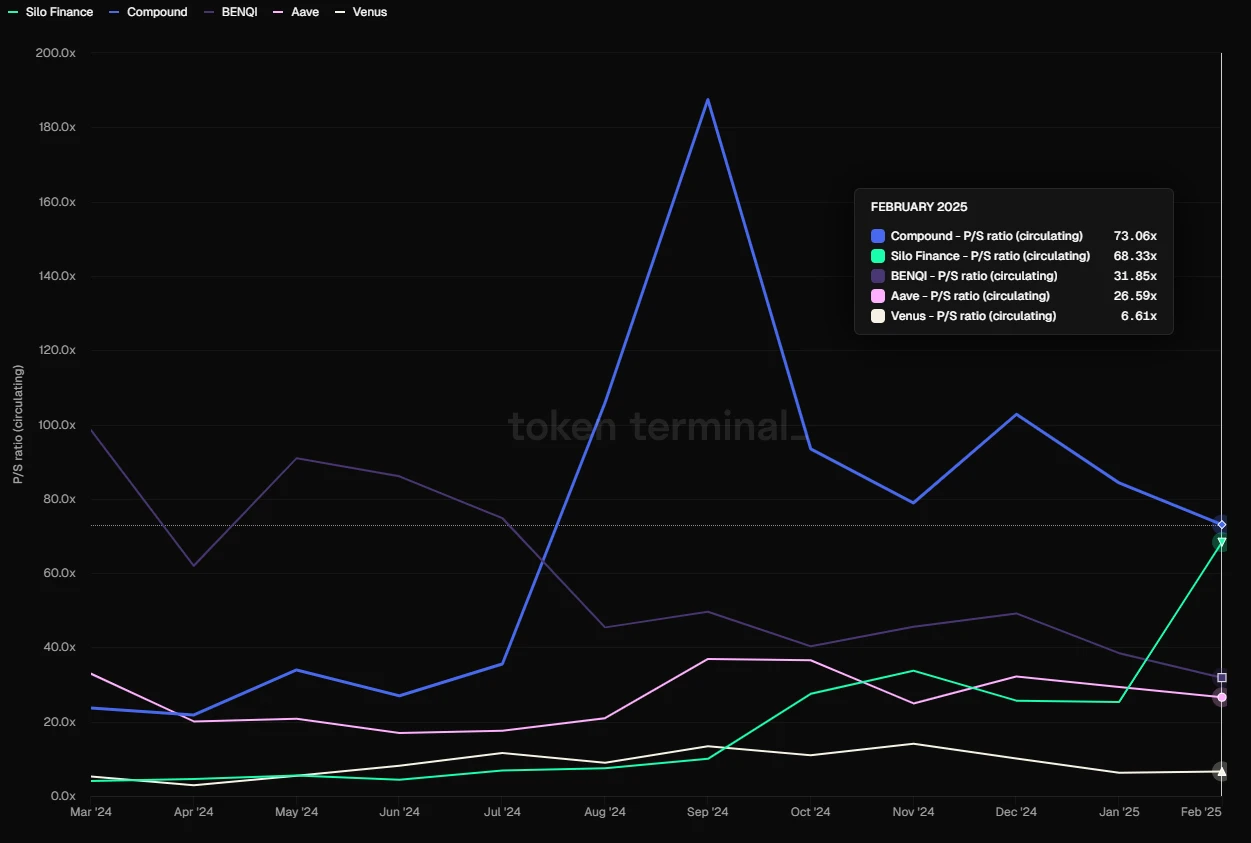
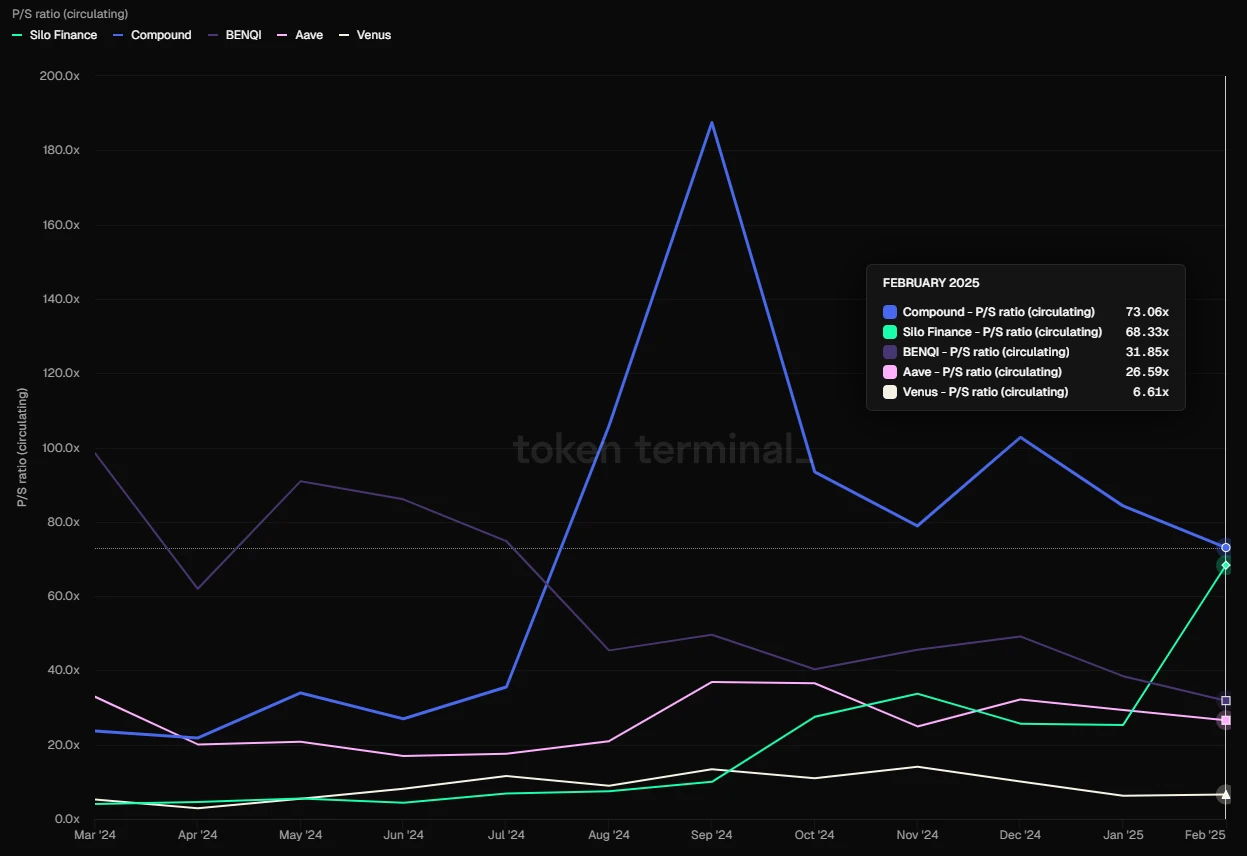
From the perspective of vertical valuation reference, Aaves current PS (the ratio of full market capitalization to protocol revenue) is 28.23, which is in the median range of the past year, and is still a long way from the PS value of over 100 during the peak period of 21-23.
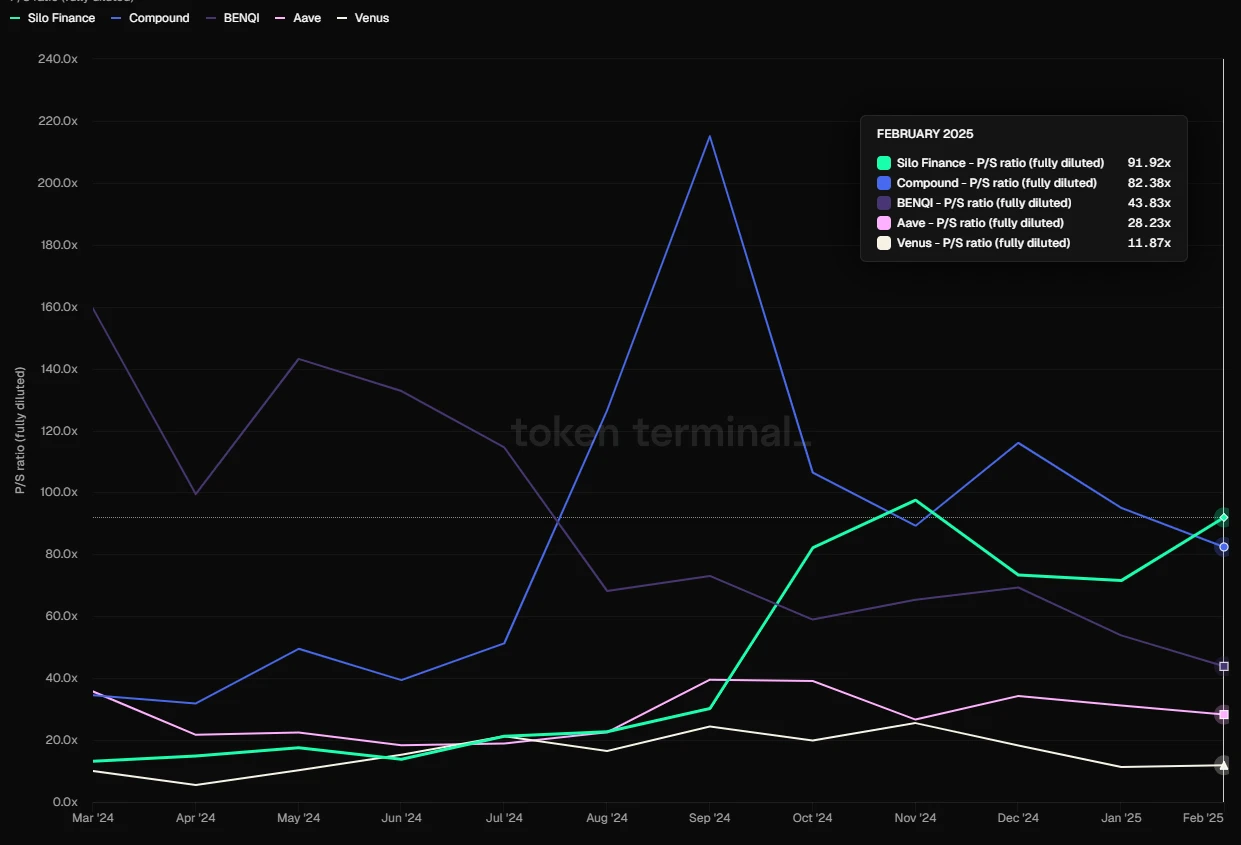
PS of mainstream lending protocols (based on FDV), data source: Tokenterminal
In a horizontal comparison, Aaves PS indicator is much lower than that of Compound, Silo, benqi and other protocols, but higher than Venus.
However, it is important to consider that Defi is similar to traditional financial companies in that its earnings multiples are highly cyclical, often showing a situation where PS drops rapidly in a bull market and rises in a bear market.
1.2 Morpho: A rising star
Morpho started out as a yield optimization protocol based on Compound and Aave. It was originally a project that was parasitic on the former two, but in 2024, it officially launched the permissionless lending infrastructure protocol Morpho Blue, becoming a direct competitor to leading lending projects such as Aave. Morpho Blues business grew rapidly after its launch and was favored by new projects and new assets. Morpho currently provides services on Ethereum and Base.
Business Status
Morpho has multiple products, including:
1.Morpho Optimizers
Morphos initial product aims to improve the capital efficiency of existing DeFi lending protocols such as Aave and Compound by depositing user funds on these platforms and earning basic returns while performing peer-to-peer matching of funds based on lending needs to optimize the efficiency of fund use.
As Morphos first product, Morpho Optimizers has accumulated a large number of users and funds, allowing it to avoid a cold start from scratch after the subsequent launch of Morpho Blue. However, although Morpho Optimizers still has a lot of funds, the interest rate optimization brought by its matching function is so low that it can be basically ignored. This product is no longer the development focus of Morpho, and it has been prohibited from depositing and lending funds since December last year.
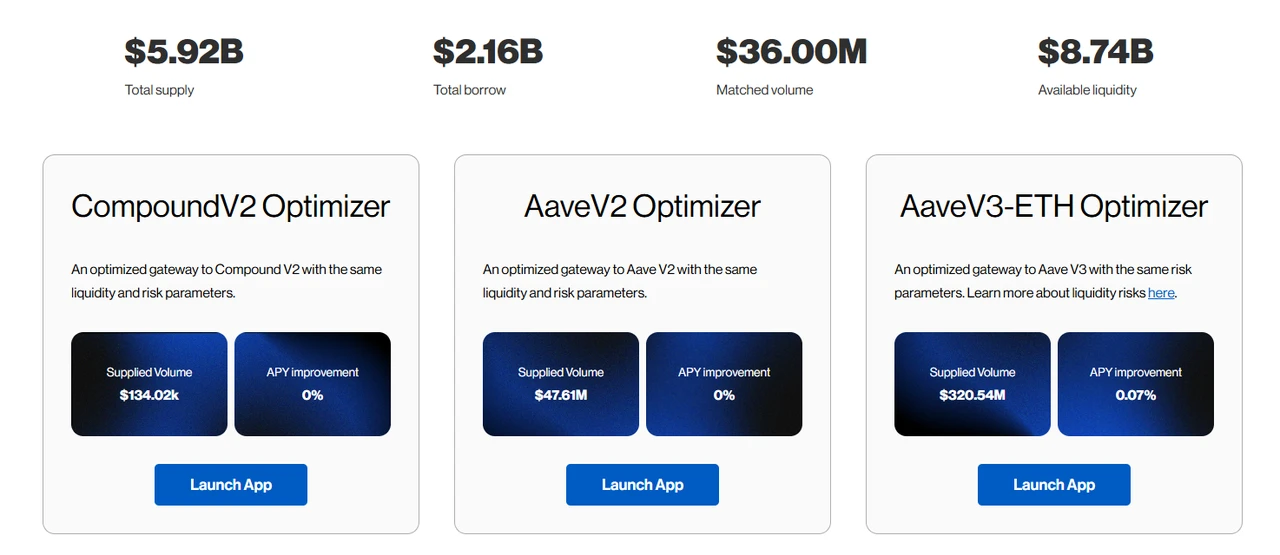
Due to the extremely low matching rate, the current optimization of interest rates by Optimizers is only 0.07%. Source: https://optimizers.morpho.org/
2. Morpho Blue (or simply Morpho)
Morpho Blue is a permissionless lending base layer that allows users to create customized lending markets. Users can freely choose parameters such as collateral assets, loan assets, liquidation ratio (LLTV), oracles, and interest rate models to create independent markets. The design of the protocol ensures that there is no need for external governance intervention, and market creators can manage risks and returns based on their own assessments to meet different market needs.
After the launch of Morpho Blue, its rapid business growth soon put pressure on Aave, the leading lending platform. Aave subsequently launched the Merit incentive plan for users. In addition to the rewards given to users who use Aave according to the incentive rules, addresses that also use Morpho will face incentive cuts.
Before the launch of Morpho Blue, most projects in the isolated lending market that focused on niche and new assets were not very successful, such as Euler, Silo, etc. Most funds still occurred on centralized management lending platforms such as Aave, Compound, and Spark that used mainstream blue-chip assets as collateral.
But Morpho Blue has basically taken this path now, and its success comes from many aspects:
Has a long-term and good security record. Before the launch of Morpho Blue, Morpho Optimizers also carried a large amount of funds for a long time without any problems, which made Defi users have good brand trust in Morpho.
We only provide the underlying protocol for the lending market, and open up the supported assets, the design of asset parameters, the selection of oracles, and the management rights of financial management funds. This brings the following benefits:
The market freedom of lending is further opened up, and the needs of the lending market can be responded to more quickly. New protocol asset issuers will take the initiative to build markets on Morpho and provide leverage services around their own assets, while professional risk service agencies such as Gaunlet can launch their own assessed and managed financial vaults (Vaults), and directly make profits through the performance fees of the vaults, breaking away from the previous single model of charging services for large lending protocols (Aave, Compound, Venus).
It makes it possible to further specialize in lending services. Participants in each link perform their duties and fully compete in the free market based on Morpho Blue, enriching the range of product options. More importantly, through the free outsourcing of each link, the costs brought by the teams self-operated related business are eliminated, such as frequent protocol upgrades and code audits, and the fees of specialized risk service providers.
3. MetaMorpho Vaults
MetaMorpho Vaults are asset management tools designed to simplify the lending process, providing liquidity and yield opportunities. Users can earn income by depositing their assets in vaults managed by a professional team, which are optimized based on unique risk profiles and strategies. Currently, the main destination of funds absorbed by various Vaults is the various lending markets built on Morpho Blue.
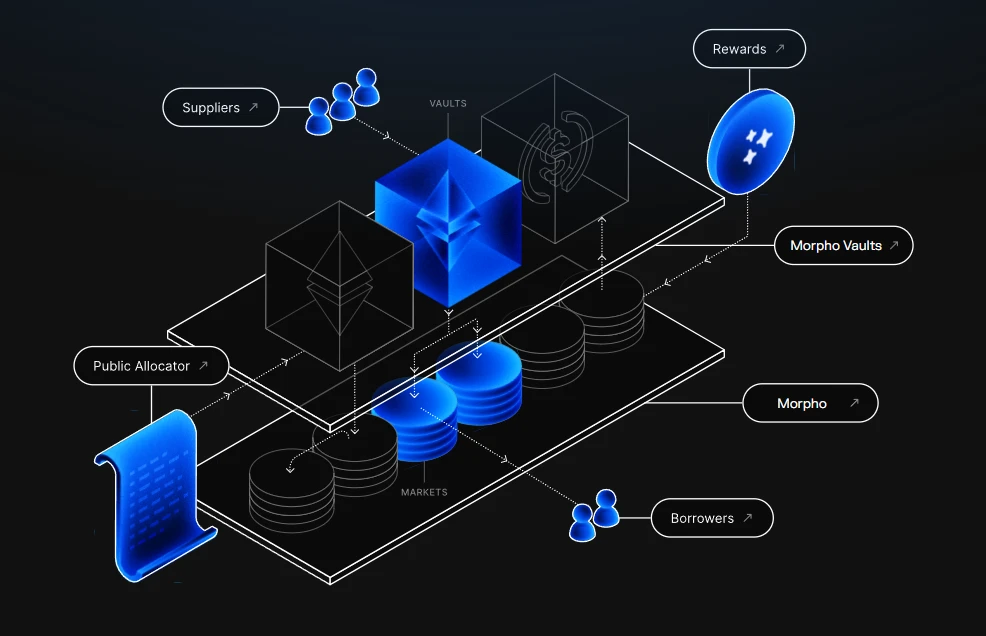
Morpho product structure diagram
After understanding Morphos products, lets take a look at Morphos main business data.
Active loans
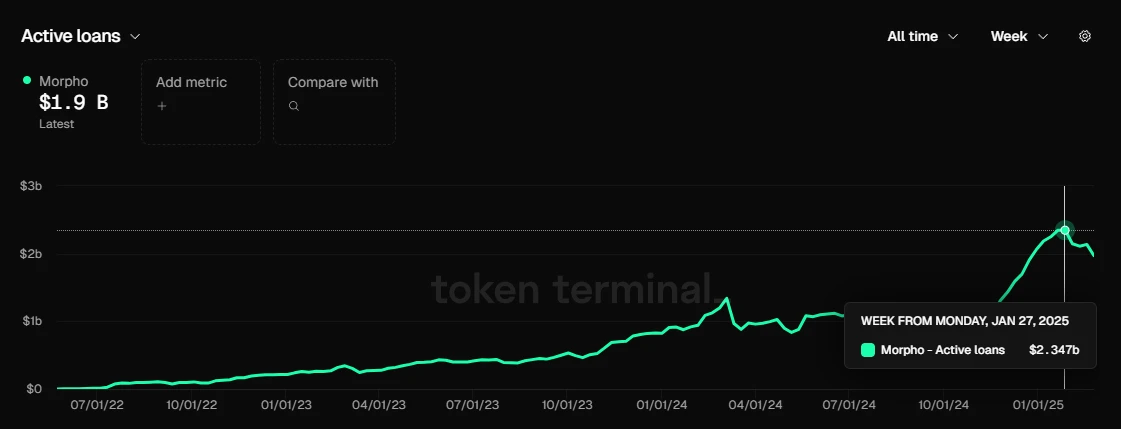
Morpho’s loan size, data source: Tokenterminal
Morphp’s peak total loan size is similar to Aave’s, reaching $2.35 billion at the end of January and currently stands at $1.9 billion.
Morpho has not yet officially started charging for the protocol, so it has not yet generated any protocol revenue. However, we can observe the amount of its Fee (the total income that depositors receive from the protocol) and use this to estimate the protocol revenue that Morpho can obtain if it turns on the protocol fee switch in the future.
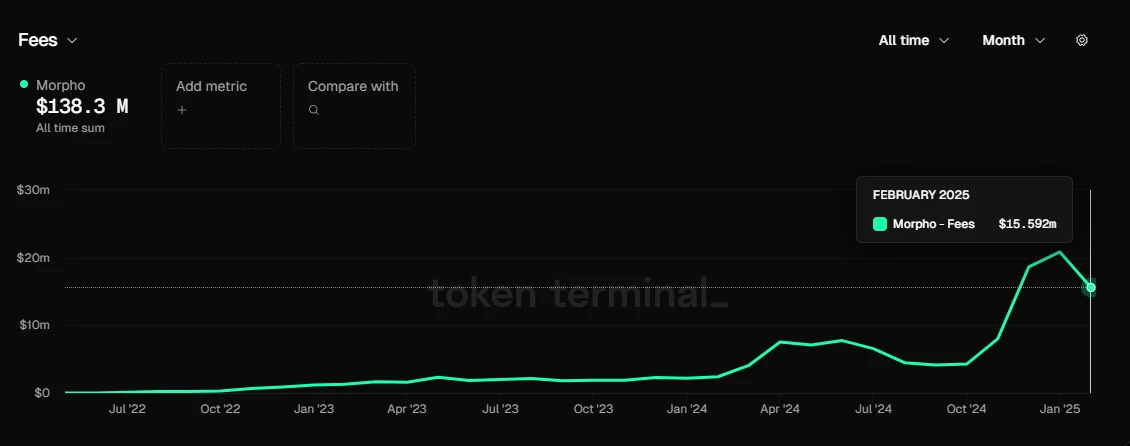
Comparison of Morpho and Aave Fees, data source: Tokenterminal
In February 25, Aave generated a total of 67.12 million US dollars in fees, while Morpho generated 15.59 million US dollars.
In the same period of February 25, Aave generated $8.57 million in protocol revenue from $67.12 million in fees, which means that its approximate fee retention rate is 857/6712 = 12.8% (just a rough calculation).
Considering that Aave is a lending protocol operated by Aave Dao itself, while it bears the various operating expenses of the protocol, all income from its lending market can go into the project treasury.
Morpho is a basic protocol serving the lending market, and there are many third-party participants on this basis, such as market creators, Vault operators, etc. Therefore, even if Morpho turns on the protocol fee switch in the future, the rate of protocol revenue it can extract from the generated Fees will definitely be significantly lower than Aave (because it needs to be shared with other service providers). I expect that the actual fee retention rate of Morpho should be 30%-50% off that of Aave, that is, 12.812.8* 0.3% * (30% ~ 50%) = 3.84% ~ 6.4%.
We multiply (3.84% ~ 6.4%) * 1559 and we can conclude that if Morpho starts charging for the protocol, the protocol revenue it can obtain from the total fees of 15.59 million US dollars in February will be roughly between 598,700 and 997,800 US dollars, which is 7% to 11.6% of Aaves protocol revenue.
Token Incentives
Morpho is also using its own token Morpho for incentives, but unlike Aave, Morpho directly incentivizes users’ deposit and borrowing behaviors, while Aave incentivizes deposit insurance. Therefore, Morpho’s core business data is not as organic as Aave’s.
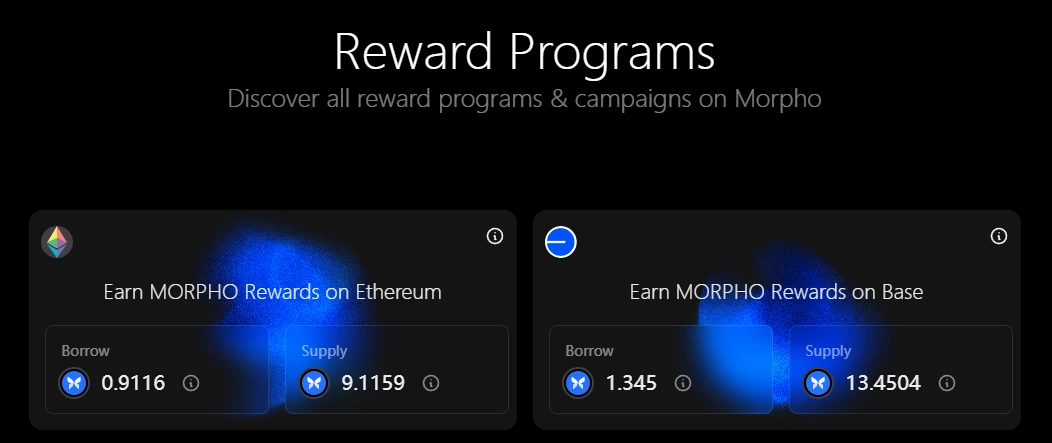
Morpho’s token incentive dashboard, source: https://rewards.morpho.org/
According to Morphos token incentive dashboard, in the Ethereum market, Morphos current comprehensive subsidy rate for borrowing is about 0.2%, and the comprehensive subsidy rate for deposits is about 2%; in the Base market, Morphos current comprehensive subsidy rate for borrowing is about 0.29%, and the comprehensive subsidy rate for deposits is about 3%.
However, in terms of token incentives, Morpho has been making fine-tuning adjustments at a relatively high frequency. Since December last year, the Morpho community has launched three proposals to continuously reduce the subsidies for Morpho tokens for user deposit and borrowing behaviors.
The most recent Morpho incentive adjustment took place on February 21, reducing the number of Morpho reward tokens on ETH and BASE by 25%. After the adjustment, Morphos annual incentive expenditure will become:
Ethereum: 11, 730, 934.98 MORPHO/year
Base: 3, 185, 016.06 MORPHO/year
Total: 14,915,951.04 MORPHO/year
Based on the current (March 3, 2024) market price of Morpho, the corresponding annual incentive budget is 31.92 million US dollars. Considering the current scale of Morphos agreement and the costs incurred, this incentive amount is quite large.
However, it is expected that Morpho will continue to reduce its incentive expenditures and eventually stop subsidies.
Competition
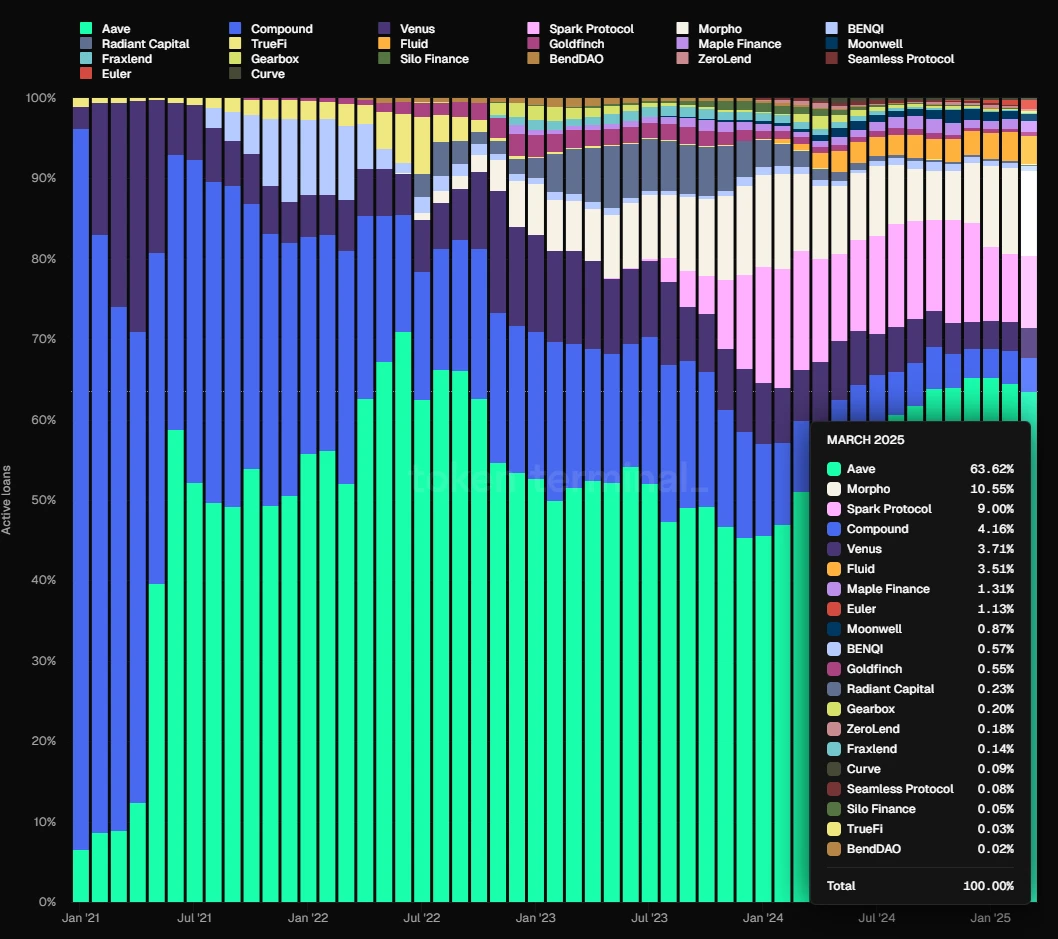
Data source: Tokenterminal
In terms of market share of total loan amount, Morpho accounts for 10.55%, slightly higher than Spark, but still far behind Aave. It is in the second tier of the lending market.
Morphos Competitive Advantage
Morphos moat mainly comes from the following two aspects:
1. Good security history. The Morpho protocol was born not too late. It has been in operation for nearly three years since the launch of its yield optimization product. So far, no major protocol security incidents have occurred, and it has accumulated a good security reputation. Its increasingly large data on capital absorption also indirectly confirms the trust of users in it.
2. Focus on the basic lending protocol. The benefits of this approach have been analyzed above. It is conducive to attracting more participants into the ecosystem to provide richer and faster lending market options, improve the specialization of the division of labor, and reduce the operating costs of the protocol.
Main challenges and risks
In addition to facing competition from other lending protocols and the ecological impact of L1 competition such as Ethereum and Solana, Morphos main challenge is that its token will face relatively large unlocking pressure in the next year.
According to tokenomist data, the amount of new tokens unlocked by Morpho in the next year is equivalent to 98.43% of the total number of tokens currently in circulation, which means that the token inflation rate in the next year is close to 100%, and most of the tokens belong to early strategic investors, early contributors and Morpho Dao. This huge amount of token cashing out may put great pressure on the token price.
Valuation reference
Although Morpho has not yet turned on the protocol fee switch, we have estimated its revenue after the fee is turned on based on the protocol fees it has generated. Based on its February protocol fee, it is estimated that the protocol revenue may be between 598,700 and 997,800 US dollars.
According to its today’s (3.3) FDV of 2,138,047,873 USD (Coingecko data) combined with the above revenue data, its PS is: 178 ~ 297. Compared with other mainstream lending protocols, its valuation level is obviously higher.
PS of mainstream lending protocols (based on FDV), data source: Tokenterminal
However, if calculated by market capitalization, Morphos market capitalization today (3.3) is 481,361,461 USD (Coingecko data), and its PS is: 40.2 ~ 67, which is not too expensive compared to the indicators of other lending protocols.
PS of mainstream lending protocols (based on MC), data source: Tokenterminal
Of course, using FDV as a reference for market value is a more conservative way of valuation comparison.
1.3 Kamino: Solana’s top player
Kamino Finance is a comprehensive DeFi protocol based on Solana. It was founded in 2022. The first product launched was an automated management tool for centralized liquidity. It currently integrates lending, liquidity, leverage, and trading functions. However, lending is its core business, and most of the protocols revenue is also contributed by the lending business. Kamino charges a variety of fees. The fees for the lending business include: a commission on interest income, a one-time initial fee charged when borrowing, and liquidation fees. The fees for the liquidity management business include: deposit fees, withdrawal fees, and performance fees.
Business Status
Active loans
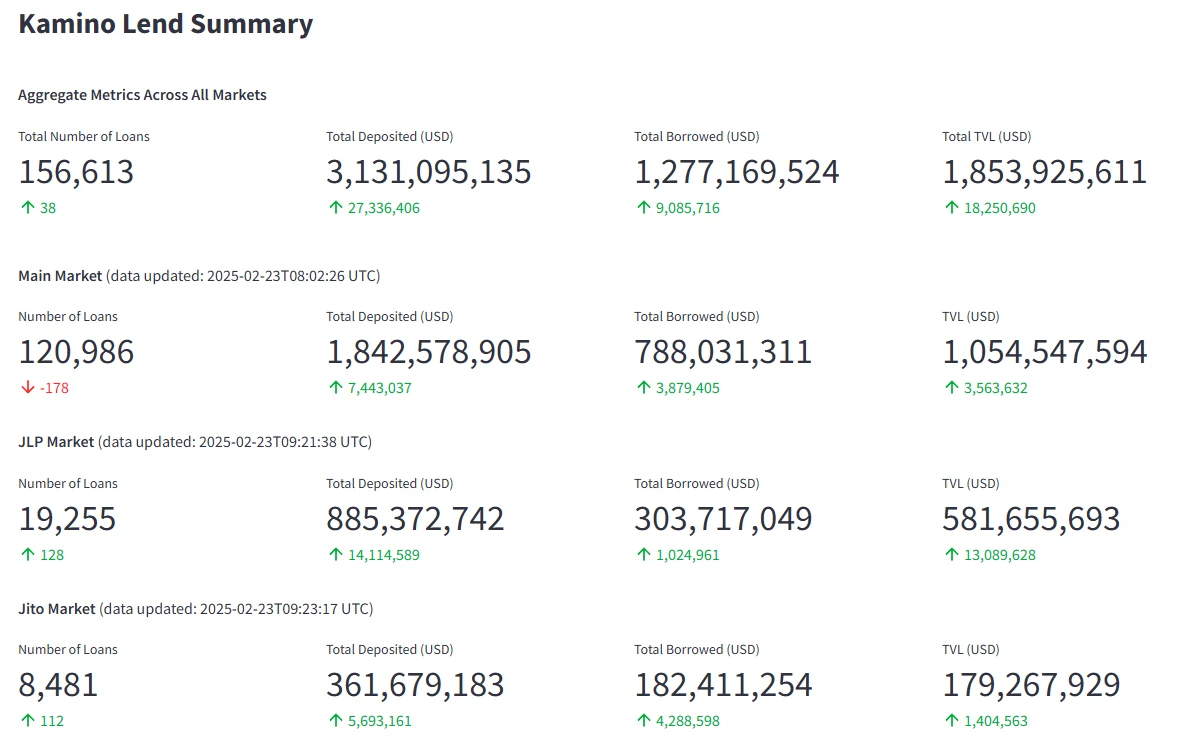
Kaminos main data indicators, data source: https://risk.kamino.finance/
Kamino’s current loan size is US$1.27 billion, and its peak loan size reached US$1.538 billion, which also occurred in late January this year.
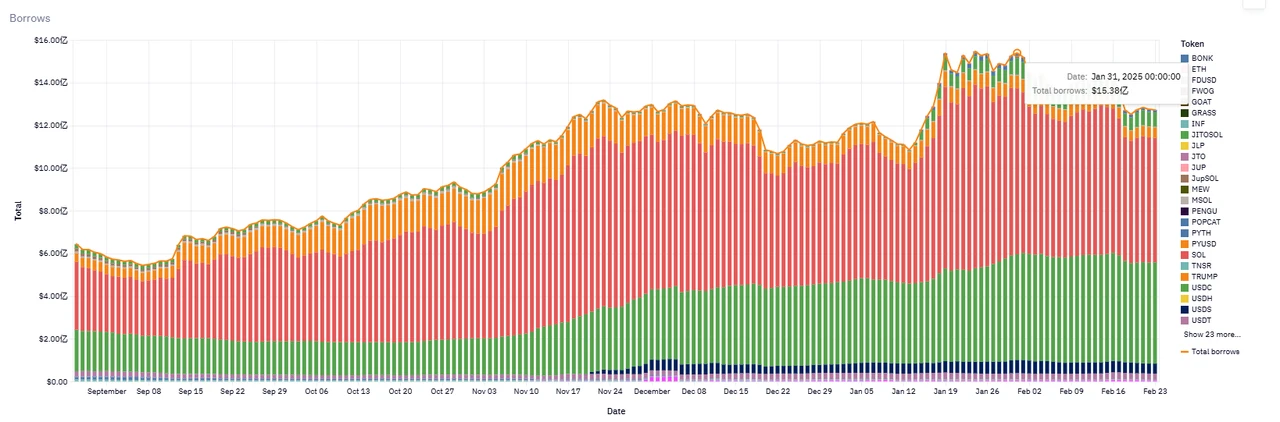
Kamino’s borrowing scale trend, data source: https://allez.xyz/kamino
Revenue
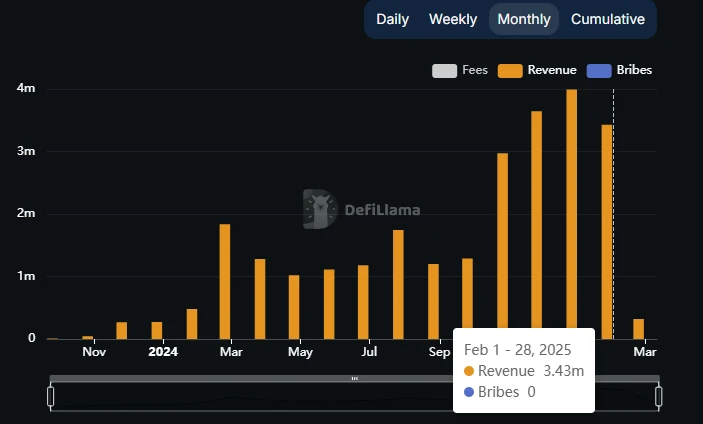
Kamino protocol total revenue, source: DefiLlama
January was the highest month for Kamino Protocol, with revenue of $3.99 million. However, February was also good, with revenue of $3.43 million.
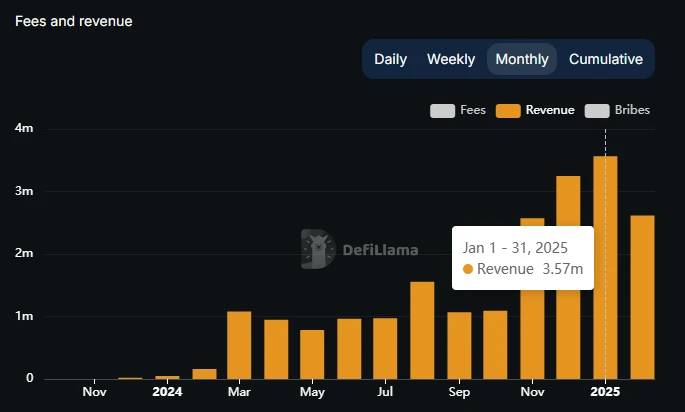
Kamino Protocol income from lending, source: DefiLlama
The lending portion accounts for most of Kaminos protocol revenue. Taking January as an example, the protocol revenue from lending accounted for 89.5%.
Token Incentives
Unlike other lending protocols that directly incentivize users with tokens, Kamino adopts a new incentive method that emerged in this cycle, namely the season points system. Users obtain project points by completing officially designated incentive behaviors. At the end of the season, the total amount of tokens rewarded in each season is distributed according to the proportion of personal points.
Kaminos first season points season event lasted for three months, giving away 7.5% of the total tokens as Genesis airdrops. The second season points season event also lasted for three months, giving away 3.5% of the total tokens.
According to the current token price, 11% of the total KMNO tokens given away in the above two seasons are worth 105 million US dollars. The high token rewards are also the main driving force behind the rapid growth of Kaminos business data in the past year.
Currently, Kaminos third points season is still in progress. Unlike the previous two points seasons, the third season started on August 1 last year and has lasted for more than 6 months and has not yet ended, but this has not slowed down Kaminos protocol growth. If the third season airdrop maintains a similar scale to the second season, the airdrop incentive value is expected to be between 30 and 40 million US dollars.
It is worth noting that one of the main functions of Kamino’s token KMNO is to accelerate users’ points acquisition during the season through staking. This model increases users’ stickiness in product and token holdings.
Competition
On the Solana chain, the main lending protocols include Kamino, Solend, MarginFi, etc.
Kamino: Currently it occupies 70%~75% of the market share (by loan size). Its market share in Solana is even stronger than Aaves position in Ethereum.
Solend: It was in the lead in 2022-2023, but its growth slowed down in 2024 and its market share dropped to less than 20%.
MarginFi: After a management crisis in April 2024, a large amount of user assets were withdrawn and the projects share fell to single digits.
Kaminos total locked-in volume has firmly ranked in the top two of Solana, second only to Jito, which focuses on staking. Its lending TVL has also significantly surpassed former rivals such as Solend and MarginFi.
Kamino’s Competitive Advantage
1. Fast product iteration and good delivery capabilities: Kamino was founded by Hubble team members in 2022 and was initially positioned as the first centralized liquidity market-making optimizer on the Solana chain. This first-mover product enables Kamino to meet the needs of users in centralized liquidity market-making and provide an automated, yield-optimized liquidity vault solution. On this basis, Kamino further expanded product modules such as lending, leverage, and trading to form a full-stack DeFi product matrix. This kind of integrated DeFi project across multiple scenarios is rare, and to date, the Kamino team is still constantly trying new businesses.
2. Active ecological integration capabilities: Kamino has been actively building a cooperative network inside and outside the Solana ecosystem. A notable example is the integration with PayPal stablecoins-Kamino is the first Solana protocol to go online and support PYUSD lending, and has occupied a major position in the expansion of this asset. For example, in cooperation with the Solana staking project Jito, the launch of JitoSOL-related leveraged products has attracted a large number of SOL staking users to enter the Kamino ecosystem. When Kamino Lend announced the subsequent upgrade to V2 in 2024, it also planned to introduce new features such as order book lending and support for real-world assets (RWA), and open modular interfaces for other protocols to access. These initiatives will further embed Kamino into the underlying financial infrastructure of the Solana ecosystem. The more other projects are built on Kamino, the more new capital prefers to flow into Kamino, and it will be more difficult for competitors to shake its position.
3. Scale effect and network effect: There is an obvious stronger gets stronger effect in the DeFi lending field, and Kaminos rapid expansion in 2024 reflects this network effect. Higher TVL and liquidity mean that users can borrow and lend on the platform more safely and with lower slippage, which also increases the confidence of large investors to enter the market. A higher fund scale is itself a competitive barrier: funds tend to flow to platforms with the most liquidity, which in turn further increases the scale of the platform. Kamino enjoys the positive feedback brought by this network effect through the liquidity and users accumulated by the first mover.
4. Good record in risk management. So far, Kamino has not had any major security incidents or large-scale liquidation of bad debts. In contrast, the turmoil that competitors such as MarginFi have experienced has pushed ecosystem users to Kamino.
Main challenges and risks
In addition to the common risks faced by newer lending protocols such as contract security and asset parameter design, potential problems with Kamino include:
Token economics, inflationary pressure, and profit distribution
The points season model adopted by Kamino is slightly Ponzi-like, similar to Ethena. If the value of the subsequent airdropped tokens is not as expected, it may cause some users to lose (of course, at the current scale, the purpose of the project has been achieved). In addition, according to tokenomist data, the unlocking volume of KMNO in the next year is also quite large, with an inflation rate of up to 170% based on the current circulating tokens. Finally, all of Kamino’s protocol revenue currently seems to have gone into the team’s pocket, not only has it not been distributed to token holders, but it has not even entered the treasury. There is no sign of the decentralized governance of the project starting in the short term. This is normal in the early stages of the project, but if the protocol revenue is not included in the treasury controlled by the project DAO, and there is no transparent governance and financial planning, all of which are monopolized by the core team, then the expected value of the protocol token may fall further.
Solana’s Ecosystem Development
Although the development of Solana ecosystem in this cycle is obviously better than that of Ethereum, Solana currently has no track type with obvious PMF except Meme, and Defi is still the strong point of Ethereum series. Whether Solana can continue to expand asset categories and capacity and introduce more funds in the future is very important for Kaminos ceiling.
Valuation reference
Kamino 30-day agreement revenue, data source: https://allez.xyz/kamino/revenue
We use Kamino’s recent 30-day protocol revenue and its FDV as a benchmark, and perform a PS calculation on its FDV and MC market value (based on Coingeko market value data), and we get:
FDV PS= 34, MC PS= 4.7. This profit multiple is not high compared with other mainstream lending protocols.
1.4.MakerDAO: New flowers on an old tree?
MakerDAO is the earliest DeFi protocol on the Ethereum chain. It was founded in 2015, ten years ago. With its first-mover advantage, its stablecoin DAI (including the upgraded USDS) has long been the largest decentralized stablecoin in the market.
In terms of business model, MakerDAOs main income comes from the difference between the stability fee paid for generating DAI and DAI. This model is very similar to the interest rate spread of the lending agreement: you need to pay a fee to borrow DAI from the agreement; providing excess liquidity (sUSDS sDAI) to the agreement can earn interest.
Moreover, from the perspective of business processes, the process of depositing ETH to obtain DAI for CDP ( Colllateralized Debt Position ) type stablecoins such as DAI is not much different from depositing ETH into AAVE to borrow USDC, so in early DeFi analysis, many people also regarded CDP protocols such as MakerDAO as a type of lending protocol. And after the brand upgrade to Sky, MakerDAO also independently launched a separate lending protocol Spark, so we also regard MakerDAO as a lending protocol and analyze it in this section.
Business Status
Active loans
For a stablecoin protocol, the most important metric is its stablecoin size, which also corresponds to the loan size of a lending protocol.
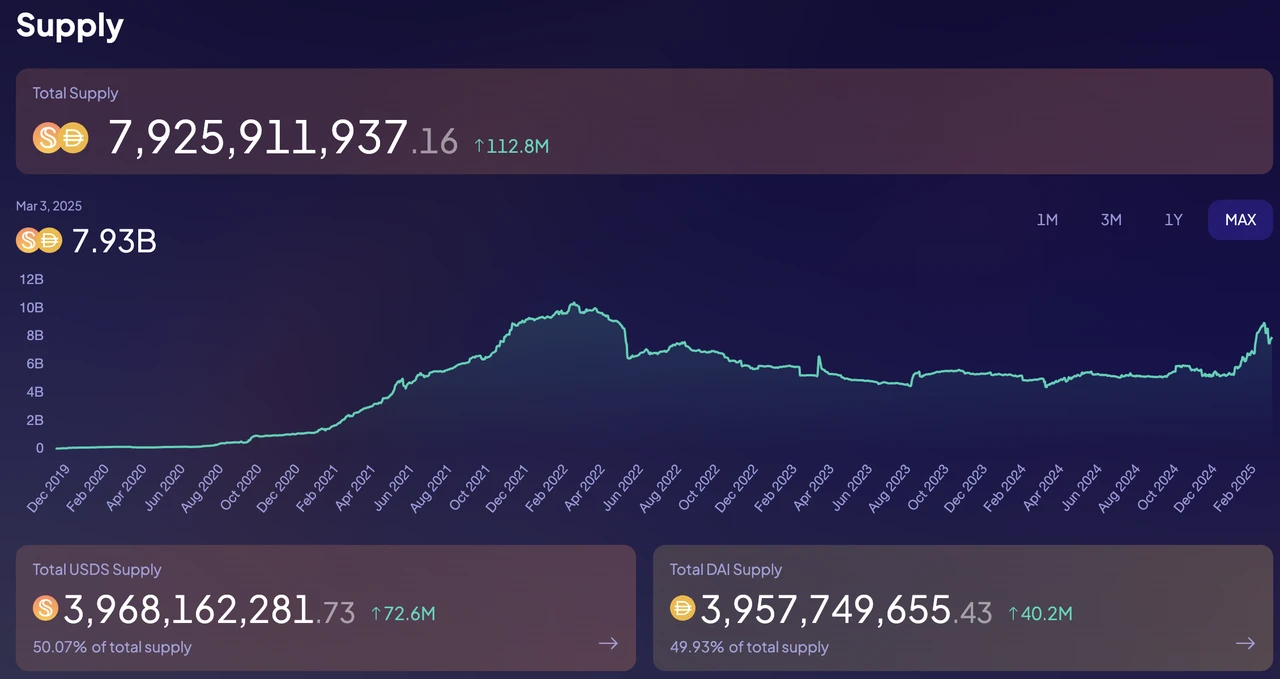
Source: Sky official website
MakerDAOs lending scale is currently close to US$8 billion, which is still far from the peak of US$10.3 billion in the previous cycle.
Sparks loan size is about 1.6 billion US dollars, which is higher than the old lending agreement Compound and slightly lower than Mophro mentioned above.
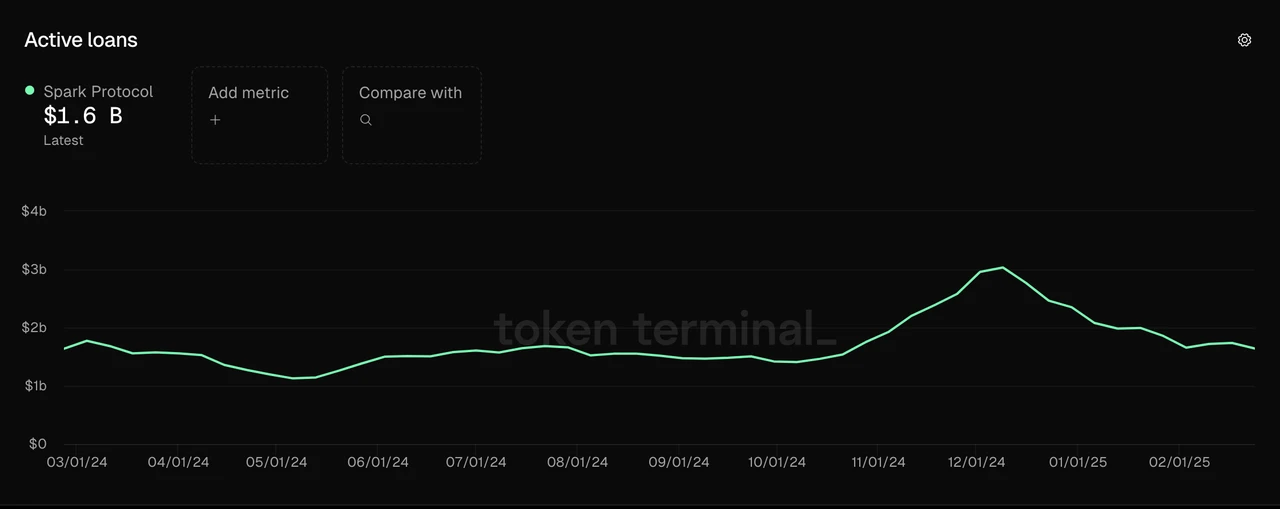
Data source: Tokenterminal
Revenue
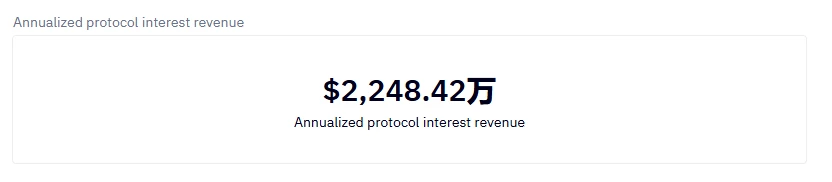
The concept of MakerDAOs protocol revenue corresponding to the lending protocol should be the sum of the protocols various revenues, minus the interest costs paid to sDAI and sUSDS. From the figure below, we can see that among MakerDAOs current protocol revenues, the stability fee revenue is $421 million, accounting for the vast majority of its revenue, while other revenues such as liquidation fees and price stabilization module fees contribute very little to the revenue.
MakerDAOs historical revenue Source: Sky official website
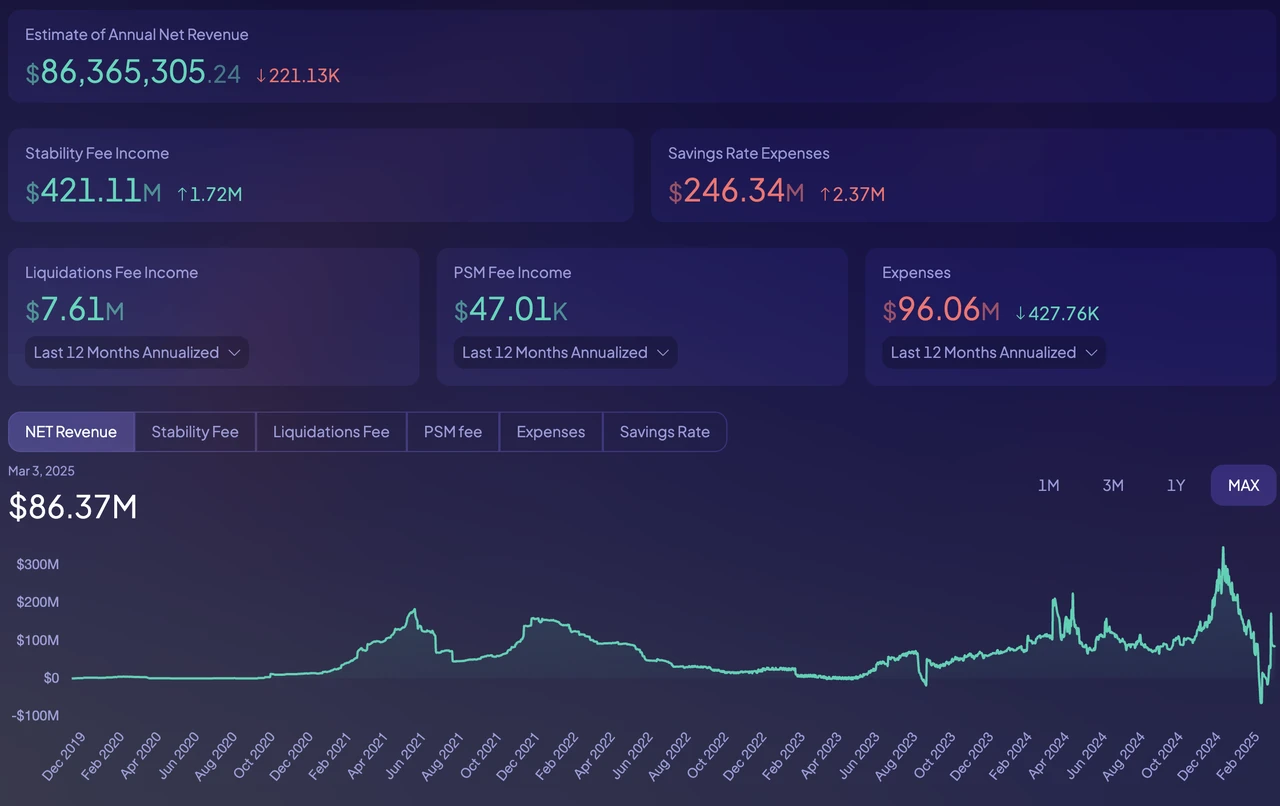
In the stability fee, the DAI released by the protocol through Spark is expected to generate an annualized stability fee of US$140 million, and the DAI directly generated by USDC can also obtain a stability fee of US$125 million. These two parts account for 2/3 of the stability fee. The remaining stability fee comes from the DAI generated by RWA (US$71.83 million) and the DAI generated by crypto asset collateral (US$78.61 million).
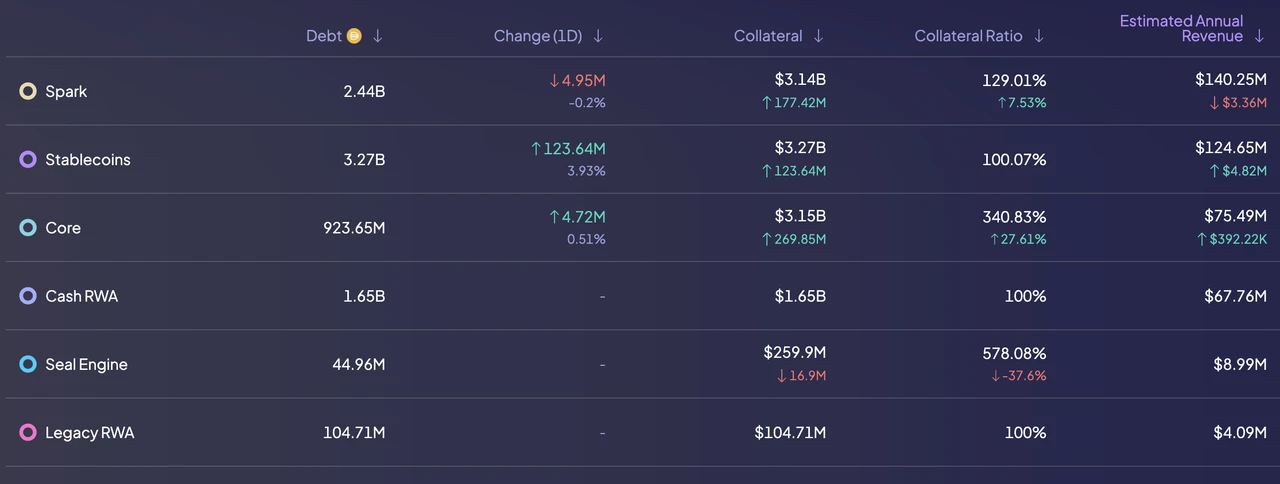
MakerDAOs debt structure and annual income sources: sky official website
In order to motivate the generation of stability fees of this scale, MakerDAO expects to pay $246 million in deposit costs (Saving Expense) per year. Subtracting the two, MakerDAOs annual protocol revenue is approximately $175 million, with an average of $3.36 million in protocol revenue per week.
Of course, MakerDAO also announced their protocol operating expenses, which amounted to $96.6 million a year. After deducting operating expenses from protocol revenue, a net profit of about $78.4 million can be obtained, which is also the main source of funds for MKR and SKY repurchases.
Token Incentives
One of the reasons why MakerDAO upgraded its brand was that it no longer had extra MKR reserves to incentivize the addition of its business. Currently, MakerDAOs token incentives are mainly used to incentivize USDS deposits. From the launch of the incentive plan at the end of September 2024 to the present, a total of 274 million SKY incentives have been released in the five months since then, equivalent to approximately US$17.4 million, with an annualized incentive amount of approximately US$42 million.
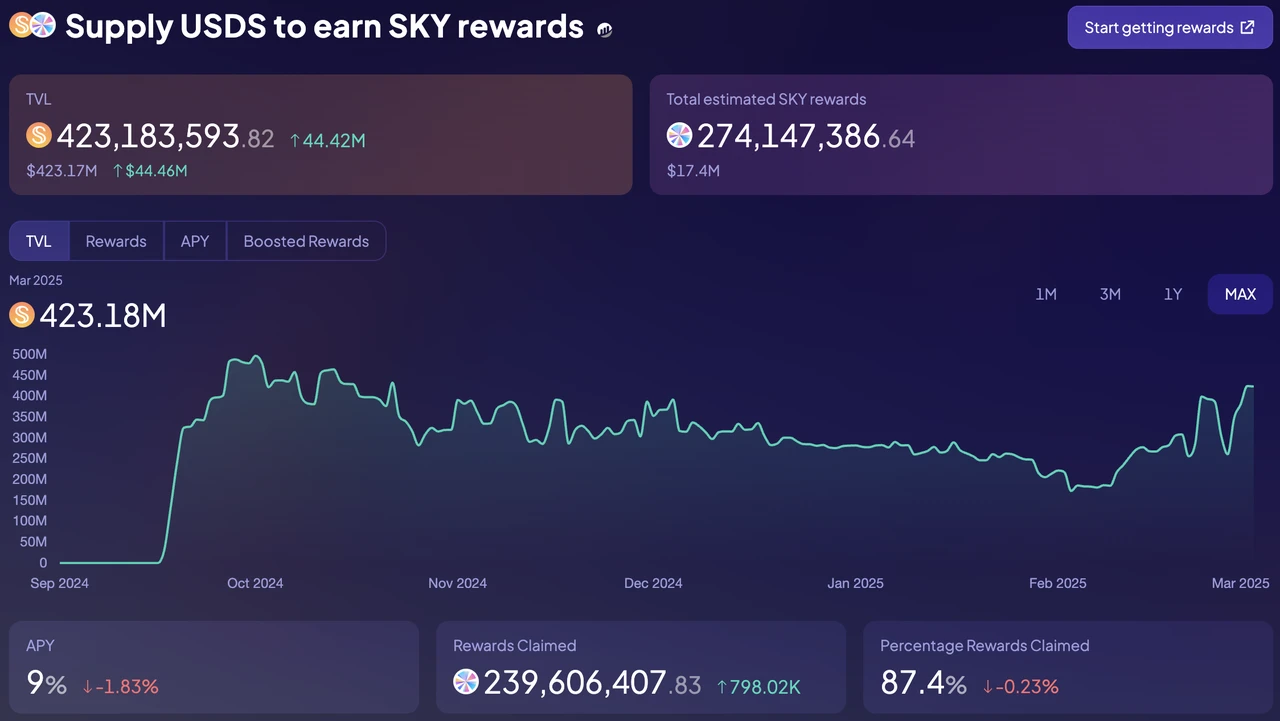
Source: Sky official website
Competition
Currently, MakerDAO’s stablecoin market share is 4.57%. Stablecoins are one of the most obvious tracks for cryptocurrency demand. As an old stablecoin, MakerDAO has formed a certain moat, including brand effect and first-mover advantage, which was very obvious in the last round of Curve liquidity battle. As one of the three CRVs, DAI can obtain a lot of incentives released by other stablecoin projects to establish popularity without any operation.
However, in the competition of stablecoins, the situation of MakerDAO is not optimistic. From the market share in the figure below, we can also see that MakerDAOs market share (pink block) has decreased instead of increased during this period.
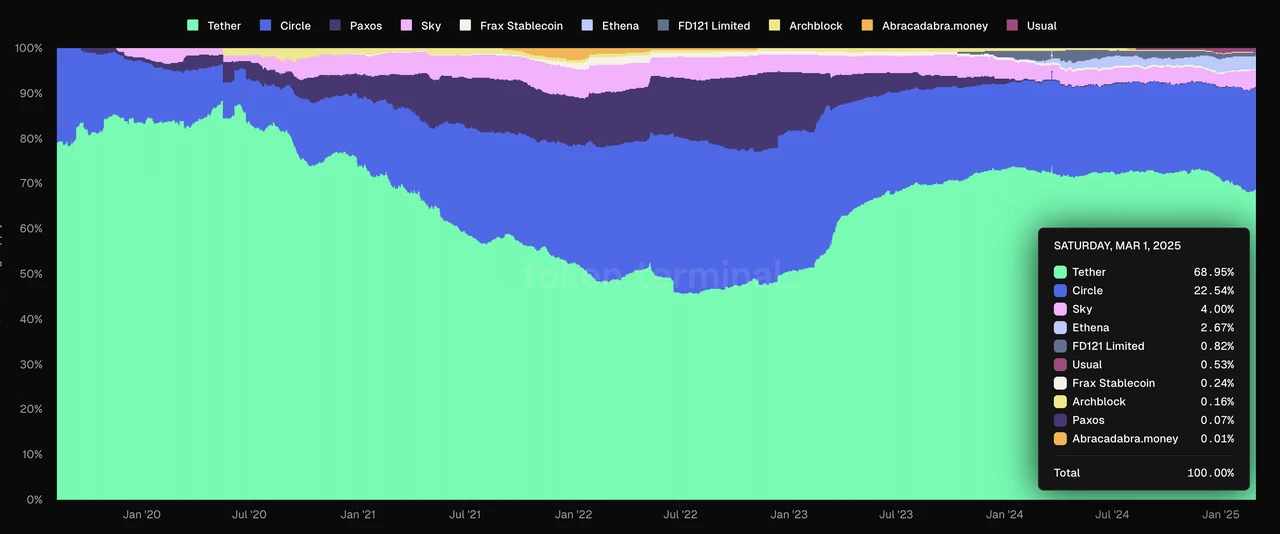
Market share of the top ten stablecoins Source: Tokenterminal
The author believes that the core factor causing this phenomenon is that DAI, the third largest stablecoin, has lost (or never really had) the function of a settlement tool. At present, users hold USDT and DAI for completely different purposes: USDT is mainly used as a settlement tool, while the purpose of holding DAI is to increase leverage and obtain returns. From this perspective, except that both are anchored to the US dollar, there does not seem to be much in common.
Stablecoins with settlement functions have good network effects. Unfortunately, DAI basically no longer has the settlement function, making it difficult to form a network effect.
This is reflected in the scale of issuance, that is, DAIs market share has gradually declined, and DAI has not yet returned to its highest issuance scale in 2021, while the issuance scale of USDT has continued to rise, and has now doubled compared to the end of 21.
Stablecoins that are merely used as revenue tools have a limited ceiling. Their scale growth depends on the continuous stimulation of revenue and many external conditions (such as relatively high U.S. Treasury bond interest rates). How to achieve long-term organic growth is the key to whether MakerDAO can make new achievements in the stablecoin market.
Main challenges and risks
In addition to the challenges we analyzed above, MakerDAO also faces competition from newcomers.
Ethena, a new stablecoin player, has developed rapidly. It has been launched for less than a year, and its current market size has reached 60% of MakerDAO. Ethena, whose core product is also a yield-based stablecoin, has a major advantage over MakerDAO, that is, its income basis - cryptocurrency perpetual contract arbitrage income is much higher than MakerDAOs Treasury bond RWA income. In the medium and long term, if the Treasury bond interest rate continues to decline, USDE will show a greater competitive advantage over DAI.
In addition, the governance capabilities of MakerDAO are also worrying. The MakerDAO team, which spends $97 million every year, has very inefficient and opaque governance results. The most typical example is that after upgrading the MakerDAO brand to SKY, they are discussing changing the brand back to Maker again. The whole process seems like a childs play.
Valuation reference
Based on $175 million in protocol revenue, MKR’s current PS is about 7.54, which is still relatively cheap compared to its main competitor Ethena (22). Historically, MKR’s PS has also been lower.
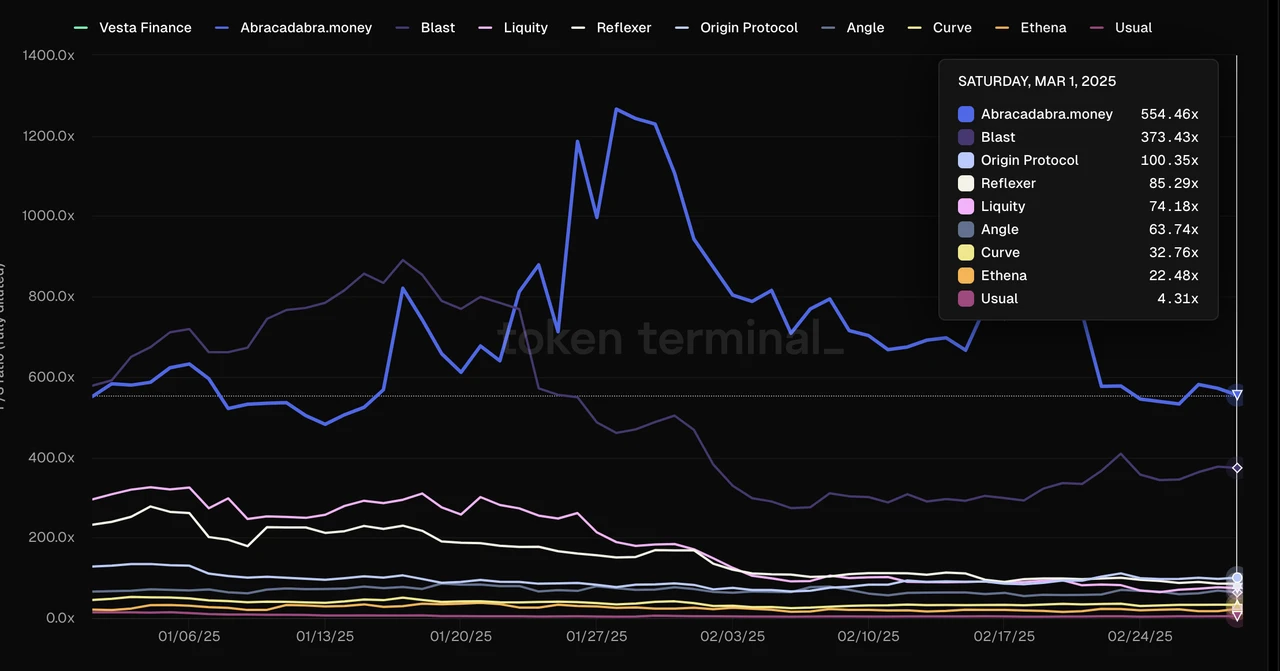
PS of stablecoin projects other than MakerDAO Source: Tokenterminal
2. Liquidity Staking Track: Lido and Jito
Liquidity staking is one of the tracks of crypto-native. Compared with native staking, liquidity staking provides better liquidity and composability, so it has a solid demand and plays a pivotal role in the ecology of PoS chains. Currently, the two most important PoS chains, Ethereum and Solana, have the largest TVL protocols, both of which are liquidity staking protocols. These two protocols are also what we will introduce next - Lido and Jito.
For liquidity staking projects, the most critical indicator for evaluation is the size of the assets staked (for liquidity staking projects, its value is consistent with TVL). Since there are third parties other than users in its operating model - node operators, the protocol revenue they collect needs to be distributed to the node operators, so compared with protocol revenue, gross profit may be more suitable for evaluating liquidity staking protocols. In addition, the protocols expenditure indicator - token incentives - also needs to be evaluated.
2.1 Lido: Be careful on Ethereum
Business Status
Lidos business was launched at the end of 2020 with the opening of ETH staking. It took Lido half a year to occupy the leading position in liquidity staking on the Ethereum network. Lido was previously the largest liquidity staking service provider on the Luna network and the second largest on the Solana network. Its business has expanded to almost all mainstream PoS networks. However, starting in 2023, Lido began to shrink its strategy. Currently, ETH liquidity staking is Lidos only business. Its business model is relatively simple. Lido invests the ETH staked by users into Ethereum staking through different node operators and collects 10% of the staking income as protocol income.
Assets staked
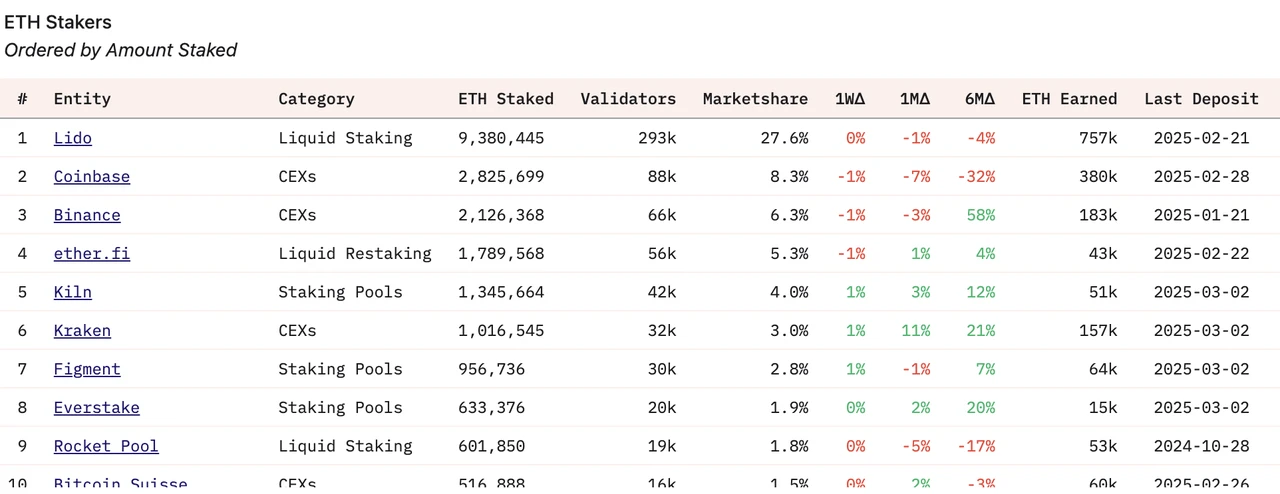
Currently, more than 9.4 million ETH are deposited in Lido, accounting for about 8% of the circulating ETH, which also makes Lido have a pledged asset scale (TVL) of more than 20 billion US dollars, becoming the largest TVL among all current protocols. At its peak, Lidos TVL was close to 40 billion US dollars.
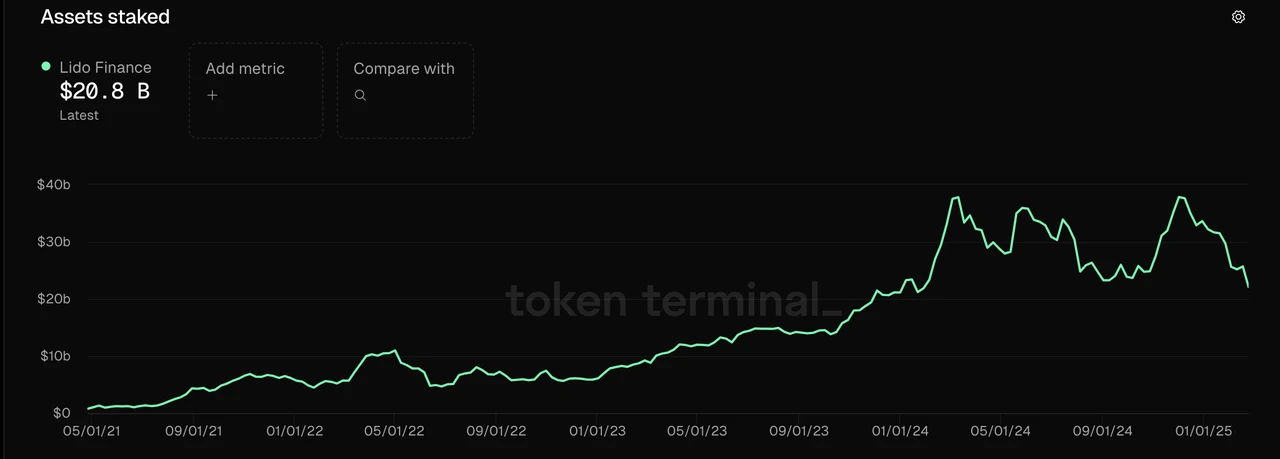
Data source: Tokenterminal
The fluctuation of the scale of pledged assets calculated in ETH is much smaller. Since 2024, the overall scale of ETH pledged by Lido has not changed much. The fluctuation of the scale of Lidos pledged assets is more due to the fluctuation of ETH prices.
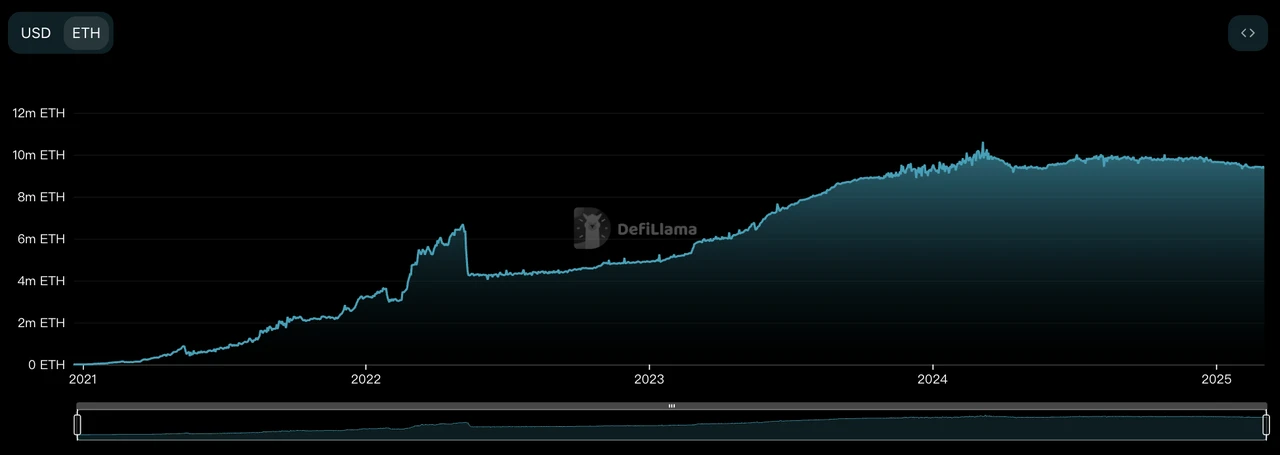
Lido staked assets in ETH Source: DeFillama
The scale of Lidos pledged assets continues to grow, mainly due to the gradual increase in the Ethereum networks pledge rate (from 0 to 27%). As a leading provider of liquidity pledge services, Lido has benefited from the growth of the overall market size.
Gross Profit
Lido extracts 10% of the staking income as protocol revenue. Currently, 50% of the protocol revenue is allocated to node operators and 50% belongs to the DAO, which means 5% is gross profit. As can be seen from the figure below, the gross profit of the Lido protocol has been rising steadily overall. In the past year or so, the weekly gross profit of the Lido protocol has fluctuated between US$750,000 and US$1.5 million.
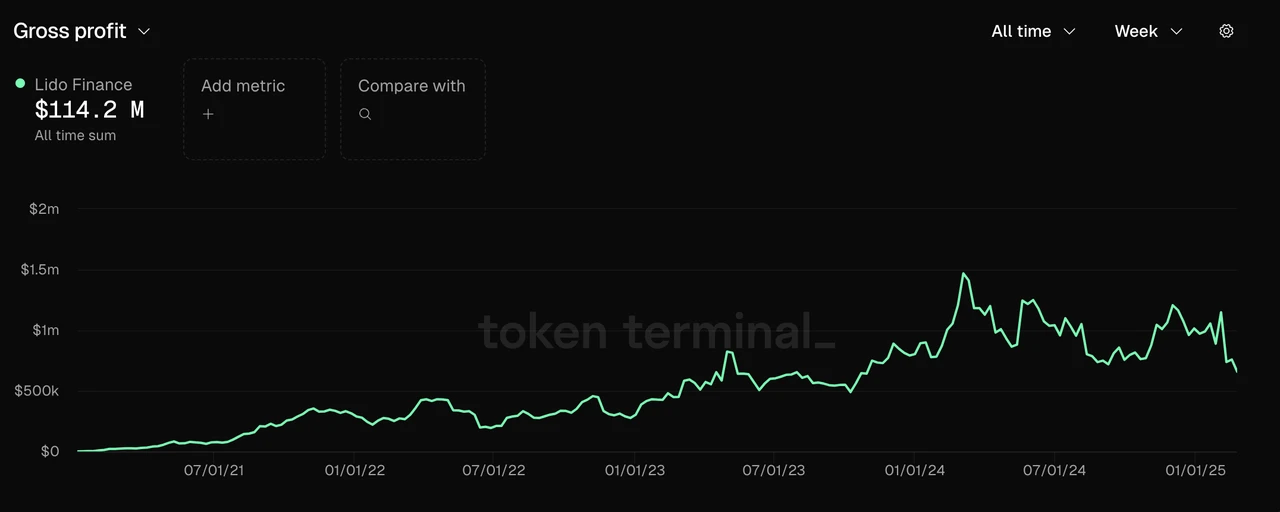
Data source: Tokenterminal
It can be seen that Lidos protocol revenue is strongly related to the size of the staked assets, which is determined by their fee structure. The change in Lidos weekly protocol revenue is also mainly due to the fluctuation of ETH prices.
Token Incentives
In the first two years after the launch of the protocol (2021-2022), Lido spent a huge amount of LDO token incentives to incentivize the liquidity of its stETH and ETH, and spent a total of more than US$200 million in token incentives in two years. This also enabled Lido to ensure the liquidity of ETH during severe market liquidity crises such as Chinas ban on BTC mining in May 2021, the collapse of LUNA in May 2022, and the collapse of FTX in November 2022, and has currently gained a leading position in liquidity staking on the Ethereum network.
After that, Lidos spending on token incentives dropped significantly, and in the past year, the token incentive spending was less than 10 million US dollars. And the main destination of token incentives is the ecosystem. Lido hardly needs token incentives to maintain its current market share.
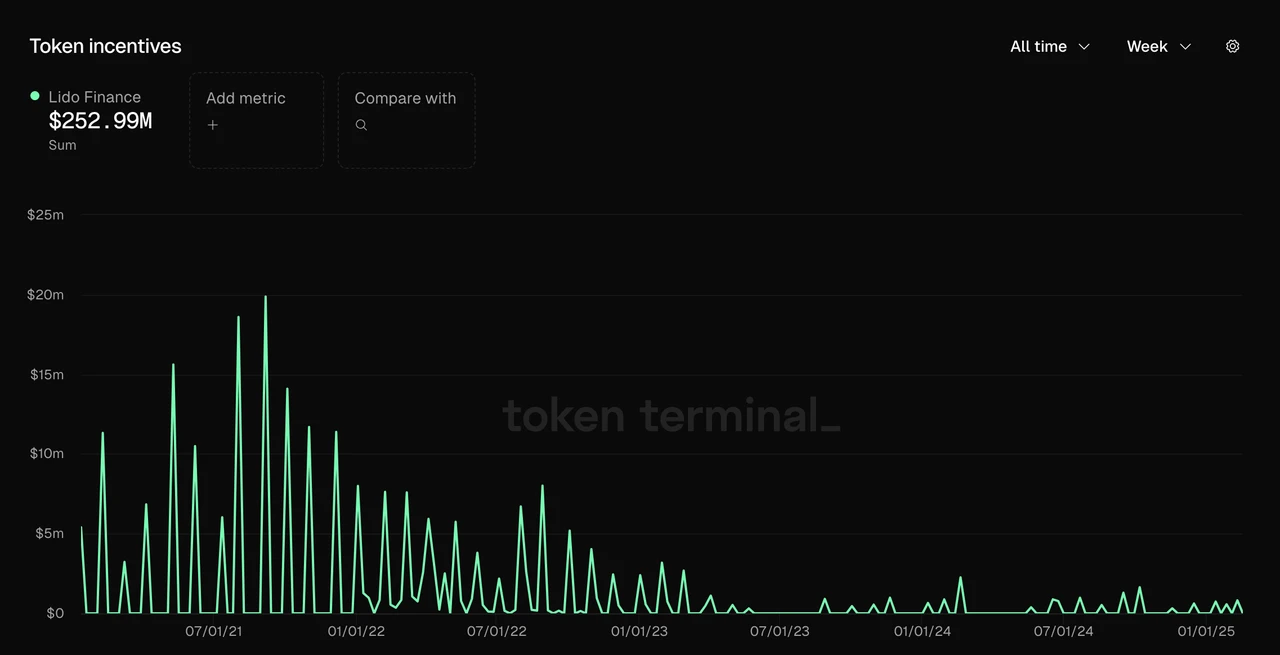
Data source: Tokenterminal Competition
Among the liquidity staking projects on the Ethereum network, few projects can compete with Lido. Currently, the second-ranked liquidity staking project RocketPool has a pledged asset size of less than 10% of Lido.
Among the newer projects, the Liquid Restaking project ether.fi poses a certain competitive pressure on Lido. However, the current scale of ether.fis pledged assets is only close to 20% of Lidos. With the issuance of Eigenlayers tokens, the growth rate of ether.fis pledged asset scale has also slowed down rapidly, and it is unlikely to challenge Lidos position in Ethereum staking.
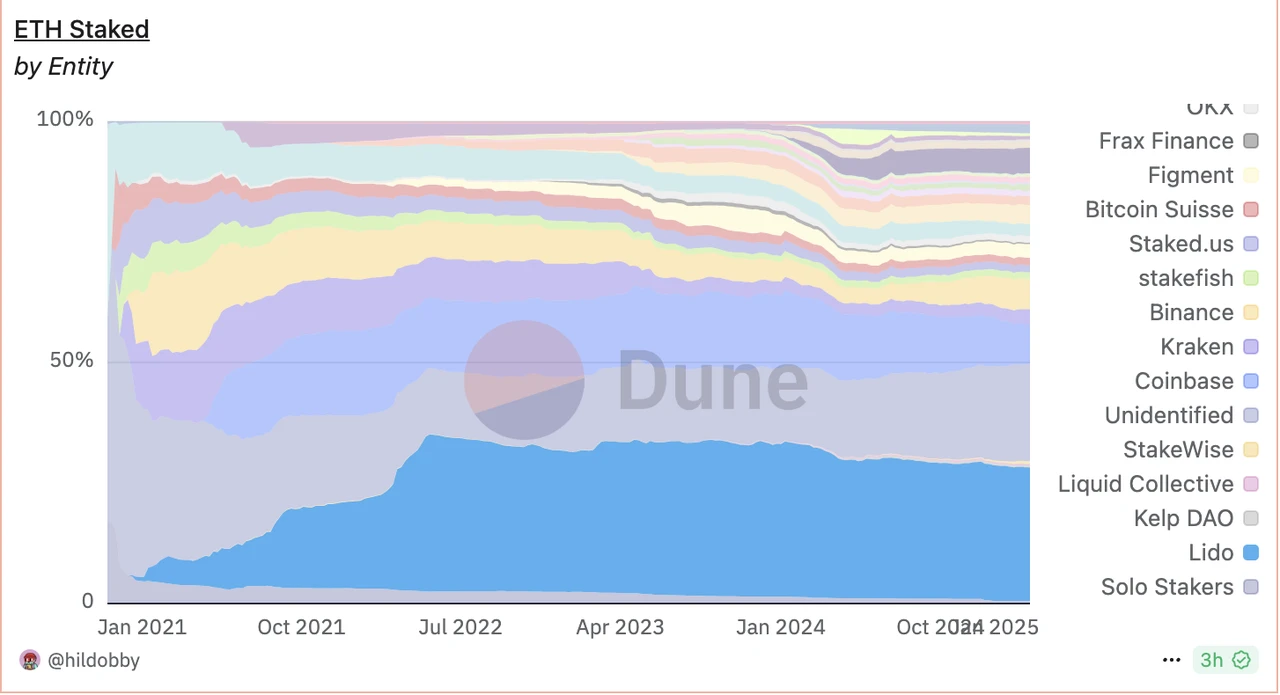
SourceDune
In the long-term development process, Lido has formed a certain moat:
The network effect brought by the good liquidity and composability of stETH (wstETH). In addition to the liquidity advantages mentioned above, stETH is accepted as a pledged asset by all the top lending or stablecoin protocols, and has an unparalleled composability advantage in LST, which will influence the choice of new pledgers to a certain extent.
Security credit accumulation and brand recognition: Since its launch, Lido has not had any major security loopholes. Combined with its long-term market leading position, it has also become an important consideration for whale users and institutions when choosing staking service providers. For example, Justin Sun and Mantle before developing mETH are typical representatives of using Lido services.
Main challenges and risks
The main challenge Lido currently faces comes from the need for decentralization of the Ethereum network.
For PoS chains, stakers determine the formation of consensus, and the Ethereum ecosystem currently has the most persistent pursuit of decentralization among mainstream PoS public chains, so it is inevitable that it is a bit harsh on the issue of Lidos scale: when the scale of Lidos pledged assets reached 30% of the scale of Ethereum network pledges, there were constant voices calling for limiting Lidos scale growth. The Ethereum Foundation is also constantly adjusting its pledge mechanism to prevent the emergence of an overly large single pledge entity.
For dapps, the only public chain that supports their business does not support and even restricts their business development, which is the biggest challenge for Lido in the medium and long term. Although Lido has long been aware of this and started to cut off the business of all other chains in 2023, and made it an important work goal to compete with Ethereum, the results are not obvious at present.
On the other hand, although the current ETH staking rate is less than 30% (28%), there is still a large gap compared to other PoS chains with a large market capitalization, such as Solana (65%), ADA (60%), and SUI (77%), the Ethereum team has always not wanted too much ETH to be staked, and has mentioned limiting the staking rate to a maximum of 30%. This also makes Lidos future market growth space relatively limited.
In addition, ETH itself has performed poorly in this cycle. As a project that is strongly correlated with ETH prices in terms of both concept and business data, Lido has naturally struggled in this cycle.
Valuation reference
In the past year, the PS of LDO has been at a historical low, especially in the past six months, its PS has been below 20.
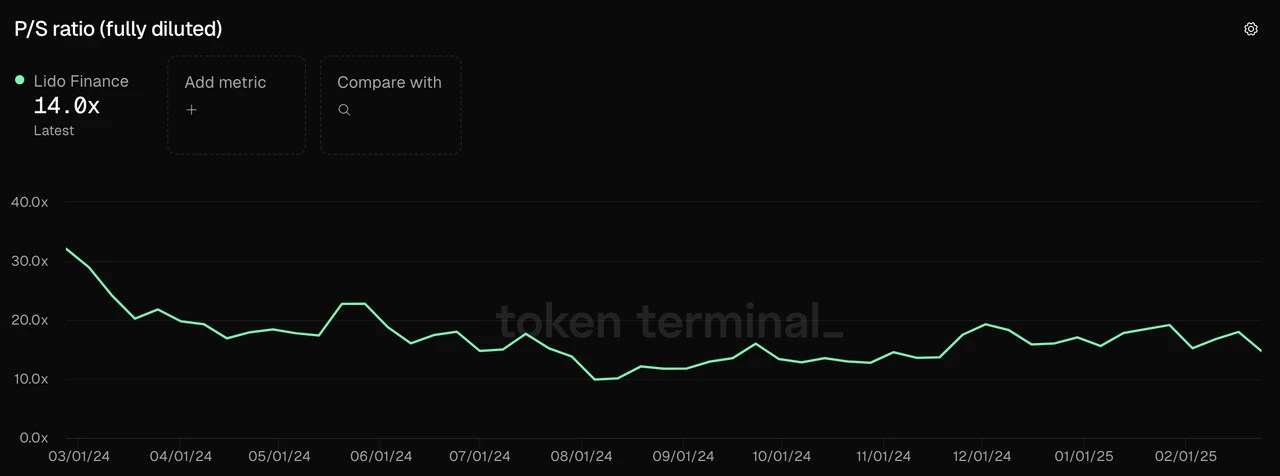
It is also worth pointing out that within this year, there is a possibility that protocol revenue will be converted into $LDO revenue. Since 2024, the community has repeatedly proposed to distribute protocol revenue (5% of the DAO) to $LDO holders, but the core team has clearly opposed it from a prudent perspective, and multiple governance process votes have not passed. However, with the significant easing of the regulatory environment and the protocol officially generating profits in the accounting sense since 2024 (protocol revenue minus all expenses including team salaries, there is still a surplus), the core team has also formally discussed directly linking protocol revenue to LDO in its 2025 goals. In 2025, we are expected to see $LDO begin to obtain the protocols staking income.
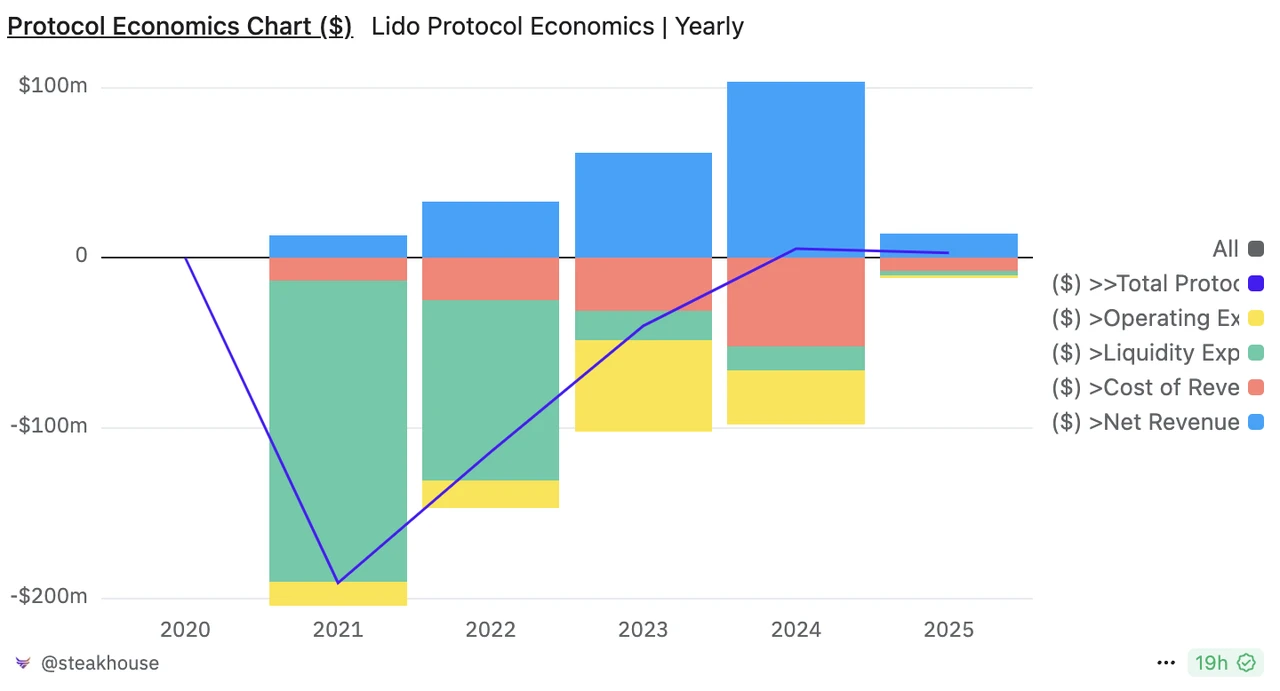
Lido Protocol Economy (the blue-purple line in the figure is the protocol’s “net profit”) Source: Dune
2.2 Jito: Making Money Quietly on Solana
Business Status
Jito is the leading liquidity staking service provider of the Solana network and the MEV infrastructure of the Solana network. They will also provide restaking services in 2024. However, the scale of restaking is still relatively small, with TVL just exceeding 100 million US dollars, and the source of income from the restaking part is not clear. Jitos main business is still the first two: liquidity staking services and MEV service providers.
The liquidity staking service provided by Jito on Solana is similar to that provided by Lido on the Ethereum network. The SOL deposited by users will be used by node operators to participate in Solanas staking, and 10% of user earnings will be extracted as protocol income.
In terms of MEV, the Jito labs team previously took 5% of all revenue. However, after the launch of NCN (Node Consensus Networks) and JIP-8 and other proposals at the end of January this year, the Jito protocol began to obtain 3% of MEV revenue, which is specifically divided into: Jito DAO obtains 2.7%, staking JTO Vault obtains 0.15%, and jitoSOL and other LST pledgers obtain 0.15%.
When users conduct transactions on Solana, the gas fee they pay can be divided into three categories: basic fee, priority fee and mev tip. The basic fee must be paid, and the priority fee and mev tip are optional. Their main purpose is to increase the priority of the transaction. The difference is that the purpose of the priority fee is to increase the priority of the transaction on the chain stage. It is a unified setting of the Solana protocol layer and belongs to the validator (ie, the staker); while the MEV tip is a separate agreement between the user and the MEV service provider. The purpose is to obtain a higher transaction priority from the MEV service provider so that its transaction can be built first (and then on the chain). The specific allocation is decided by the MEV service provider.
Currently, Jitos MEV service returns 94% of the fees collected to the validator, 3% is extracted by Jito Labs, and 3% is allocated to the Jito protocol. In the previous gas fee of the Solana network, the proportion of the basic fee was small and negligible, and the priority fee and MEV tip were of similar size.
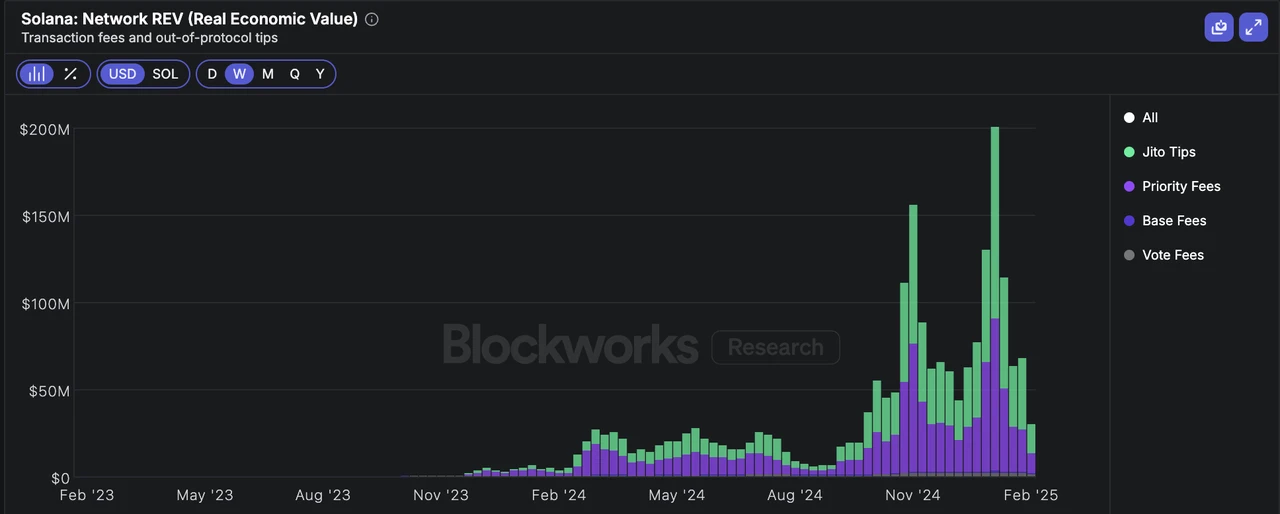
Solana network’s REV (i.e., all fees paid by users) Source: Blockworks
Compared with Lidos situation in Ethereum, Jito can obtain more value from MEV revenue because of its near-monopoly on MEV in the Solana ecosystem (Jito MEVs position in the Solana ecosystem is similar to Flashbots in the Ethereum ecosystem).
Next, let’s look at Jito’s specific data:
Assets staked
Currently, Jitos pledged assets (liquidity pledge) exceed 2.5 billion US dollars
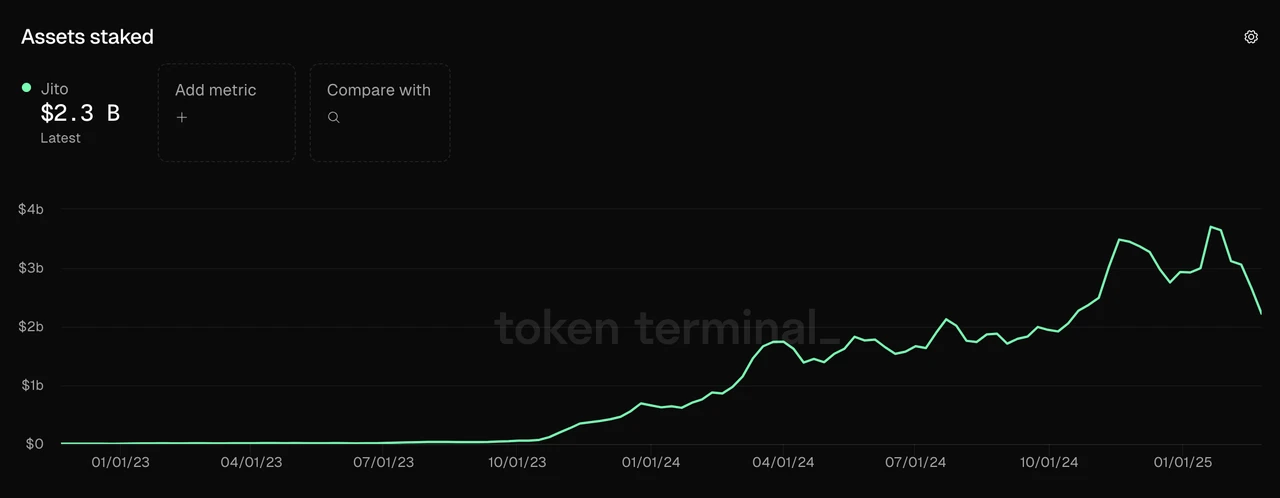
Data source: Tokenterminal
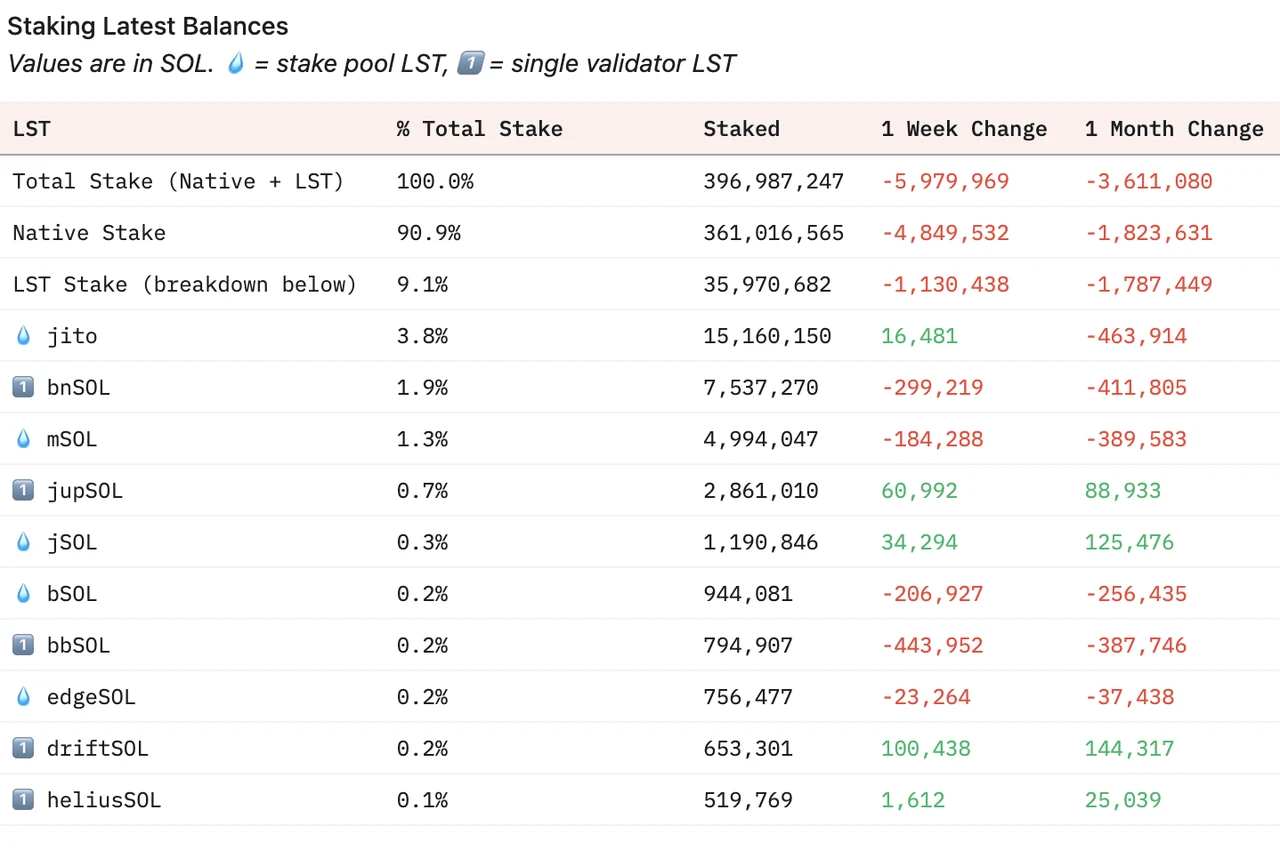
Calculated in terms of SOL, Jito has 15.82 million staked SOL, accounting for approximately 3% of the total SOL circulation. Over the past year, staked SOL has shown a steady linear increase.
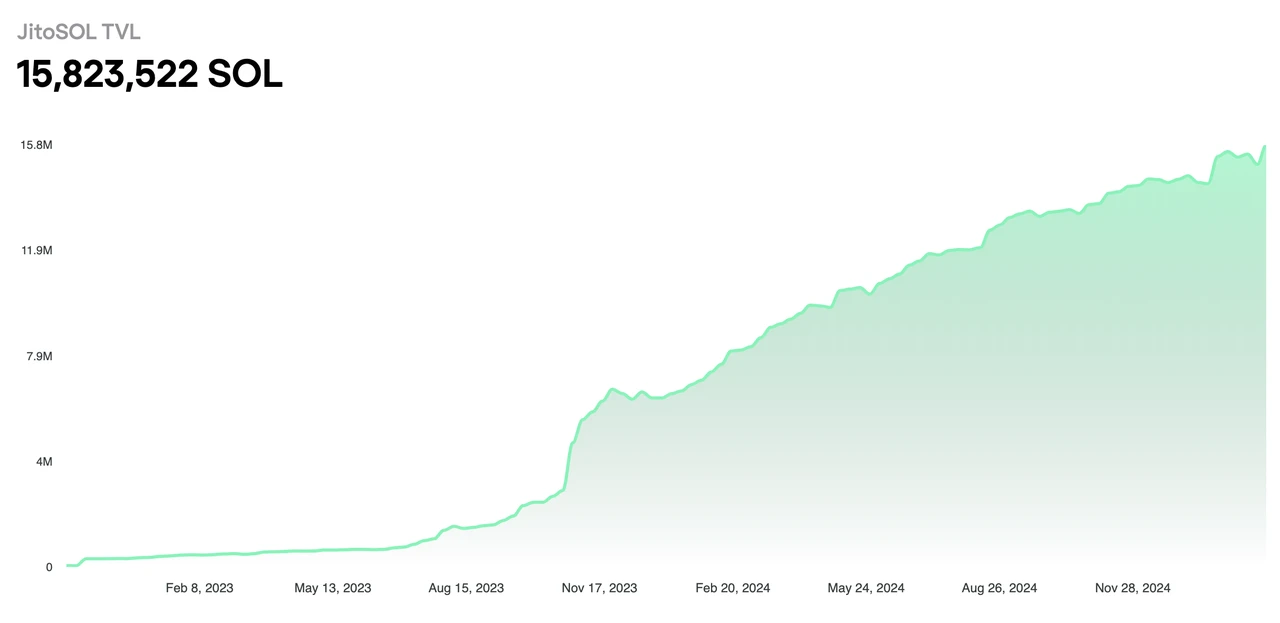
Source: Jito official website
In the MEV field, Jito has a near-monopoly position in Solana. Currently, more than 94% of the 394 million SOLs staked have used Jitos MEV services.
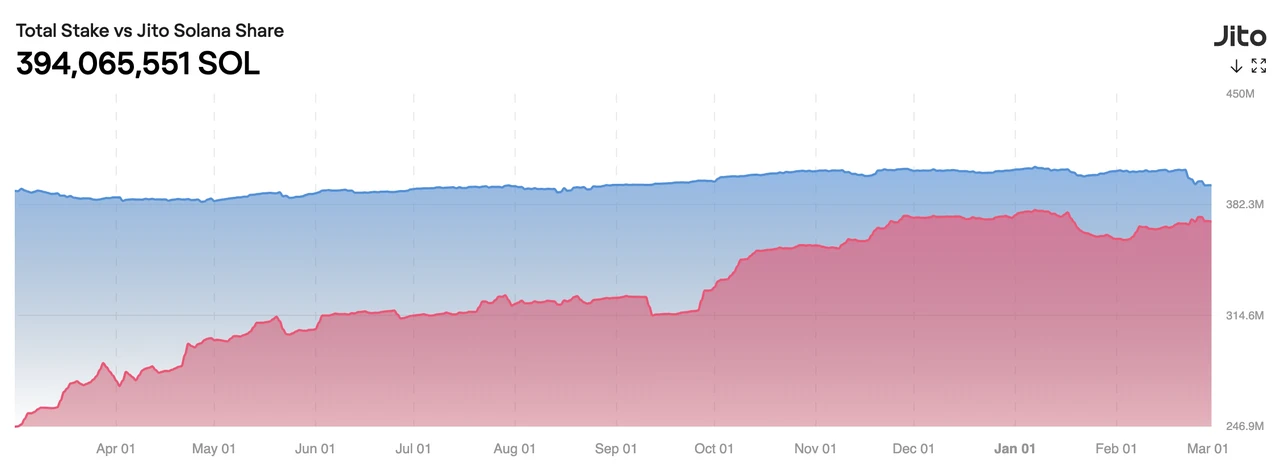
Source: Jito official website
Gross Profit
Jitos current protocol revenue consists of two parts. They charge 10% of the income generated by liquidity staking and 3% of MEV income. Currently, Jito distributes 4% of the liquidity staking income to node operators, so the gross profit of its liquidity staking part is 60% of the income. Since the author has not found a separate data source for Jitos gross profit, we will analyze it based on Jitos income, as shown in the following figure:
Data source: Tokenterminal
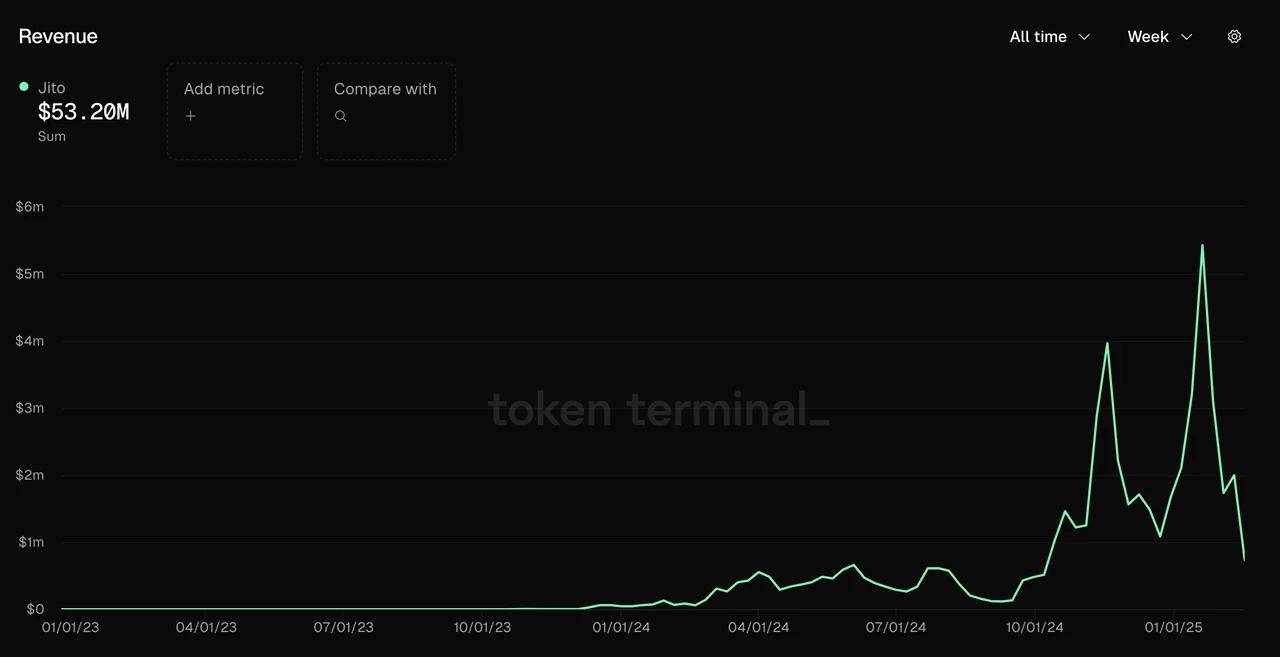
It can be seen that Jitos revenue is completely related to the popularity of the Solana network. Since October 24, its revenue has increased by orders of magnitude compared to before, with weekly revenue exceeding 1 million US dollars, and this part of the revenue has two significant high points: November 20 and January 20, Jitos protocol revenue was as high as 4 million US dollars and 5.4 million US dollars respectively, corresponding to two major speculative booms on the chain. However, after the Solana chain was recently unpopular, its revenue has also dropped rapidly.
As for MEV, probably because the revenue sharing of MEV has just been launched, the author has not found any statistics on this part in the current mainstream data statistics websites and Dune, but we can make a conversion based on JitoMEVs total revenue. The following figure shows Jitos total MEV revenue:
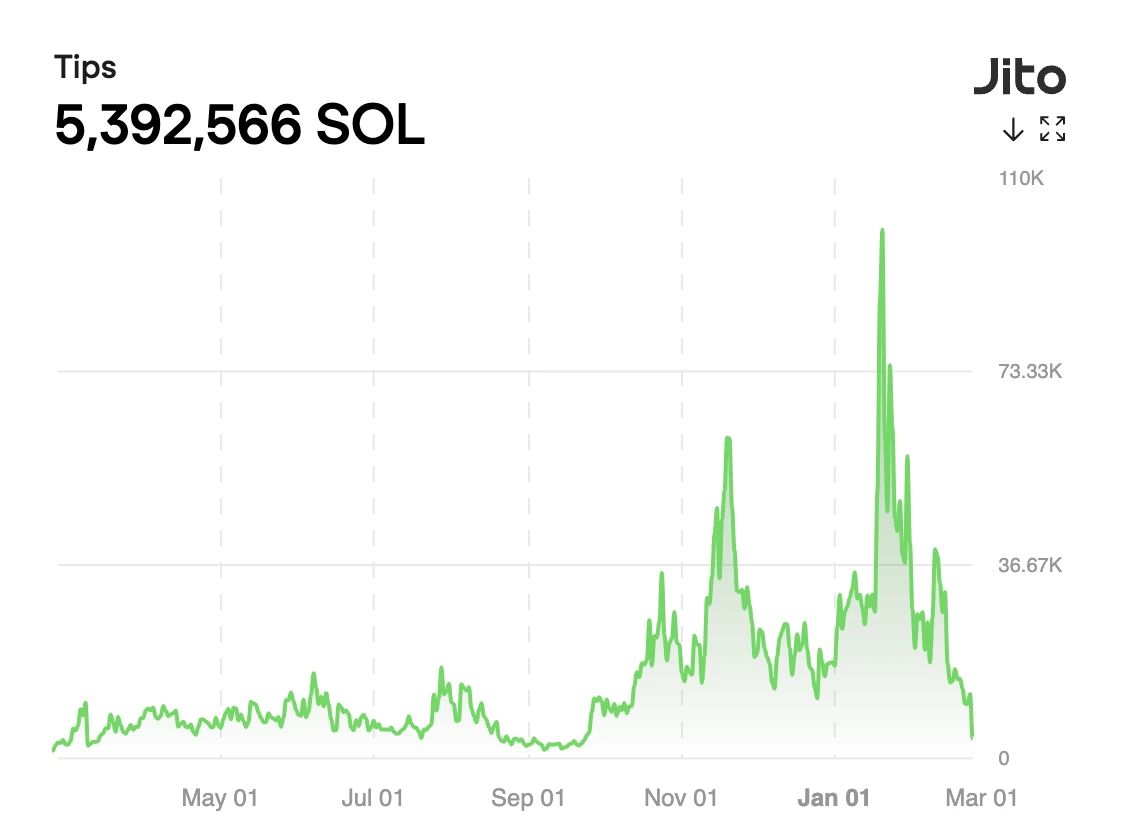
Jito’s MEV total revenue source: Jito official website
The total income of Jito MEV is consistent with the income trend of Jitos liquidity staking part. At the peak on January 20 this year, the total income of MEV was 100,000 SOL. After October 2024, the average daily MEV income was about 30,000 SOL, and the lowest value was 10,000 SOL.
We back-tested the revenue during this period based on a 3% protocol revenue rate. The highest daily revenue was 3,000 SOL, which was approximately $840,000 based on the price at the time. The highest weekly revenue was 14,400 SOL, approximately 3.7 million U. The average daily MEV revenue was 1,000 SOL (approximately 170,000 U. Detailed forecasts for this part of revenue were made in the JIP-8 proposal , and interested readers can read it for themselves).
In general, in addition to the current liquidity staking income, the income from MEV can roughly increase Jitos revenue scale by another 50%;
In terms of gross profit scale, the gross profit of liquidity staking income is about 600,000 US dollars per week on average, while the gross profit of MEV income is as high as 95% (only 0.15% allocated to jitoSOL is not counted as gross profit, and the part entering DAO and JTO Vault can be counted as gross profit), corresponding to a gross profit of about 1 million US dollars per week, which can increase Jitos gross profit scale by about 150%, and the annualized gross profit scale is about 85 million US dollars.
It should be pointed out that Jito’s revenue and gross profit are strongly related to the popularity of the Solana network. After the recent Solana network meme trading craze subsided, its daily revenue has dropped to about 10% of the peak, and the data has fluctuated greatly.
Token Incentives
Whether it is liquidity staking or MEV, Jito has not provided token incentives for its business. The only token incentive is the one-time token airdrop of 10% when it was launched.
Competition
Restaking has not yet generated real PMF, so we will mainly analyze Jito’s competition in terms of liquidity staking and MEV.
In Solanas liquidity staking market, although its business was officially launched in 2023, it has come from behind and is currently in a leading position. The previous leaders Marinade and Lido once occupied more than 90% of the entire Solana liquidity staking market, but were surpassed by Jito due to their own reasons.
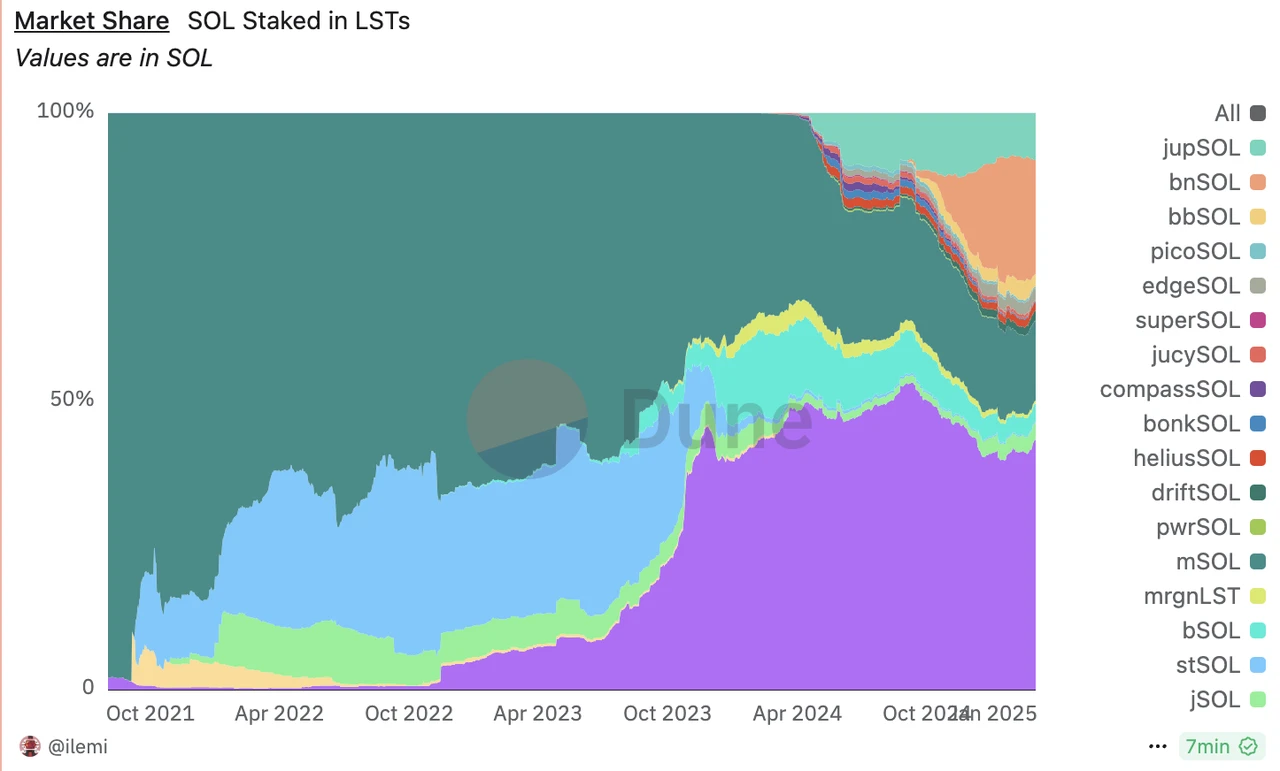
Solana Liquidity Staking Market Share Source: Dune
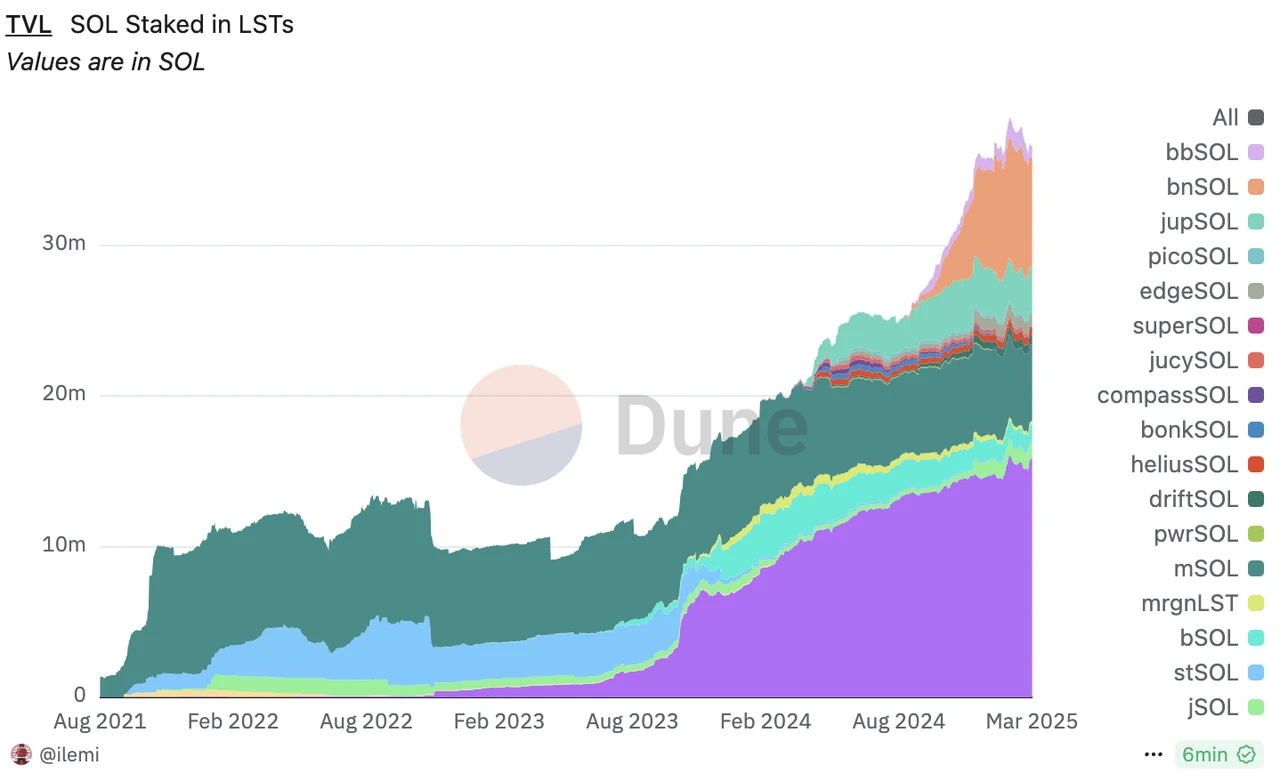
Starting from the end of 2023, Solanas liquidity staking market welcomed more players, and more and more players such as Blazestake and Jupiter joined the battlefield, but Jitos market share was not affected. However, starting in October 2024, the SOL liquidity staking products of exchanges (mainly Binances bnSOL, but also Bybits bbSOL) caused Jitos market share to decline. This is mainly due to the natural advantage of centralized exchanges in custodial assets. They converted SOL financial products from native staking to liquidity staking, providing users with a better experience, and thus their share rose rapidly. We can also see from Figure 1 above that the incremental part from bnSOL and bbSOL is relatively independent and does not encroach on the share of certain LST protocols.
Currently, more than 90% of Solana’s stakes are still native stakes, with less than 10% of the liquidity stake rate, which has a lot of room for improvement compared to Ethereum’s 38%. Of course, for ordinary users, it is much easier to participate in Solana’s native stake than in Ethereum’s native stake. The proportion of Solana’s liquidity stakes may not eventually reach that of Ethereum, but liquidity stakes still bring relatively better liquidity and composability. In the future, Jito will still benefit from the increase in the overall scale of Solana’s liquidity stakes.
Solana staking market share Source: Dune
In the MEV field, Jito, which occupies more than 90% of the market share, has almost no competitors. This part of the market space mainly depends on the future activity of Solana on the chain.
Overall, Jito has a relatively solid leading advantage in the fields of liquidity staking and MEV of the Solana network. This is also reflected in the fact that the SECs ETP working group invited Jito to consult on ETF staking issues.
Main challenges and risks
Jitos current business and revenue are highly dependent on the popularity of the Solana network, so the main risk faced by Jito also comes from this. After TRUMP and LIBRA, the markets enthusiasm for Meme quickly cooled, the price of SOL also fell rapidly, and Jitos business revenue also decreased rapidly. Whether Jitos business can regain its growth in the future depends mainly on the popularity of the Solana network.
In the field of liquidity staking, competition from centralized exchanges may affect Jito’s market share.
From an investment perspective, another possible risk is that the circulation ratio of JTO tokens is less than 40%. A large proportion of 15% was unlocked in December last year, and it will continue to be unlocked linearly in the next two years. The inflation rate in the next year will reach 62%. The selling pressure from early investors is also a potential risk factor.
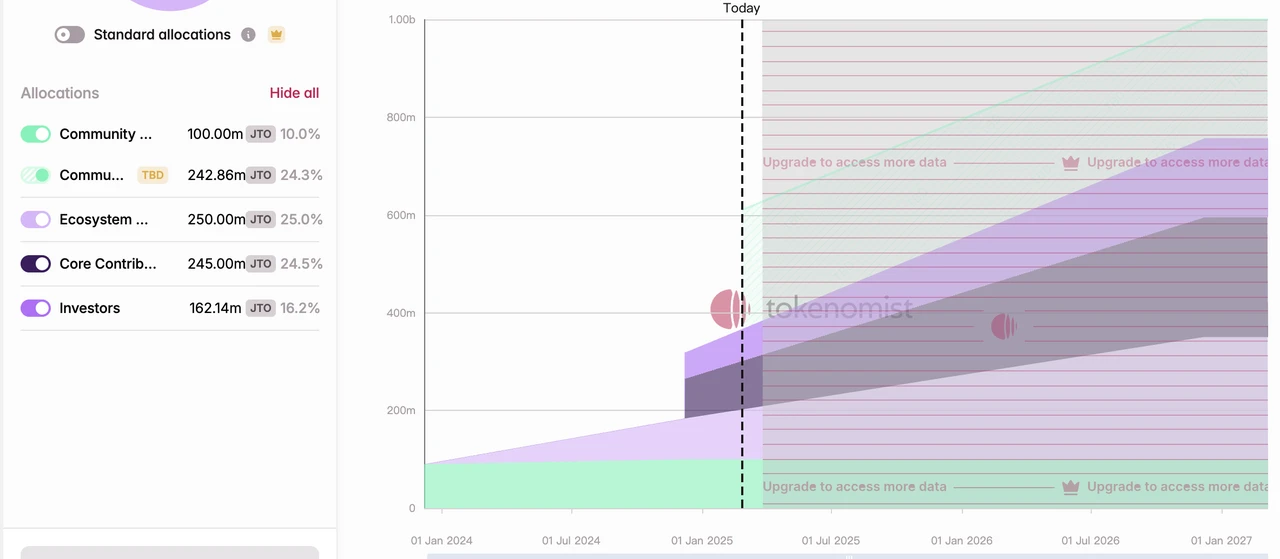
Source: tokennomis
Valuation reference
With the recent popularity of Solana, JTOs fully-circulated PS valuation has dropped rapidly and has now dropped to around 33. This valuation does not take into account the MEV revenue that has started recently. If MEV revenue is taken into account, JTOs fully-circulated valuation will drop to around 22.
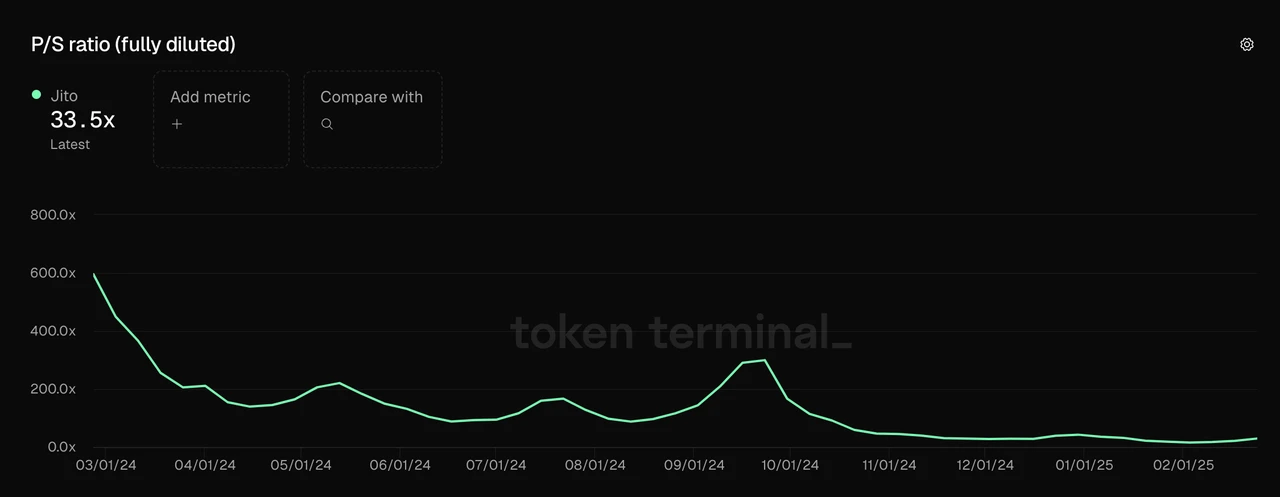
Data source: Tokenterminal
In addition, JTO may also accelerate the distribution of income. Among the MEV income collected by the protocol, 0.15% has been distributed to JTO pledgers. In the future, as income continues to grow, more income may be distributed to JTO pledgers.


