


This week on 11.14 21:30 (Beijing time), the United States announced the CPI index. The market first fell and then rebounded. It was a rising and volatile market, and one type of strategy performed well. This strategy is also a common trading strategy in US stock trading. Entry conditions are as follows:
1. Price’s 30-day long-term momentum is up
2. The normalized 5-day short-term RSI crosses -15 up and down, enter the market and go long
3. After the normalized 5-day short-term RSI rises to 30, take profit and exit.
4. Stop out when the normalized 5-day short-term RSI falls to -20
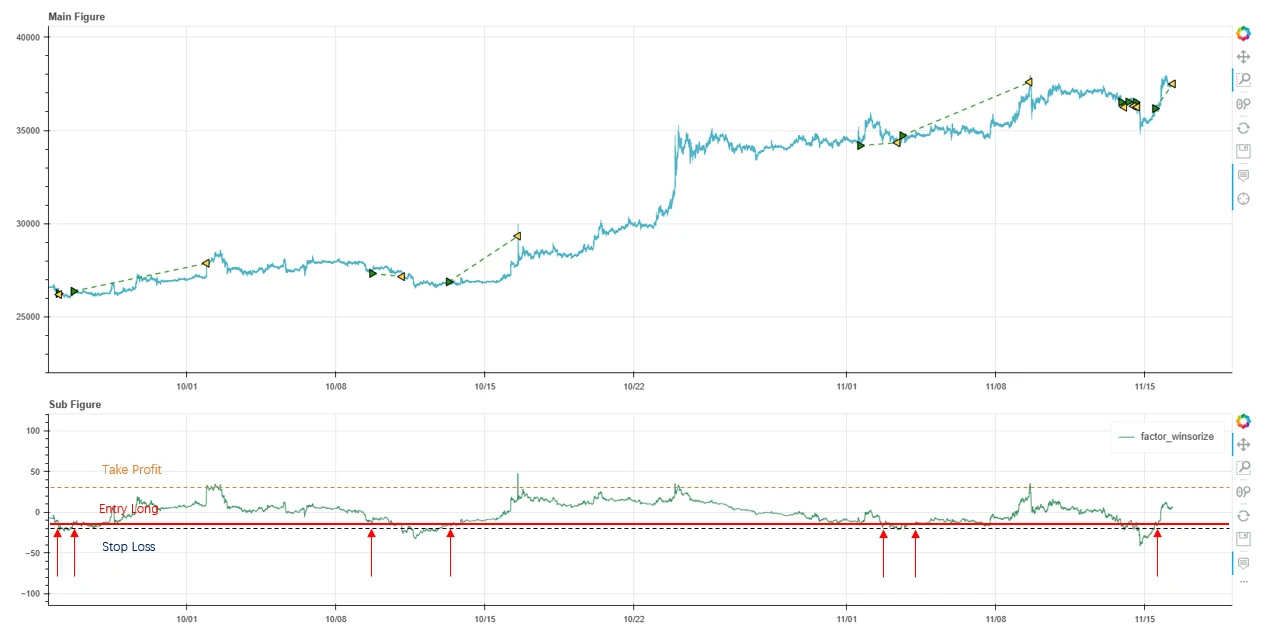
RSI Uptrend Swing Buy Low Sell High Trading Strategy Signals on BTC
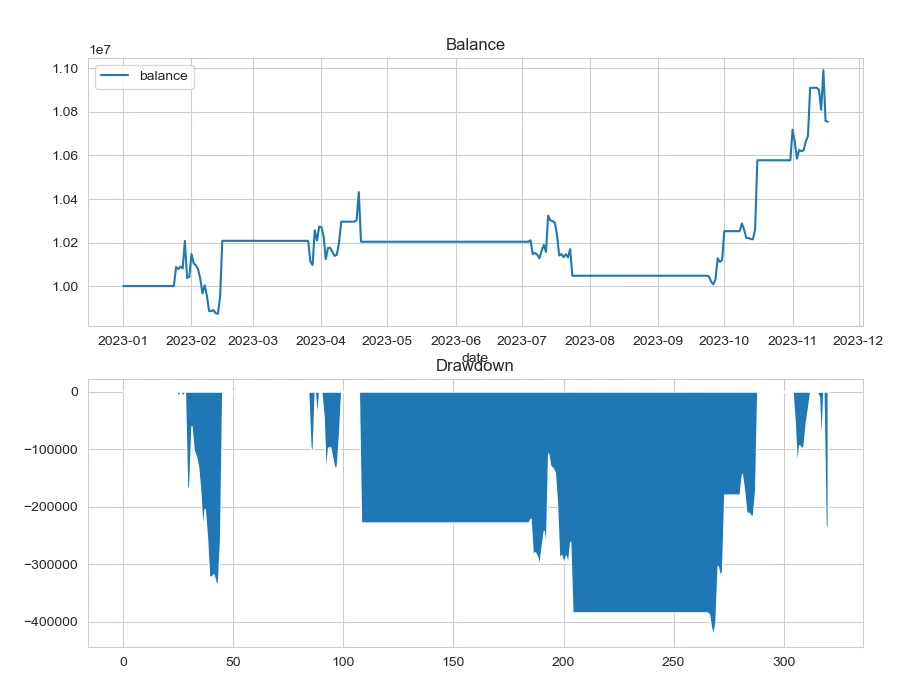
YTD Performance of Buy Low Sell High Trading Strategy on BTC during RSI Shock Rise
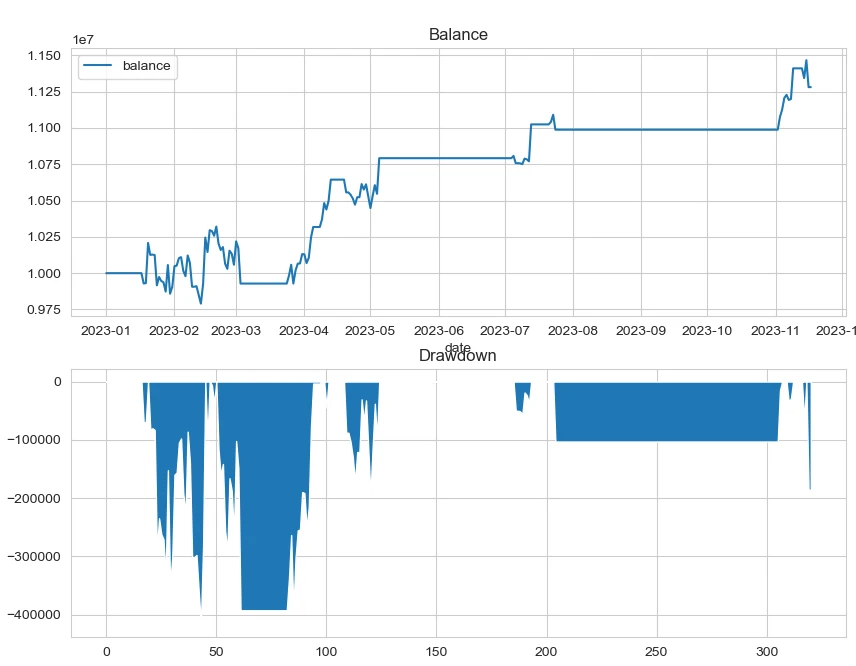
YTD performance of RSI rising trend, buy low, sell high trading strategy on ETH
The current implied volatility remains at about 60% annualized, and BTC and ETH have not yet experienced continuous large-volume increases. In the current environment, the trading strategy of buying low and selling high performs better in the current environment when the rising trend fluctuates.
The Bitcoin halving is about 147 days away from today (2023.11.17)
Countdown to halving:https://www.nicehash.com/countdown/btc-halving-2024-05-10-12-00?_360safeparam=1289146171
Market technical and emotional environment analysis
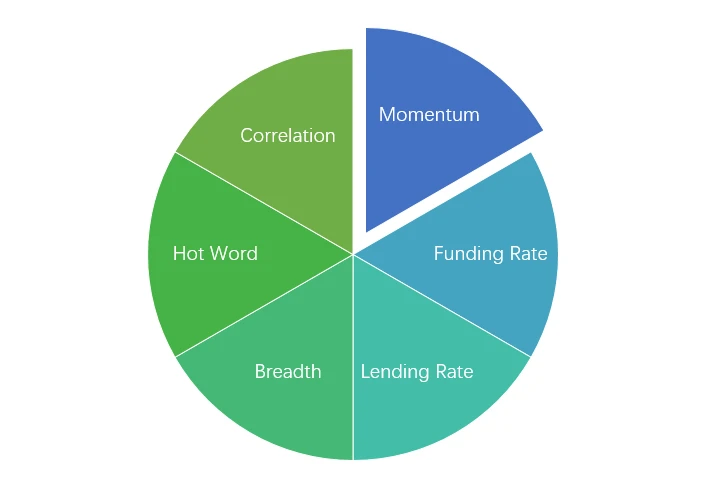
Sentiment analysis components

Technical indicators
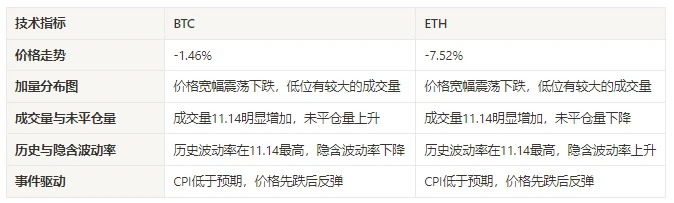
Price trend
BTC price fell by -1.46% and ETH price increased by -7.52% in the past week.
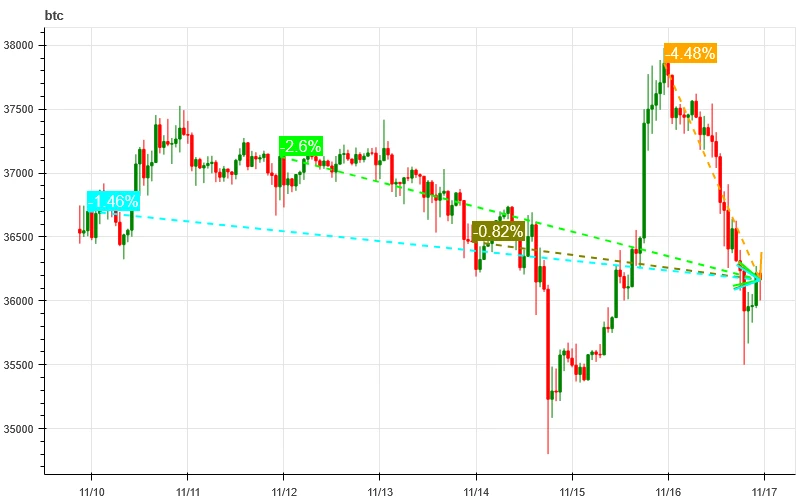
The picture above is the price chart of BTC over the past week
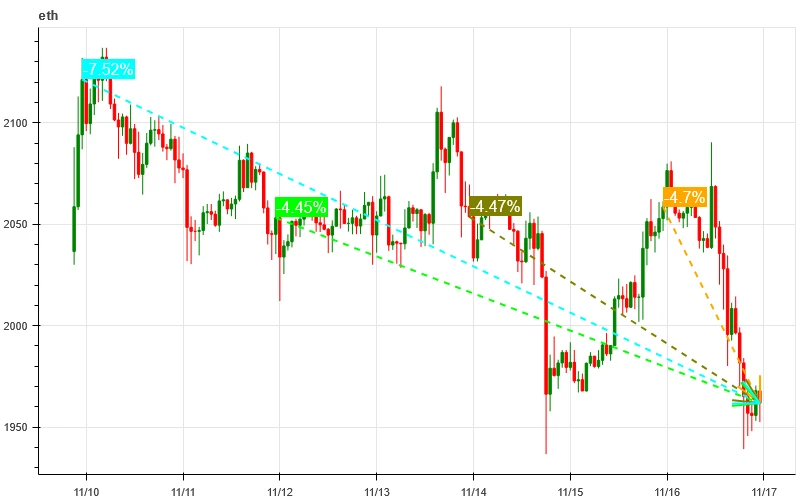
The picture above is the price chart of ETH over the past week
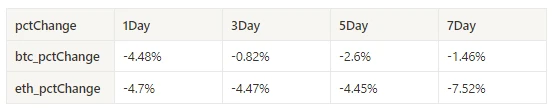
Table showing the rate of price change over the past week
Price and volume distribution chart (support and resistance)
In the past week, the prices of BTC and ETH have fluctuated and fallen in a wide range, with large trading volumes changing hands at low levels.
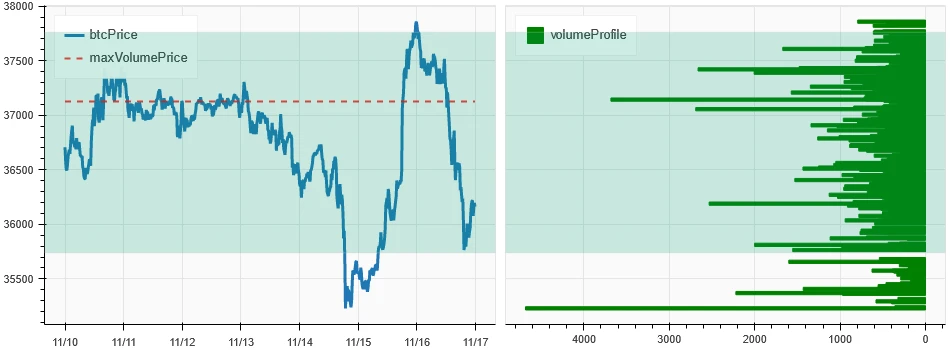
The picture above is the distribution map of BTC’s intensive trading areas in the past week.
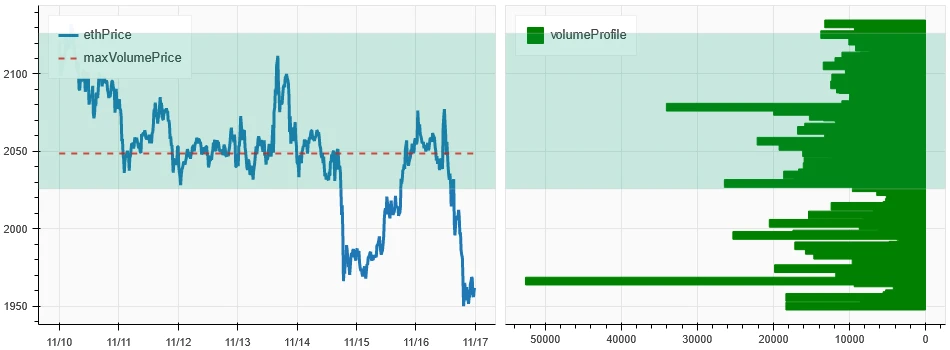
The picture above is the distribution map of ETH’s intensive trading areas in the past week.
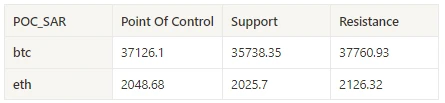
Table showing the intensive weekly trading ranges for BTC and ETH over the past week
Volume and Open Interest
Both BTC and ETH have seen significant increases in trading volume over the past week following the release of the 11.14 CPI data; open interest in BTC increased while ETH decreased.
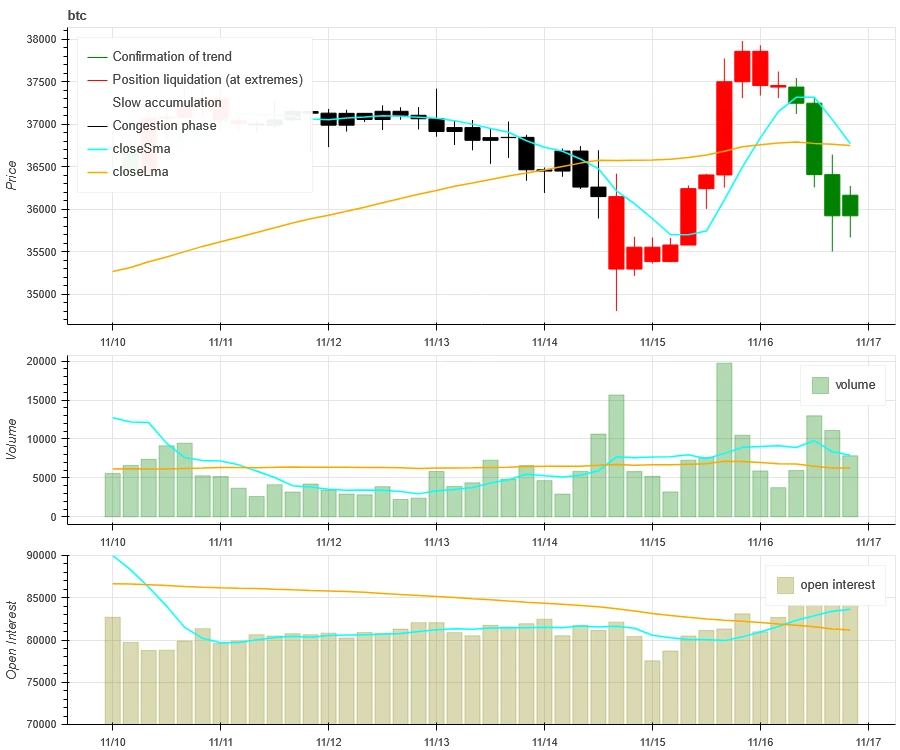
The price trend of BTC at the top of the picture above, the middle is the trading volume, the bottom is the open interest, the light blue is the 1-day average, and the orange is the 7-day average. The color of the K line represents the current status. Green means that the price rise is supported by trading volume, red means positions are being closed, yellow means positions are slowly accumulating, and black means congestion.
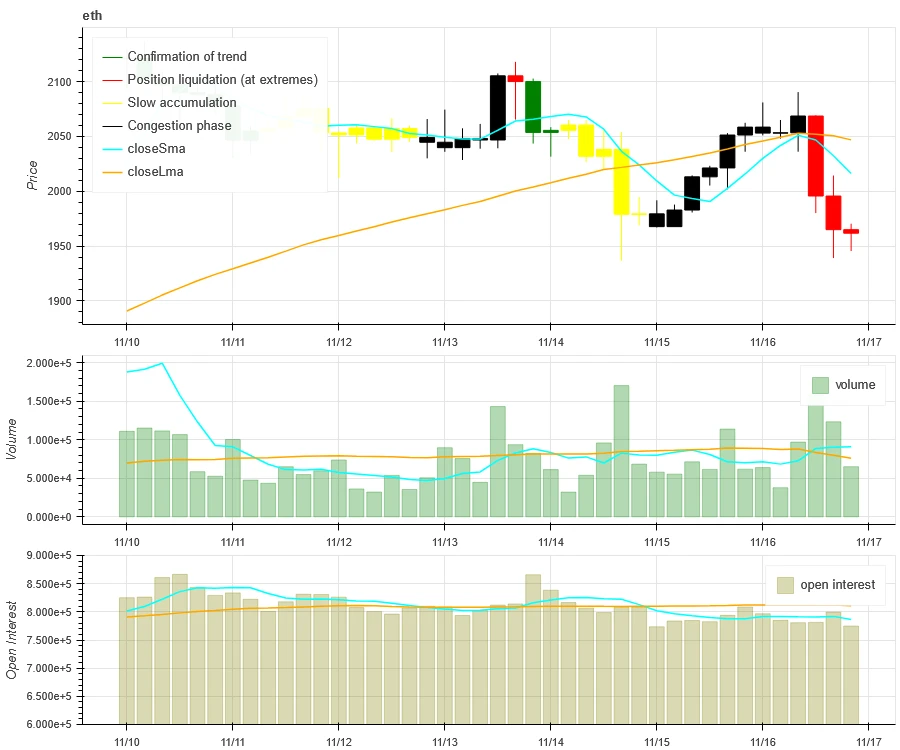
The price trend of ETH at the top of the picture above, the middle is the trading volume, the bottom is the open interest, the light blue is the 1-day average, and the orange is the 7-day average. The color of the K line represents the current status. Green means that the price rise is supported by trading volume, red means positions are being closed, yellow means positions are slowly accumulating, and black means congestion.
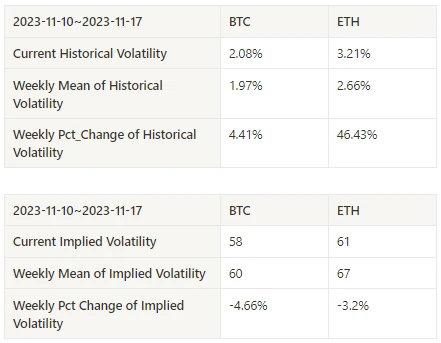
Historical Volatility vs. Implied Volatility
Historical volatility for BTC and ETH over the past week was highest at 11.14, with implied volatility declining.
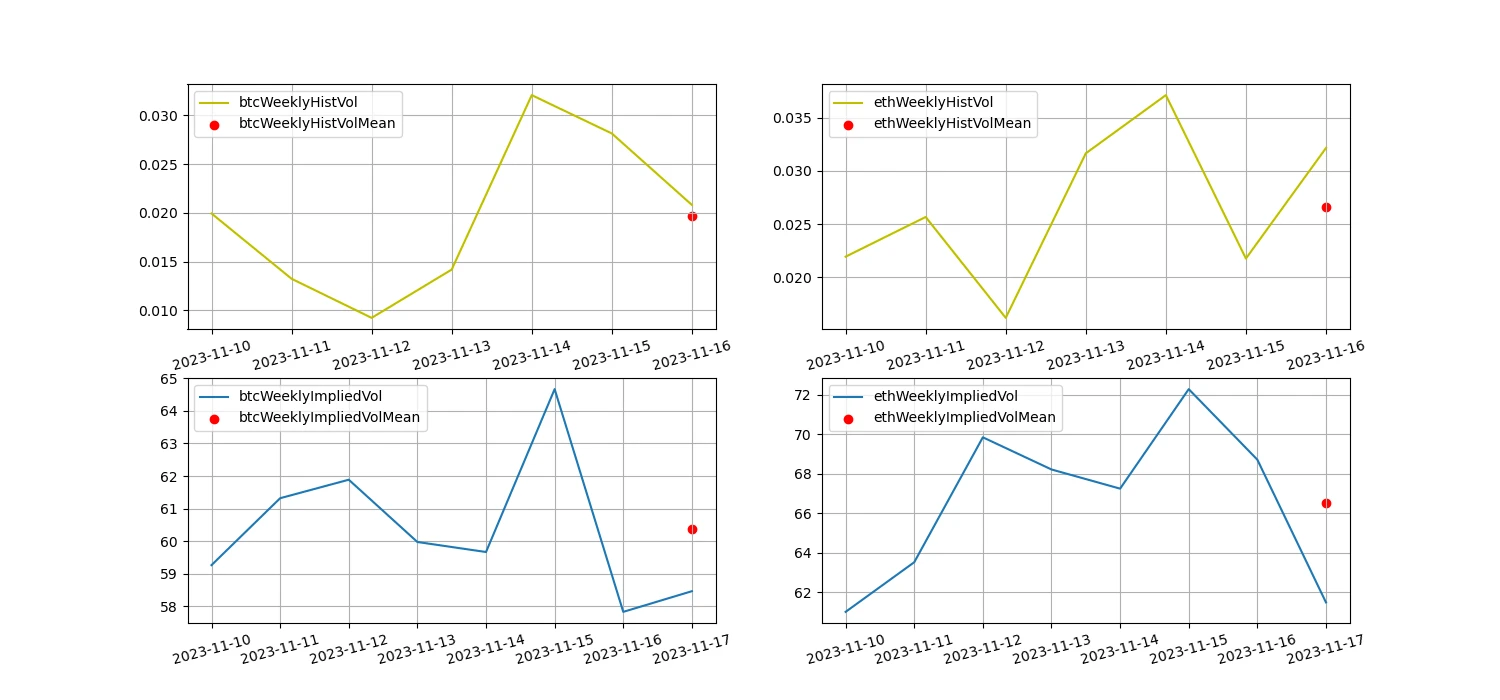
The yellow line is historical volatility, the blue line is implied volatility, and the red dot is its 7-day average
event driven
At 21:30 pm Eastern Time on Tuesday, November 14th (Beijing time), the CPI data was announced at 3.2%, which was smaller than the predicted 3.3%. After the announcement, the BTC price first fell and then rebounded.
sentiment indicator
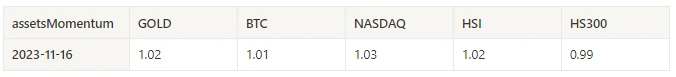
momentum sentiment
Among the Bitcoin/Gold/Nasdaq/Hang Index/A 50 in the past week, the Nasdaq was the strongest, while the worst performer was the CSI 300.
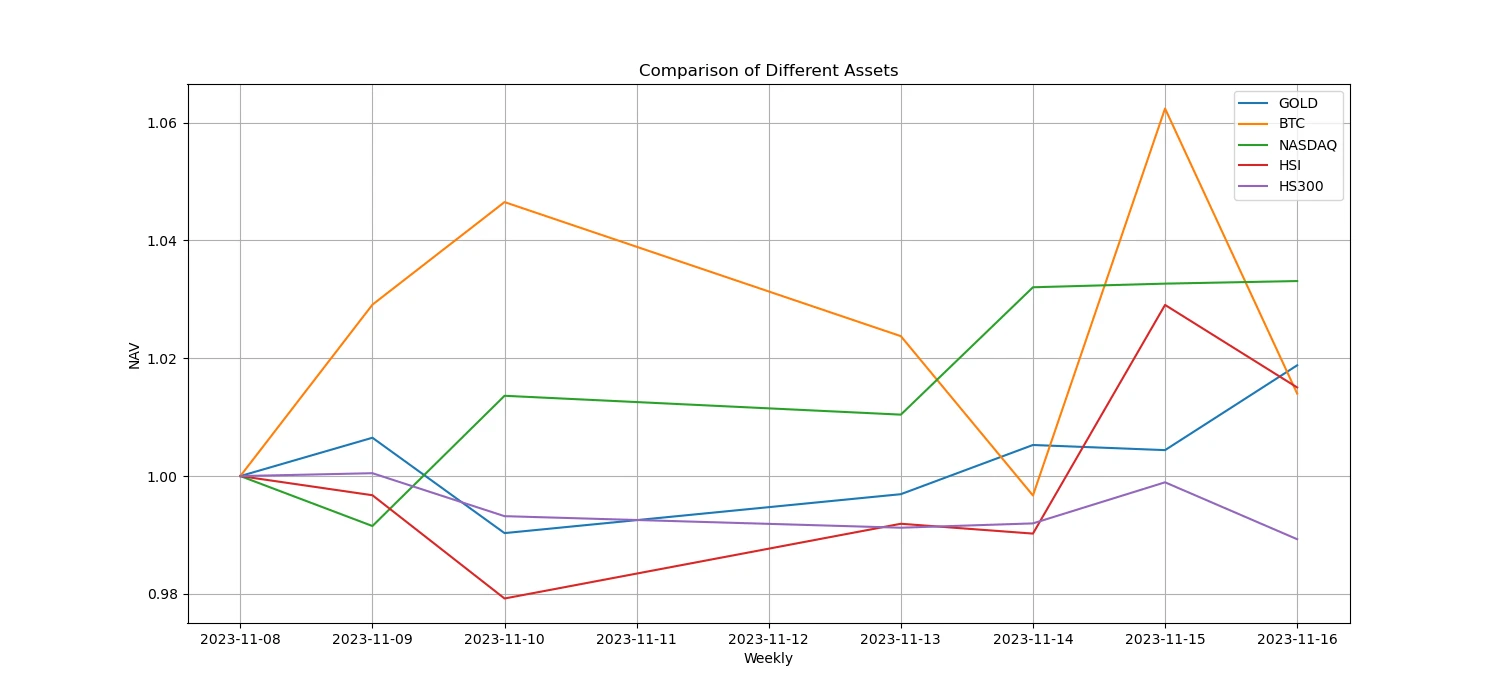
The picture above shows the trends of different assets over the past week.
Lending interest rates - lending sentiment
The average annualized return on USD lending over the past week was 17%, with interest rates stable.
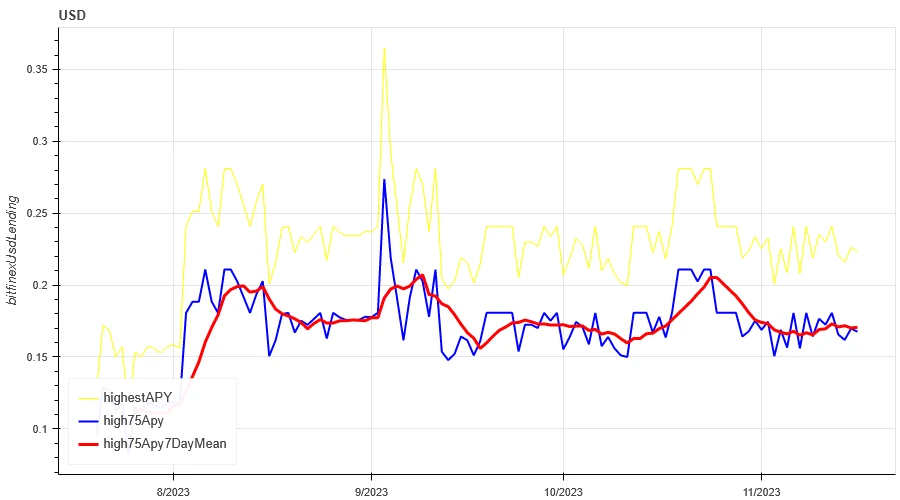
The yellow line is the highest price of the USD interest rate, the blue line is 75% of the highest price, and the red line is the 7-day average of 75% of the highest price
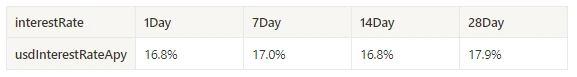
The table shows the average return of USD interest rate for different holding days in the past
Funding Rate-Contract Leverage Sentiment
The average annualized return on BTC rates in the past week was 16.7%, and contract leverage sentiment was high.
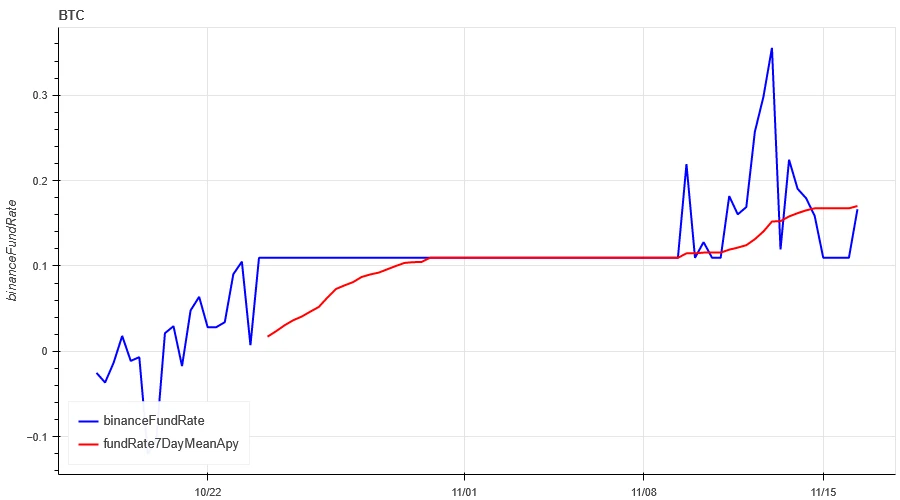
The blue line is the funding rate of BTC on Binance, and the red line is its 7-day average
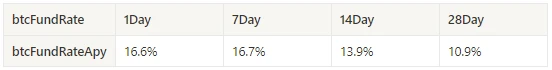
The table shows the average return of BTC fees for different holding days in the past
Market Breadth - Overall Sentiment
With 90% of the 46 coins selected over the past week above the 30-day moving average, the market remains in an uptrend.
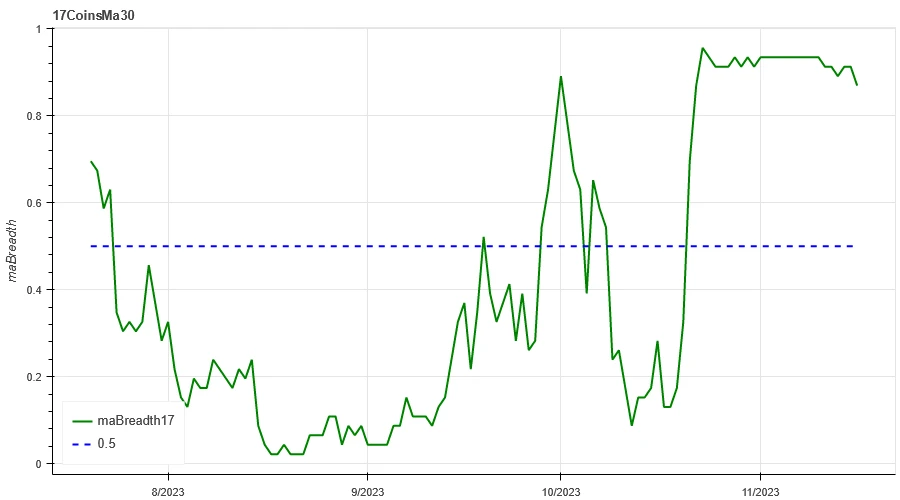
The picture above is [btc, eth, bnb, ltc, bch, doge, matic, sol,link,uni, enj,gala , mana, axs, dydx, fet ,gmx, xlm, xrp, ada, trx, sol, dot, avax, shib, atom, xmr, etc, ldo, hbar, apt, vet, qnt, vet,crv, aave, algo , ftm, ape, neo, sand, eos, xtz, rndr, theta, mkr] proportion above the 30-day moving average
Market Correlation - Consistent Sentiment
Among the 46 coins selected in the past week, the correlation dropped to around 0.6, resulting in divergent prices among different varieties.
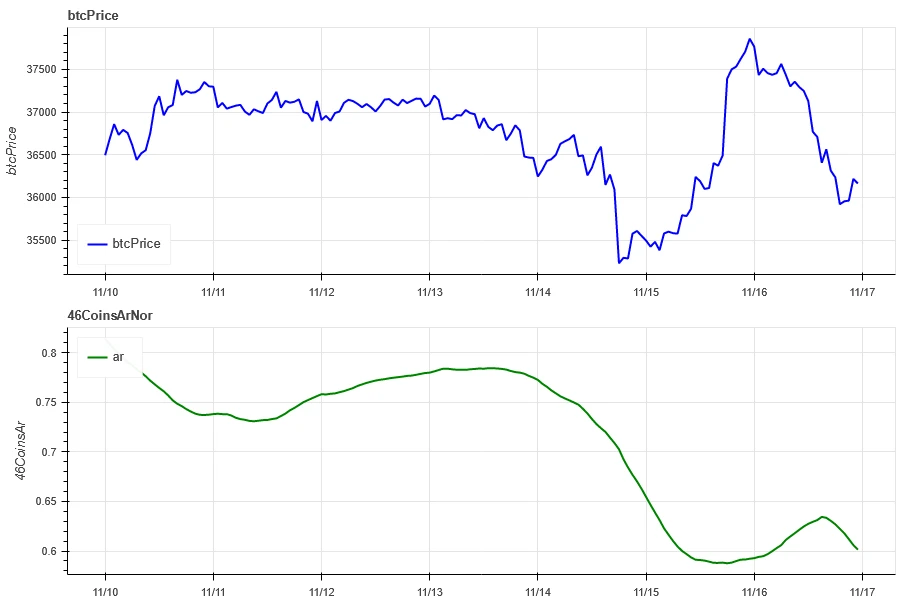
The blue line in the above picture first shows the Bitcoin price, and the green line is [btc, eth, bnb, ltc, bch, doge, matic, sol, link, uni, enj,gala, mana, axs, dydx, fet ,gmx, xlm, xrp, ada, trx, sol , dot, avax, shib, atom, xmr, etc, ldo, hbar, apt, vet, qnt, vet, crv, aave, algo, ftm, ape, neo, sand, eos, xtz, rndr, theta, mkr] overall Correlation
Market Hotspots – Social Media Sentiment
The most popular stock in the past week is AVAX/DOGE, which has not seen a major increase so far.
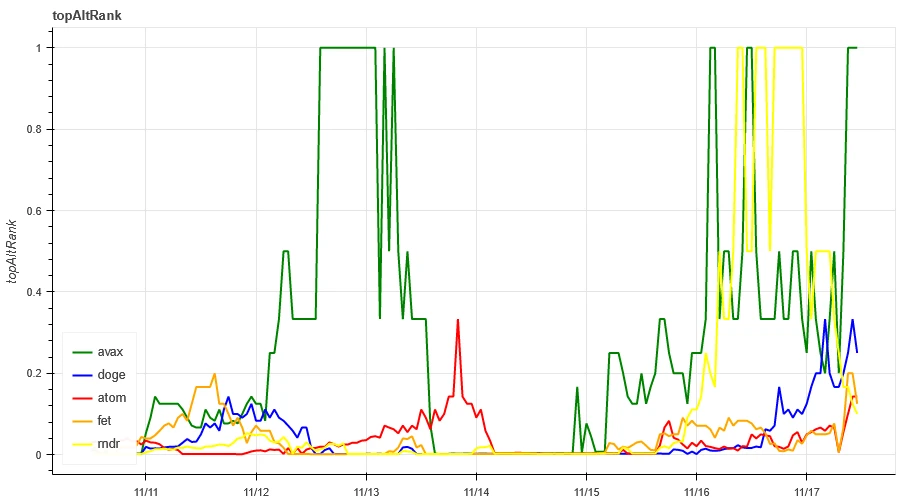
Data Sources:https://lunarcrush.com/categories/cryptocurrencies
Summarize
The market did not experience a sustained rise this week, but fluctuated widely in the upward trend. The implied volatility of both BTC and ETH decreased this week; in terms of price trends, BTC continued to fluctuate at a high level, while the ETH price also faced the previous high. point pressure; in terms of hot spots, AVAX and DOGE have been relatively high recently, but have not seen a large increase so far, so we can focus on it; in terms of events, the CPI data is lower than expected, and it is generally believed that the Federal Reserve will not raise interest rates in the short term, and we will wait for next month. data released.
Twitter: @DerivativesCN
Website: https://dcbot.ai/


