


Small market capitalization and sector rotation in the bull market
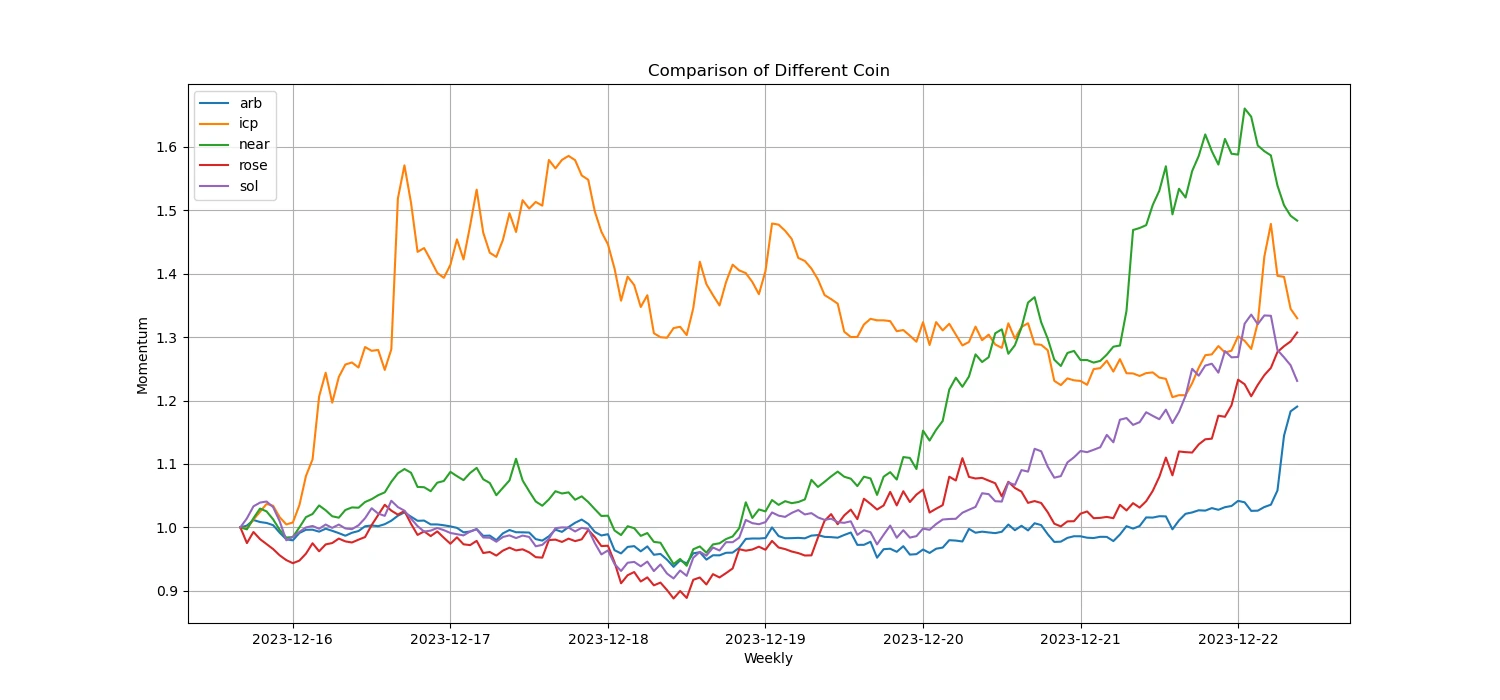
Hot coins with big gains this week
Sentiment drives low-correlation small market capitalization coins to rise in rotation. ICP starts on Saturday, SOL/NEAR starts on Wednesday, ROSE starts on Thursday, and ARB rotates on Friday.
What is the small market capitalization and sector rotation effect in the bull market?
In a bull market, coins with small market capitalization tend to show higher growth potential and return rates, making them more susceptible to the attention and pursuit of market funds. Investors generally believe that coins with smaller market capitalization have more room to grow and may achieve higher growth in a shorter period of time.
Secondly, sector rotation refers to the rotational changes in popularity between different industries or sectors in a bull market. Coins in different sectors will show different growth trends in different time periods. This is because different sectors are affected by factors such as emotional factors and sector prosperity, which have caused changes in investors attention and investment enthusiasm for different sectors.
The logic of sector rotation is to find hot areas in the market, buy before they rise, then sell after they reach a high point, and then look for the next potential hot sector. This strategy aims to pursue a higher rate of return. Investors can predict the next possible sector rotation direction by observing hot sectors in the market, tracking public opinion data, understanding capital flows and other factors, and make corresponding investment adjustments and risk management.
It should be noted that there are certain risks in small-capitalization coins and sector rotation in the bull market. Small market capitalization currencies may have higher volatility and liquidity risks, and investors need to carefully evaluate and manage risks. At the same time, sector rotation requires accurate market judgment and timing, so strategy developers need to have certain market analysis and investment experience.
Bitcoin halving is about 116 days away from today (2023.12.22)
Countdown to halving:https://www.nicehash.com/countdown/btc-halving-2024-05-10-12-00?_360safeparam=1289146171
Market technical and emotional environment analysis
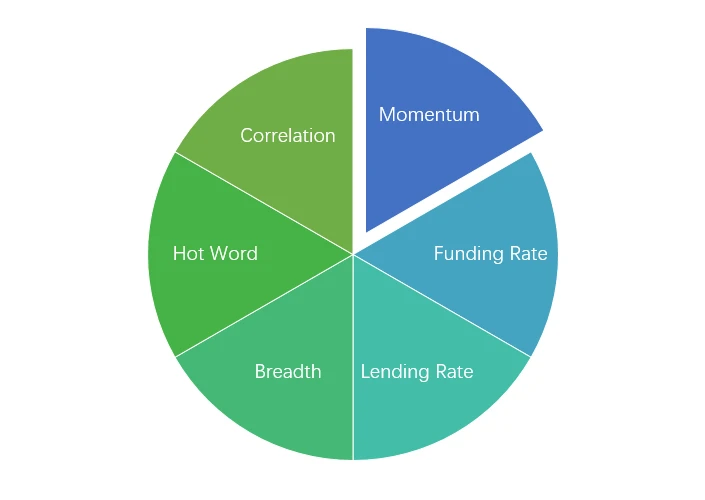
Sentiment analysis components
Technical indicators
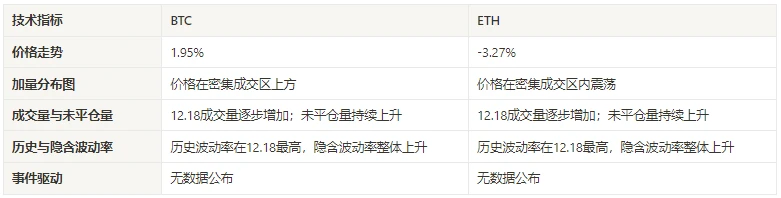
Price trend
The price of BTC increased by 1.95% over the past week, while the price of ETH fell by -3.27%.
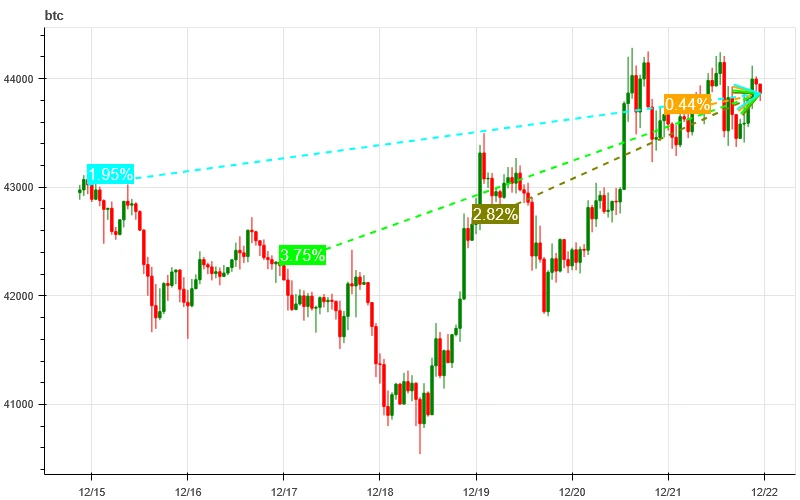
The picture above is the price chart of BTC over the past week
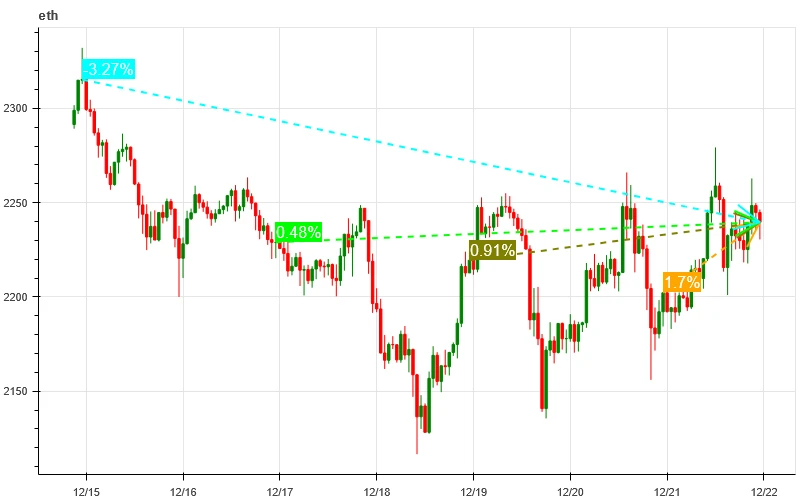
The picture above is the price chart of ETH over the past week

Table showing the rate of price change over the past week
Price and volume distribution chart (support and resistance)
Over the past week, BTC prices have been above a dense trading zone and ETH prices have been within a dense trading zone.
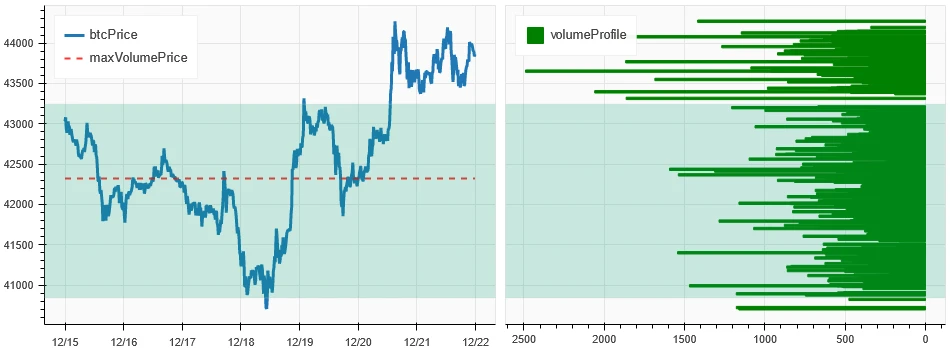
The picture above is the distribution map of BTC’s intensive trading areas in the past week.
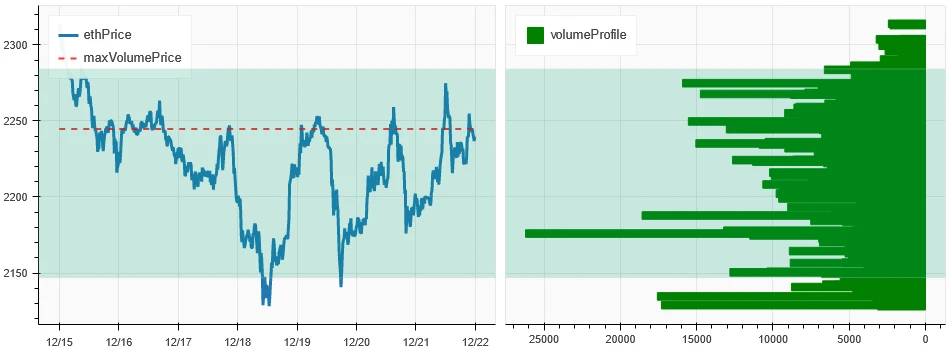
The picture above is the distribution map of ETH’s intensive trading areas in the past week.
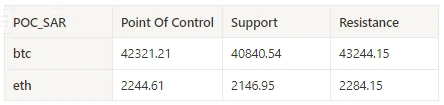
Table showing the intensive weekly trading ranges for BTC and ETH over the past week
Volume and Open Interest
Both BTC and ETH started rising over the past week after 12.18; open interest continues to rise.
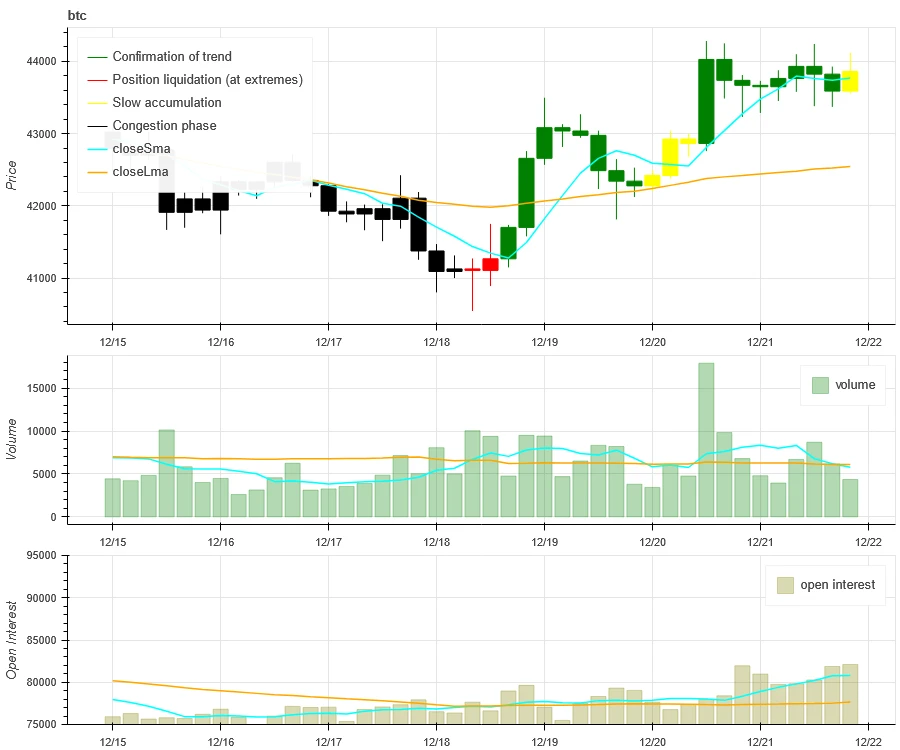
The price trend of BTC at the top of the picture above, the middle is the trading volume, the bottom is the open interest, the light blue is the 1-day average, and the orange is the 7-day average. The color of the K line represents the current status. Green means that the price rise is supported by trading volume, red means positions are being closed, yellow means positions are slowly accumulating, and black means congestion.
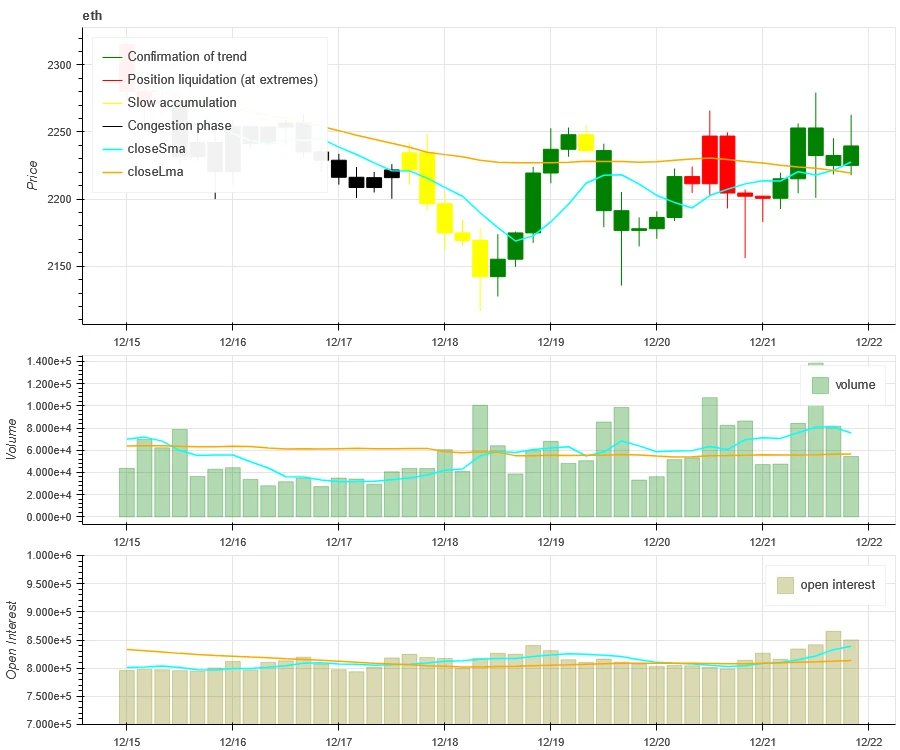
The price trend of ETH at the top of the picture above, the middle is the trading volume, the bottom is the open interest, the light blue is the 1-day average, and the orange is the 7-day average. The color of the K line represents the current status. Green means that the price rise is supported by trading volume, red means positions are being closed, yellow means positions are slowly accumulating, and black means congestion.
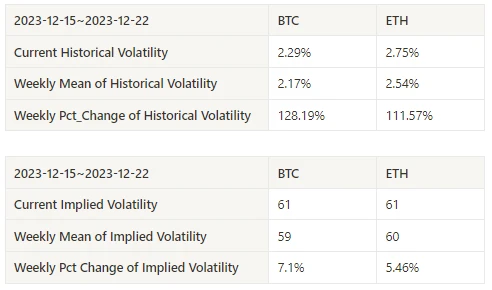
Historical Volatility vs. Implied Volatility
The historical volatility of BTC and ETH in the past week was the highest at 12.18, and the implied volatility increased overall.
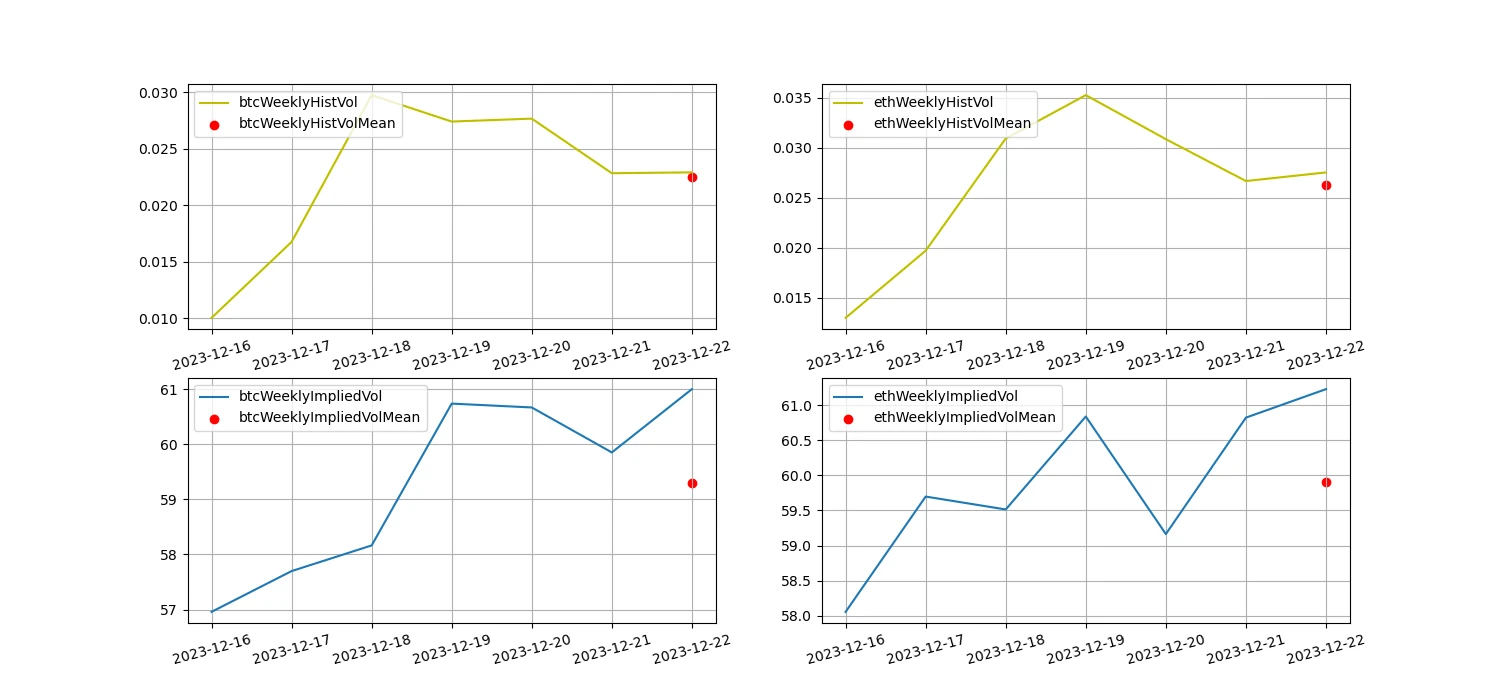
The yellow line is historical volatility, the blue line is implied volatility, and the red dot is its 7-day average
event driven
No data is released this week.
sentiment indicator
momentum sentiment
Among Bitcoin/Gold/Nasdaq/HSI/CSI 300 in the past week, Bitcoin was the strongest, while the Hang Seng Index performed the worst.
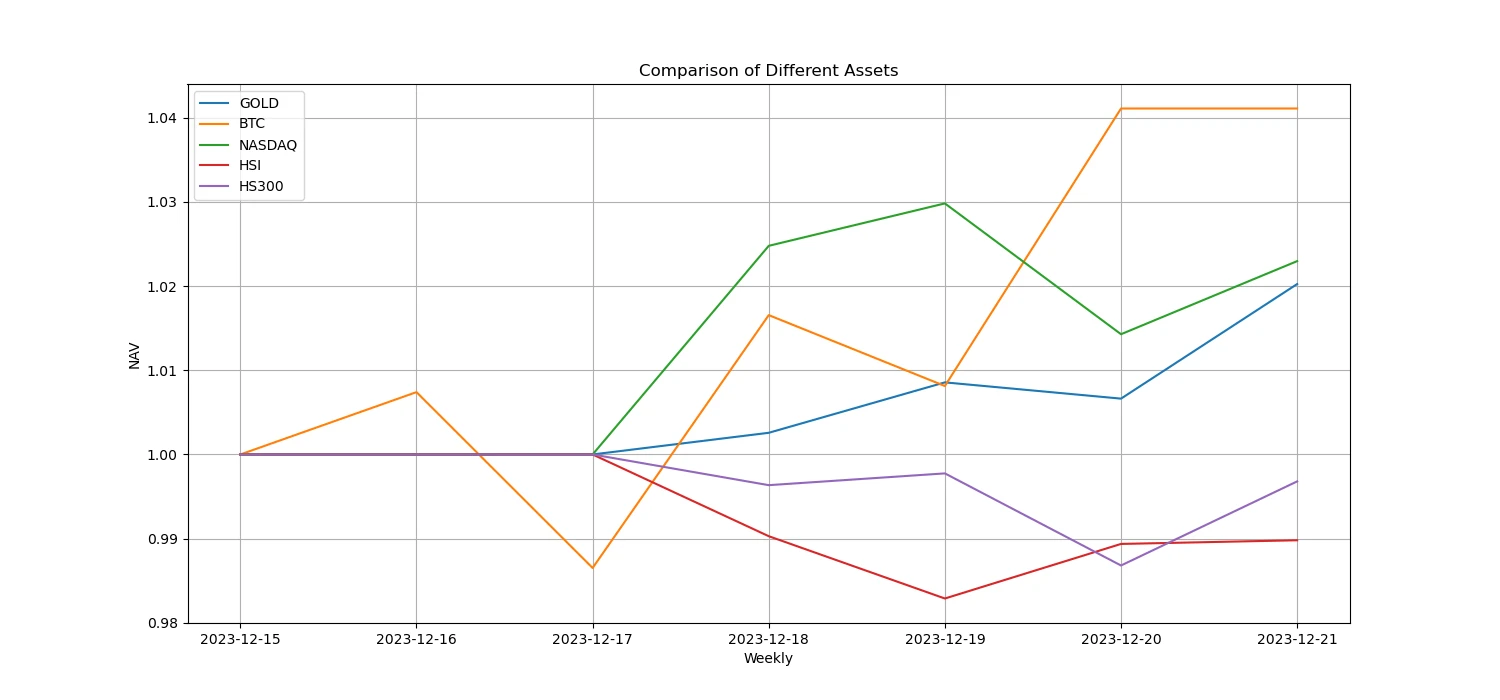
The picture above shows the trends of different assets over the past week.
Lending interest rate_Lending sentiment
The annualized return on USD lending has averaged 13% over the past week, and interest rates continue to fall.
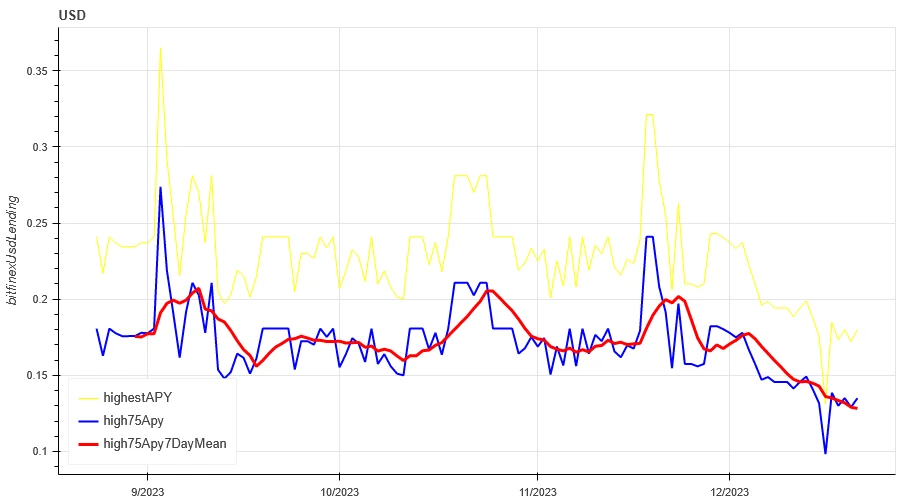
The yellow line is the highest price of the USD interest rate, the blue line is 75% of the highest price, and the red line is the 7-day average of 75% of the highest price
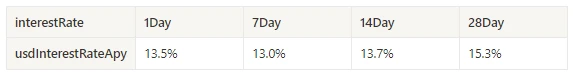
The table shows the average return of USD interest rate for different holding days in the past
Funding Rate_Contract Leverage Sentiment
The average annualized return on BTC rates over the past week was 14.9%, and contract leverage sentiment was high on the latest day.
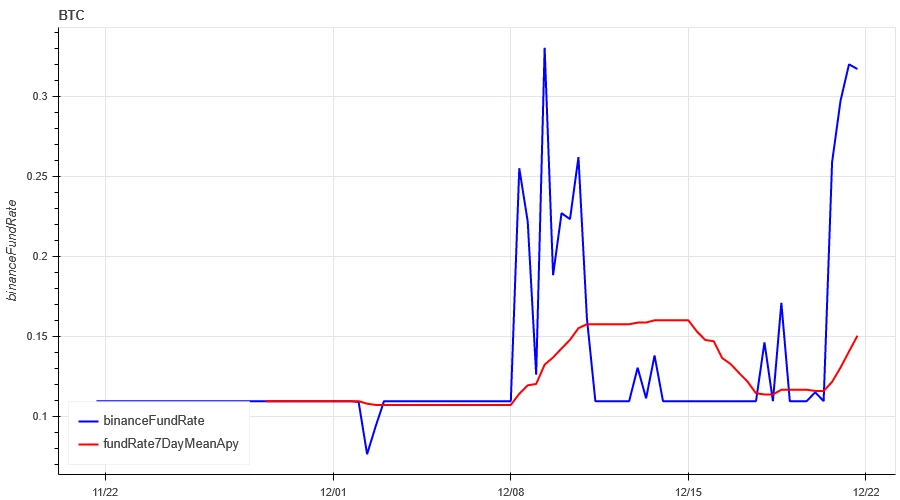
The blue line is the funding rate of BTC on Binance, and the red line is its 7-day average. The table shows the average return of BTC rates for different holding days in the past.
Market Breadth_Overall Sentiment
30% of the 129 coins selected in the past week were above the 30-day moving average. The new coins are all tradable contracts. Last week, a large number of coins fell below the 30-day moving average.
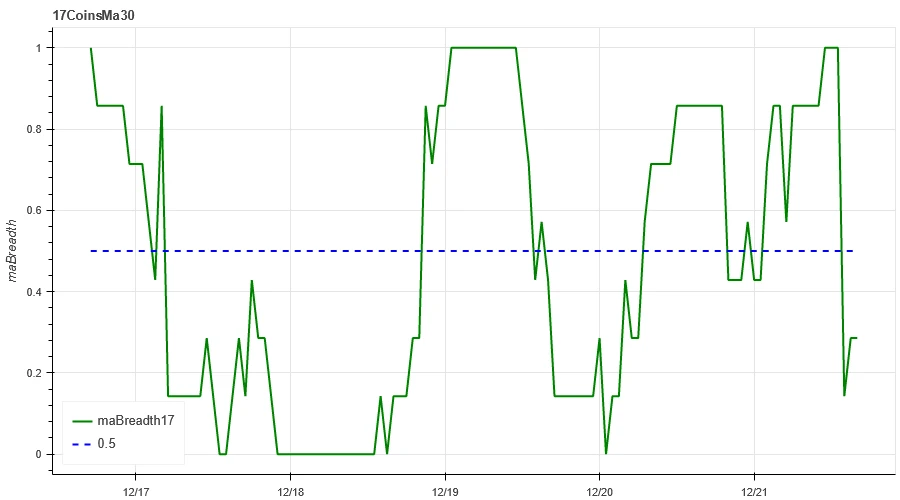
The picture above is [ 1000 floki, 1000 lunc, 1000 pepe, 1000 shib, 100 0x ec, 1inch, aave, ada, agix, algo, ankr, ant, ape, apt, arb, ar, astr, atom, audio, avax, axs, bal, band , bat, bch, bigtime, blur, bnb, btc, celo, cfx, chz, ckb, comp, crv, cvx, cyber, dash, dgb, doge, dot, dydx, egld, enj, ens, eos,etc, eth , fet, fil, flow, ftm, fxs, gala, gmt, gmx, grt, hbar, hot, icp, icx, imx, inj, iost, iotx, jasmy, kava, klay, ksm, ldo, link, loom, lpt , lqty, lrc, ltc, luna 2 , magic, mana, matic, meme, mina, mkr, near, neo , ocean, one, ont, op, pendle, qnt, qtum, rndr, rose, rune, rvn, sand, sei, sfp, skl, snx, sol, ssv, stg, storj, stx, sui, sushi, sxp, theta , tia, trx, t, uma, uni, vet, waves, wld, woo, xem, xlm, xmr, xrp, xtz, yfi, zec, zen, zil, zrx] proportion above the 30-day moving average
Market Correlation_Consistent Sentiment
Among the 126 coins selected in the past week, the correlation dropped to around 0.47, resulting in divergent prices among different varieties.
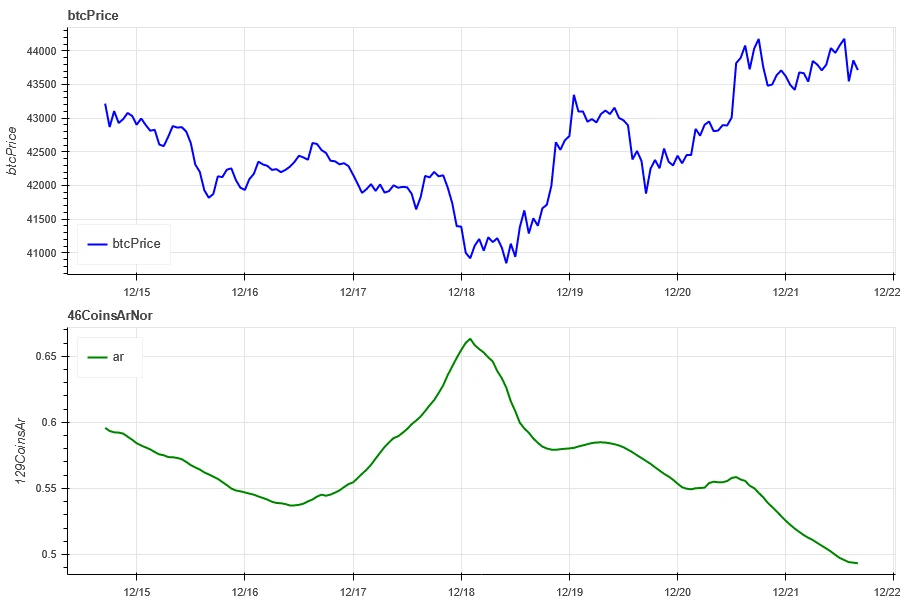
The blue line in the above picture first shows the Bitcoin price, and the green line is [ 1000 floki, 1000 lunc, 1000 pepe, 1000 shib, 100 0x ec, 1inch, aave, ada , agix, algo, ankr, ant, ape, apt, arb, ar, astr, atom, audio, avax, axs, bal, band, bat, bch, bigtime, blur, bnb, btc, celo, cfx, chz, ckb , comp, crv, cvx, cyber, dash, dgb, doge, dot, dydx, egld, enj, ens, eos,etc, eth, fet, fil, flow, ftm, fxs, gala, gmt, gmx, grt, hbar , hot, icp, icx, imx, inj, iost, iotx, jasmy, kava, klay, ksm, ldo, link, loom, lpt, lqty, lrc, ltc, luna 2 , magic, mana, matic, meme, mina, mkr, near, neo, ocean, one, ont, op, pendle, qnt, qtum, rndr, rose, rune , rvn, sand, sei, sfp, skl, snx, sol, ssv, stg, storj, stx, sui, sushi, sxp, theta, tia, trx, t, uma, uni, vet, waves, wld, woo, xem , xlm, xmr, xrp, xtz, yfi, zec, zen, zil, zrx] overall correlation
Market Hotspots_Social Media Sentiment
The most popular items in the past week were sol/algo/near/dot/rose, and the rise in sentiment was also accompanied by a larger increase.
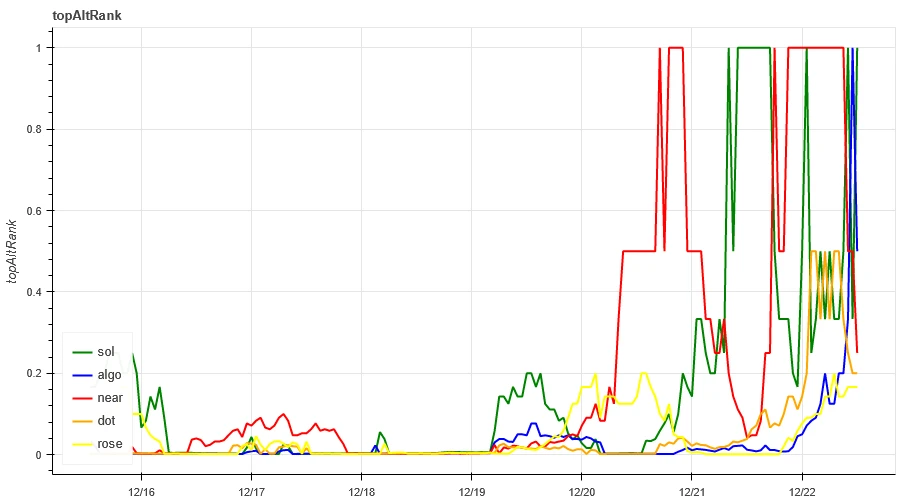
Data Sources:https://lunarcrush.com/categories/cryptocurrencies
Summarize
The market price of BTC increased slightly this week, while ETH fluctuated and fell. The implied volatility increased compared with last week. The width indicator added 129 contract types that can be traded by Binance. The data shows that this week more small-market coins fell to Below the 30-day moving average; in terms of hot spots, sol/algo/near/dot/rose has been relatively high recently, and prices have risen sharply; in terms of events, we are waiting for the Federal Reserve interest rate meeting next month. Thanks to the small coin hotspot tracking strategy, the follow-up strategy has gained 11.5% in the past 7 days and 14% in the past 30 days.
Binance CopyTrading: CTA_ChannelCMT
Twitter: @DerivativesCN
Website: https://dcbot.ai/


