


Bitcoin surges! Short positions hit record high, market sentiment is high
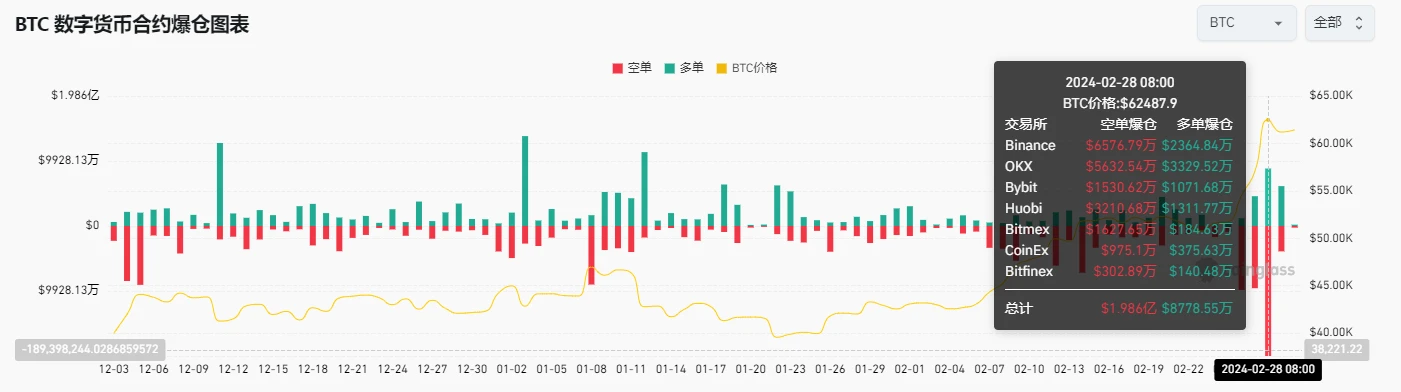
Data Sources:https://www.coinglass.com/zh/LiquidationData
Bitcoin quickly broke through the key resistance of $53,000 starting on the 26th, rising sharply for three consecutive days, hitting a maximum of $64,300. Due to the rapid rise in this short period of time, the total short position liquidation in three days has reached 390 million U.S. dollars, which has provided support for the subsequent rise, making it no longer far away from the previous high resistance price of 69,000 U.S. dollars.
With sentiment and prices so high right now, can I still participate in investing?
In the current market, prices have risen significantly, and indeed many early investors have received handsome returns. This makes the return-to-risk ratio of participating investments relatively low. However, investment decisions should be based on a comprehensive consideration of the current market environment and future expectations.
First, Bitcoin’s ETFs (exchange-traded funds) have driven an increase in trading volume across the entire crypto market, making it easier for more institutions and individuals to participate in cryptocurrency investments. As more money floods into the market, more investment opportunities may become available.
Secondly, AI-related cryptocurrencies are very popular and their prices continue to rise. The rapid development and widespread application of artificial intelligence technology has brought huge potential to the cryptocurrency field. Investors are optimistic about its future growth and application prospects.
Third, many quantitative investment strategies have performed well as implied volatility rises and sentiment runs high. Increased market volatility provides investors with more opportunities, and quantitative strategies can better adapt to market changes and obtain returns.
To sum up, although many investors have made huge profits in the current market, there are still many investment opportunities. It is important to rationally analyze and predict the current environment and future trends, formulate your own investment strategies, and participate in investments under the premise that risks are controllable.
Bitcoin halving is about 51 days away from today (2024.03.01)
Countdown to halving:https://www.nicehash.com/countdown/btc-halving-2024-05-10-12-00?_360safeparam=1289146171
Market technical and emotional environment analysis
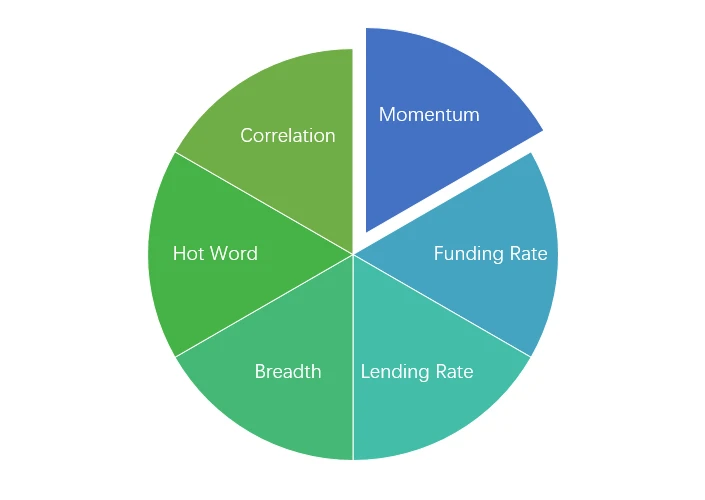
Sentiment analysis components
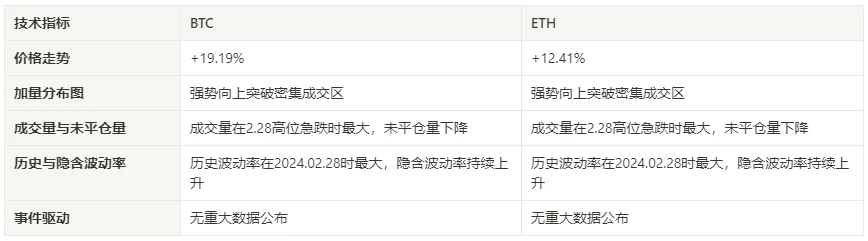
Technical indicators
Price trend
BTC price increased by 19.19% and ETH price increased by 12.41% in the past week.
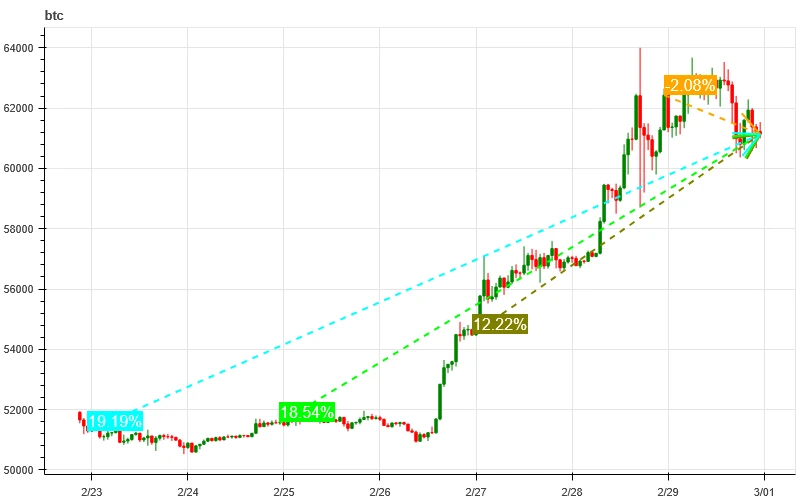
The picture above is the price chart of BTC over the past week
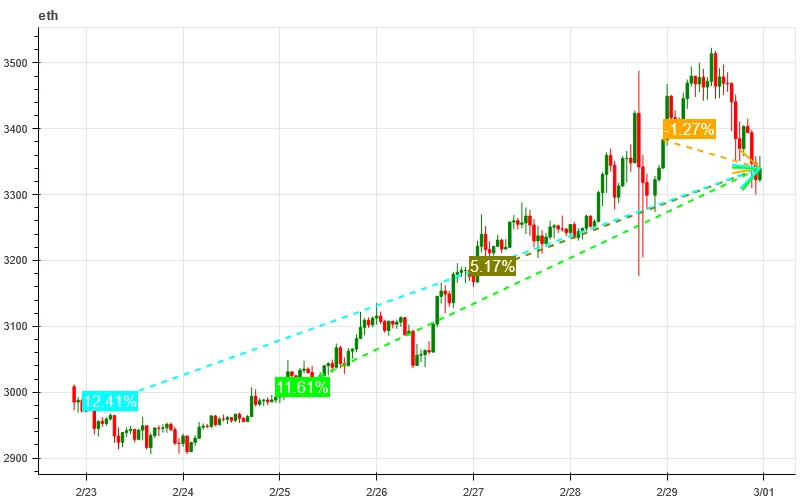
The picture above is the price chart of ETH over the past week
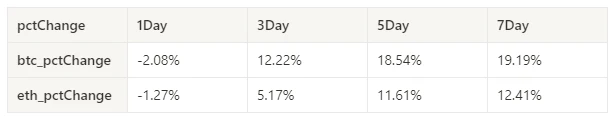
Table showing the rate of price change over the past week
Price and volume distribution chart (support and resistance)
In the past week, the prices of BTC and ETH both broke through the intensive trading area strongly upward.
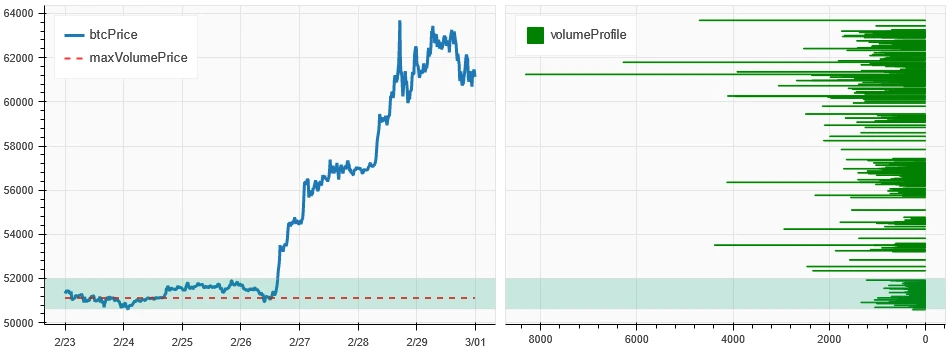
The picture above is the distribution map of BTC’s intensive trading areas in the past week.
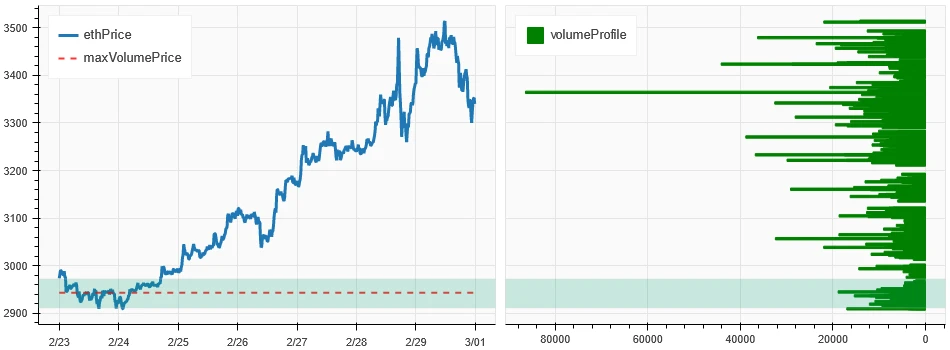
The picture above is the distribution map of ETH’s intensive trading areas in the past week.
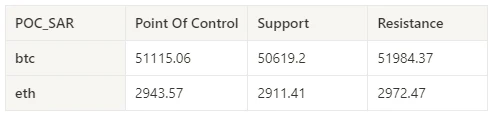
Table showing the intensive weekly trading ranges for BTC and ETH over the past week
Volume and Open Interest
The trading volume of BTC and ETH in the past week was the largest when it fell sharply from the high of 2.28; the open interest of both BTC and ETH fell.
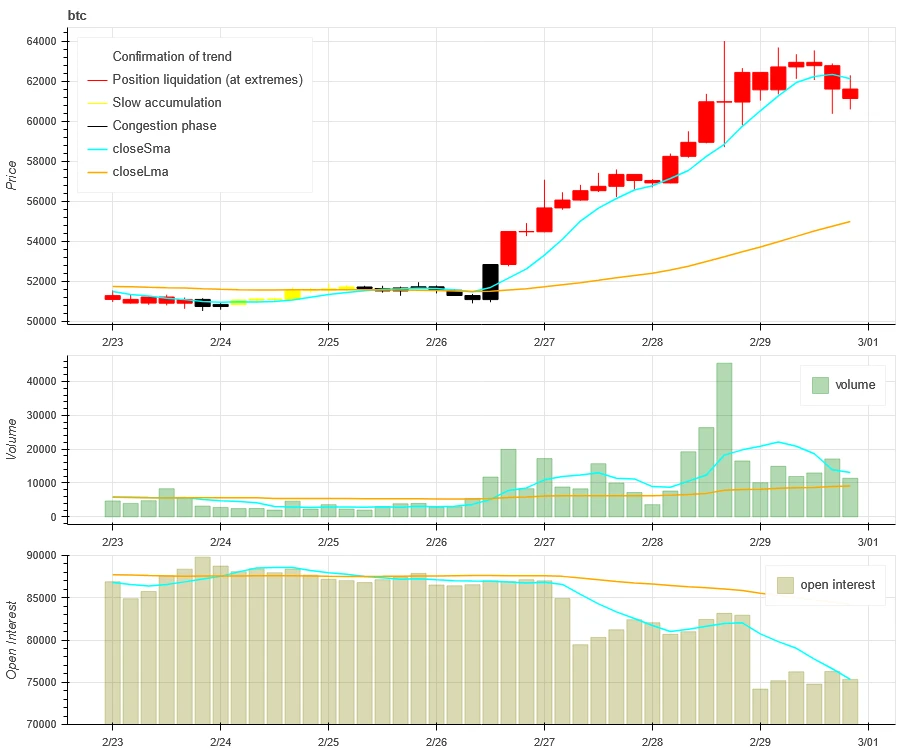
The price trend of BTC at the top of the picture above, the middle is the trading volume, the bottom is the open interest, the light blue is the 1-day average, and the orange is the 7-day average. The color of the K line represents the current status. Green means that the price rise is supported by trading volume, red means positions are being closed, yellow means positions are slowly accumulating, and black means congestion.
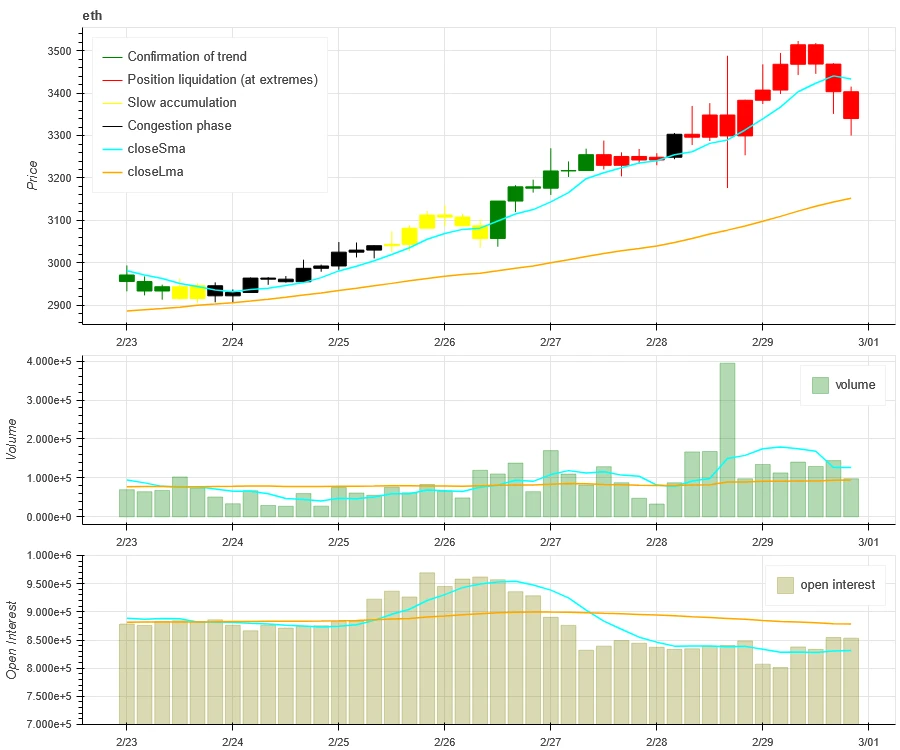
The price trend of ETH at the top of the picture above, the middle is the trading volume, the bottom is the open interest, the light blue is the 1-day average, and the orange is the 7-day average. The color of the K line represents the current status. Green means that the price rise is supported by trading volume, red means positions are being closed, yellow means positions are slowly accumulating, and black means congestion.
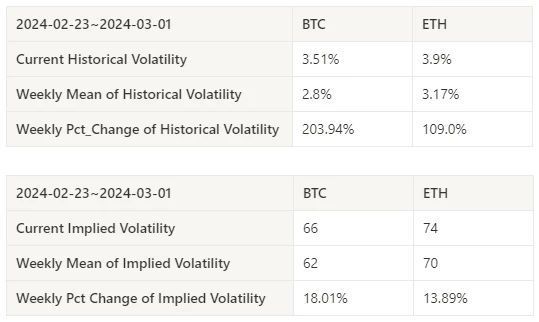
Historical Volatility vs. Implied Volatility
The historical volatility of BTC and ETH in the past week was the largest on 2024.02.28; the implied volatility of BTC and ETH continued to rise.
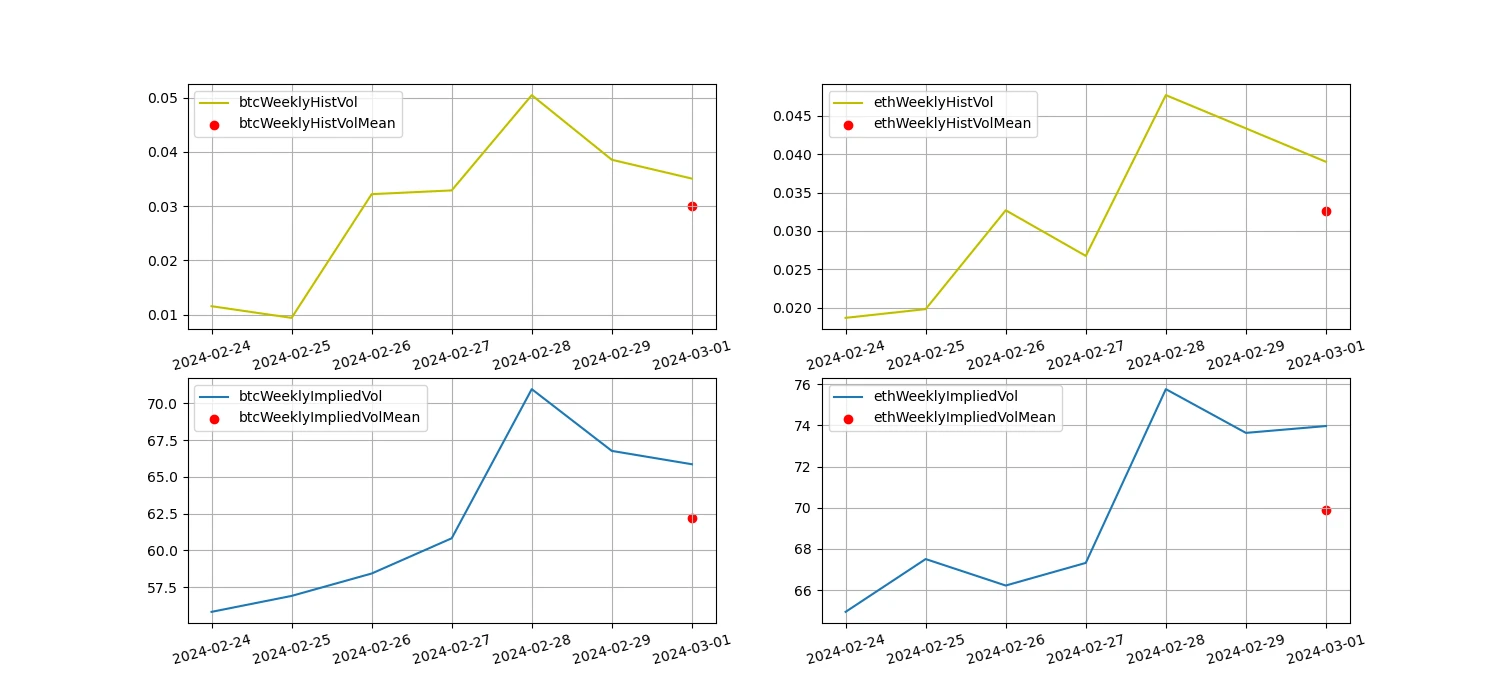
The yellow line is historical volatility, the blue line is implied volatility, and the red dot is its 7-day average
event driven
There is no event data this week.
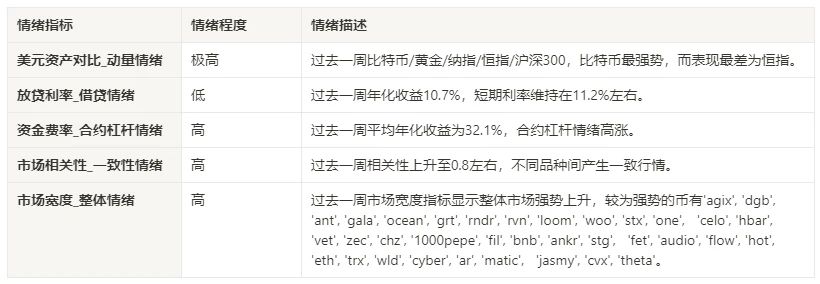
sentiment indicator
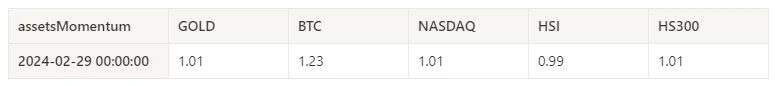
momentum sentiment
Among Bitcoin/Gold/Nasdaq/HSI/CSI 300 over the past week, Bitcoin was the strongest, while HSI was the worst performer.
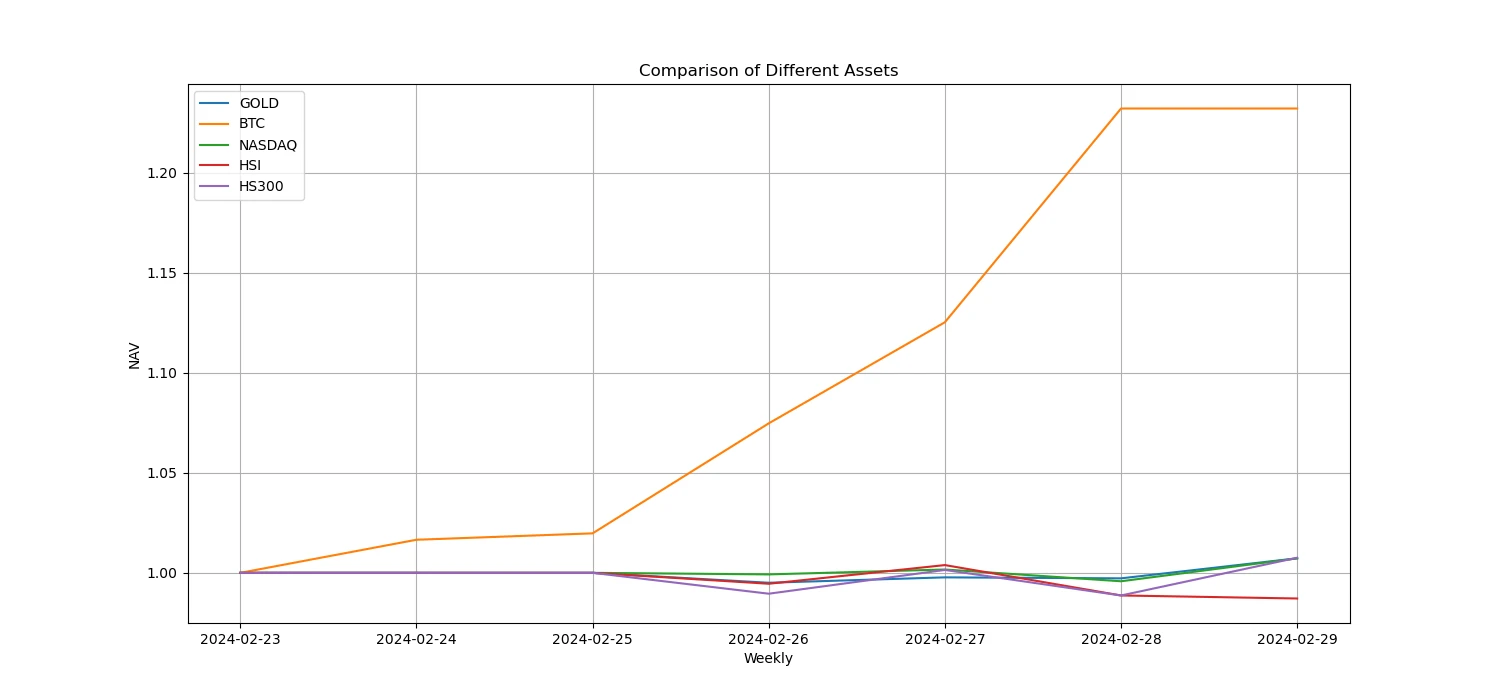
The picture above shows the trends of different assets over the past week.
Lending interest rate_Lending sentiment
The annualized return on USD lending averaged 10.7% in the past week, and short-term interest rates continued to fall to around 11.2%.
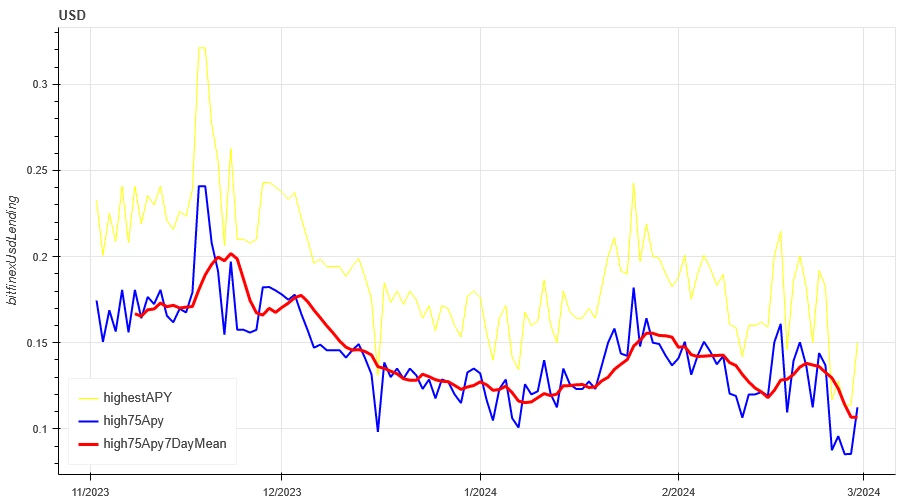
The yellow line is the highest price of the USD interest rate, the blue line is 75% of the highest price, and the red line is the 7-day average of 75% of the highest price
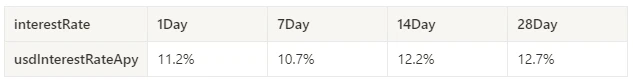
The table shows the average return of USD interest rate for different holding days in the past
Funding Rate_Contract Leverage Sentiment
The average annualized return on BTC rates over the past week was 31.2%, and contract leverage sentiment was high.
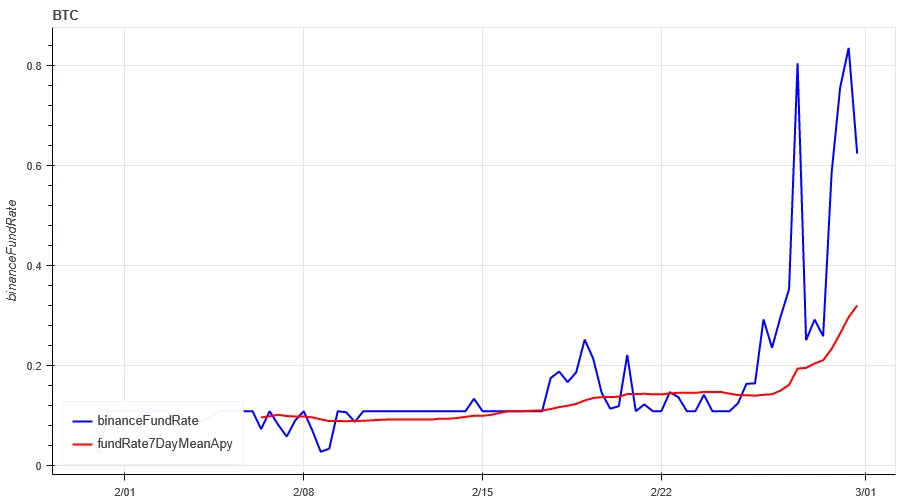
The blue line is the funding rate of BTC on Binance, and the red line is its 7-day average
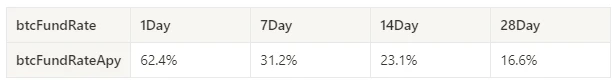
The table shows the average return of BTC fees for different holding days in the past
Market Correlation_Consistent Sentiment
The correlation among the 129 coins selected in the past week has increased to around 0.8, resulting in consistent prices among different varieties.
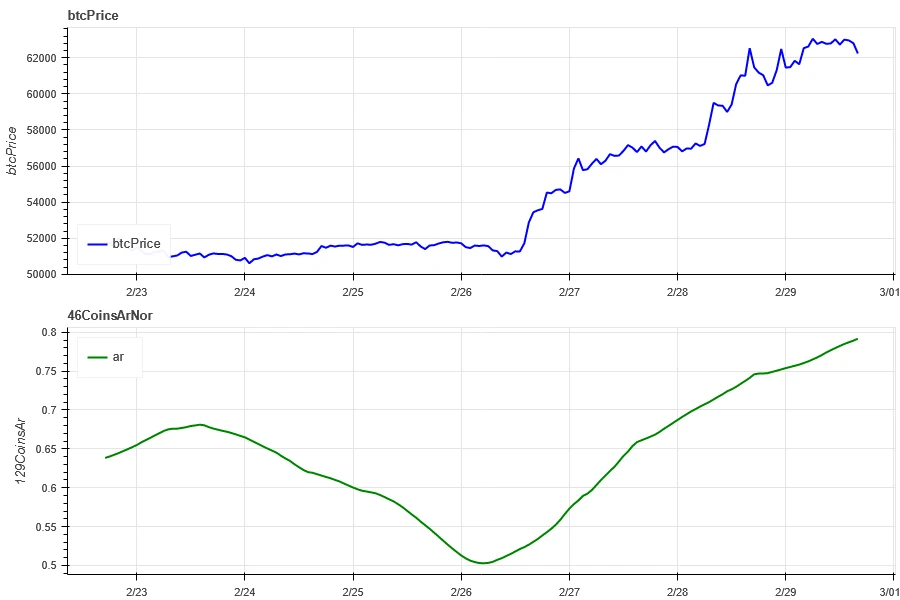
The blue line in the above picture first shows the Bitcoin price, and the green line is [1000 floki, 1000 lunc, 1000 pepe, 1000 shib, 100 0x ec, 1inch, aave, ada , agix, algo, ankr, ant, ape, apt, arb, ar, astr, atom, audio, avax, axs, bal, band, bat, bch, bigtime, blur, bnb, btc, celo, cfx, chz, ckb , comp, crv, cvx, cyber, dash, dgb, doge, dot, dydx, egld, enj, ens, eos,etc, eth, fet, fil, flow, ftm, fxs, gala, gmt, gmx, grt, hbar , hot, icp, icx, imx, inj, iost, iotx, jasmy, kava, klay, ksm, ldo, link, loom, lpt, lqty, lrc, ltc, luna 2, magic, mana, matic, meme, mina, mkr, near, neo, ocean, one, ont, op, pendle, qnt, qtum, rndr, rose, rune , rvn, sand, sei, sfp, skl, snx, sol, ssv, stg, storj, stx, sui, sushi, sxp, theta, tia, trx, t, uma, uni, vet, waves, wld, woo, xem , xlm, xmr, xrp, xtz, yfi, zec, zen, zil, zrx] overall correlation
Market Breadth_Overall Sentiment
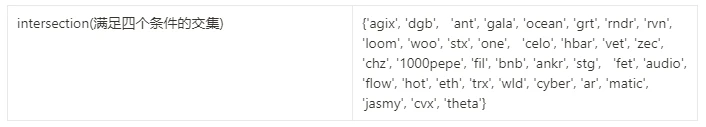
Of the 129 coins selected in the past week, 96% had prices above the 30-day moving average, compared to 32% of BTC prices above the 30-day moving average, and 82% had prices greater than 20% from the lowest price in the past 30 days. , 90% are less than 10% from the highest price in the past 30 days. The market width indicator in the past week shows that the overall market is in a strong rising stage. The stronger coins include agix, dgb, ant, gala , ocean, grt, rndr, rvn, loom, woo, stx, one, celo, hbar, vet, zec, chz, 1000 pepe, fil, bnb, ankr, stg, fet, audio, flow, hot, eth, trx, wld , cyber, ar, matic, jasmy, cvx, theta.
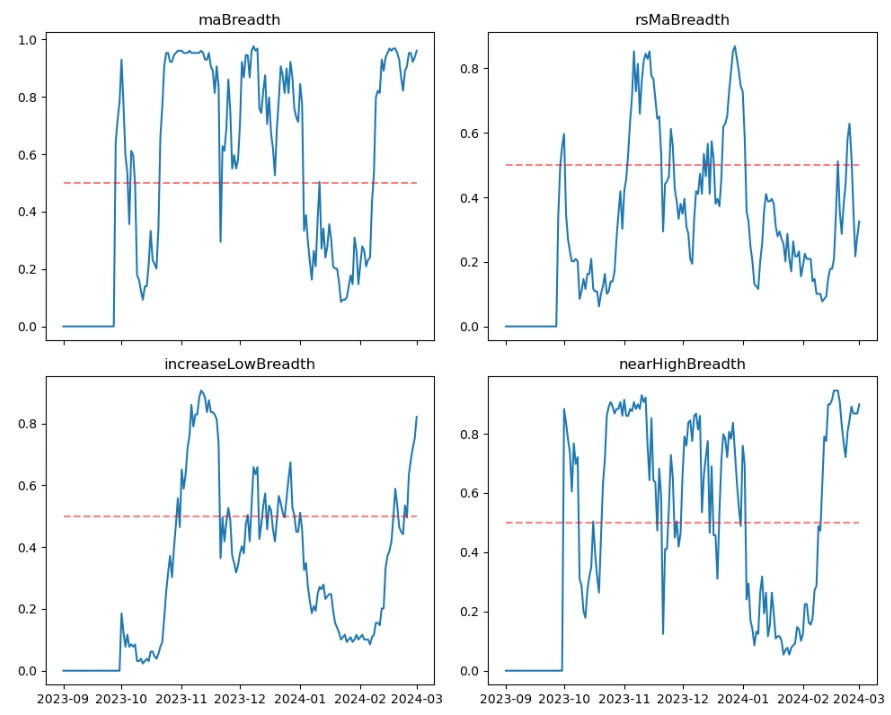
The picture above is [1000 floki, 1000 lunc, 1000 pepe, 1000 shib, 100 0x ec, 1inch, aave, ada, agix, algo, ankr, ant, ape, apt, arb, ar, astr, atom, audio, avax, axs, bal, band , bat, bch, bigtime, blur, bnb, btc, celo, cfx, chz, ckb, comp, crv, cvx, cyber, dash, dgb, doge, dot, dydx, egld, enj, ens, eos,etc, eth , fet, fil, flow, ftm, fxs, gala, gmt, gmx, grt, hbar, hot, icp, icx, imx, inj, iost, iotx, jasmy, kava, klay, ksm, ldo, link, loom, lpt , lqty, lrc, ltc, luna 2, magic, mana, matic, meme, mina, mkr, near, neo , ocean, one, ont, op, pendle, qnt, qtum, rndr, rose, rune, rvn, sand, sei, sfp, skl, snx, sol, ssv, stg, storj, stx, sui, sushi, sxp, theta , tia, trx, t, uma, uni, vet, waves, wld, woo, xem, xlm, xmr, xrp, xtz, yfi, zec, zen, zil, zrx] The proportion of each width indicator on the 30th day
Summarize
The prices of BTC and ETH have risen strongly this week. The historical volatility and trading volume were the largest on the 28th when prices soared and then fell sharply. The open interest of BTC and ETH both declined, while the implied volatility continued to rise. Mainstream currencies The upward trend is strong; funding rates have risen sharply, and contract trading sentiment is high; 129 Binance market width indicators show that the overall market is in a strong upward stage, and the stronger coins include {agix, dgb, ant, gala, ocean, grt, rndr, rvn, loom, woo, stx, one, celo, hbar, vet, zec , chz, 1000 pepe, fil, bnb, ankr, stg, fet, audio, flow, hot, eth, trx, wld, cyber, ar, matic, jasmy, cvx, theta}; In terms of events, there is no data released this week, waiting for next Fridays non-agricultural data.
Twitter: @DerivativesCN
Website: https://dcbot.ai/


