


FOMC rates unchanged, expected to cut interest rates three times in 2024
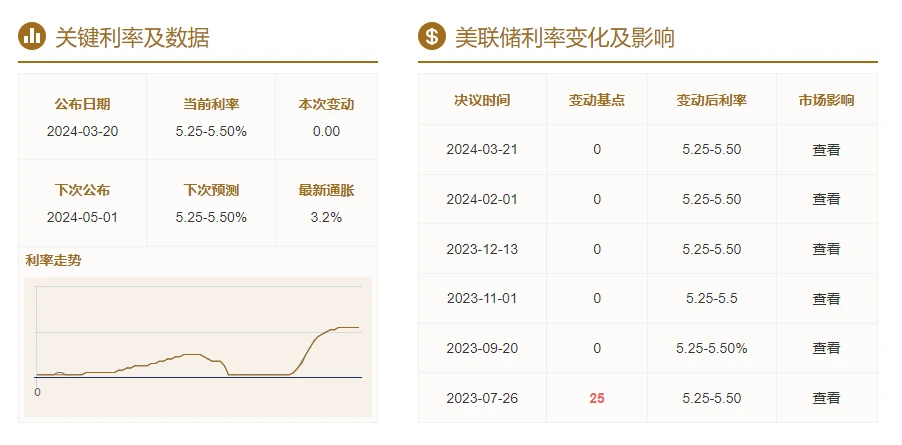
This weeks FOMC interest rate meeting started at 2024.3.21 00:00 (Beijing time). During the meeting, Bitcoin first had a downward amplitude, and then rebounded and rose. The Federal Reserve on Wednesday left interest rates unchanged after a five-month pause in raising interest rates, but forecast three rate cuts of 75 basis points each in 2024. At the same time, Federal Reserve Chairman Powell revealed that he would begin to slow down the pace of balance sheet reduction, but did not disclose a specific time frame, which aroused market attention. The U.S. dollar index and U.S. bond yields plummeted, while spot gold once hit a record high. Therefore, it will be positive for Bitcoin in the second half of 2024 from a macro level.
The Bitcoin halving is about 34 days away from today (2024.03.22)
Countdown to halving:https://www.nicehash.com/countdown/btc-halving-2024-05-10-12-00?_360safeparam=1289146171
Market technical and emotional environment analysis
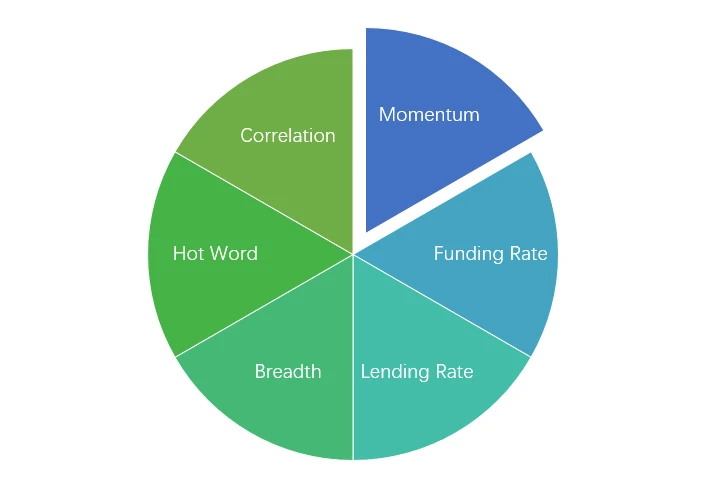
Sentiment analysis components
Technical indicators
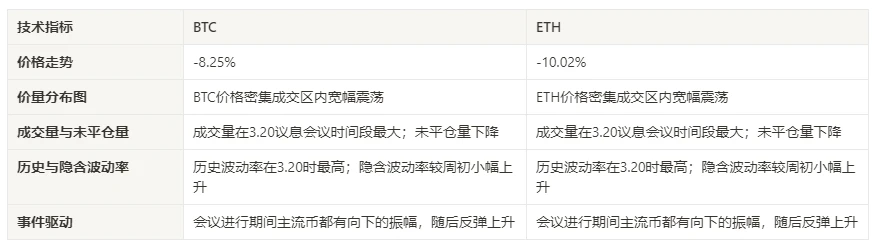
Price trend
BTC price fell by -8.25% and ETH price fell by -10.02% in the past week.
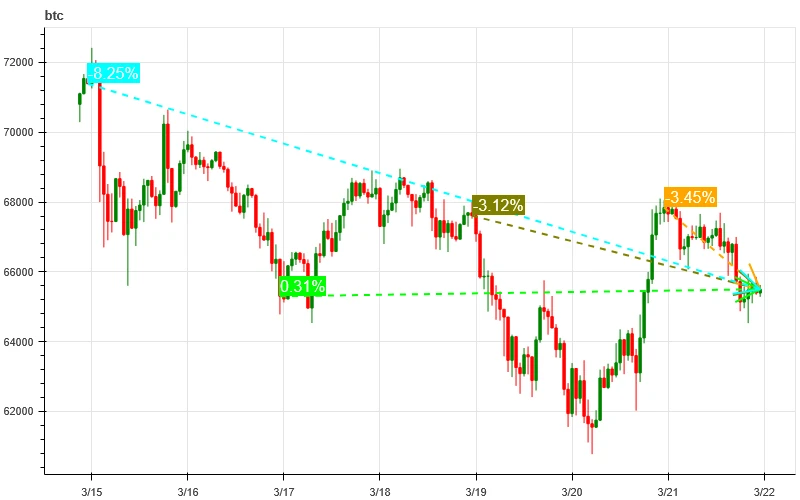
The picture above is the price chart of BTC over the past week
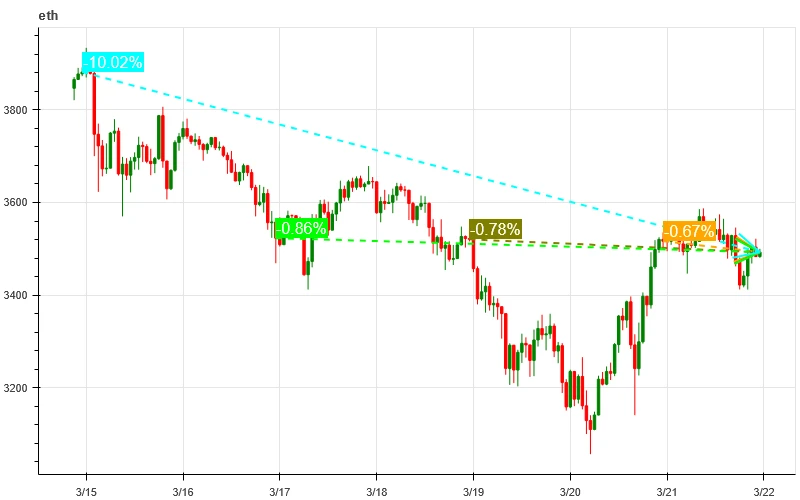
The picture above is the price chart of ETH over the past week
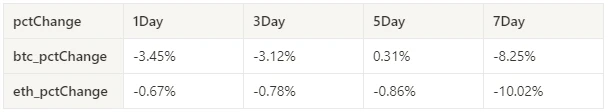
Table showing the rate of price change over the past week
Price and volume distribution chart (support and resistance)
In the past week, the prices of BTC and ETH have fluctuated widely in intensive trading areas.
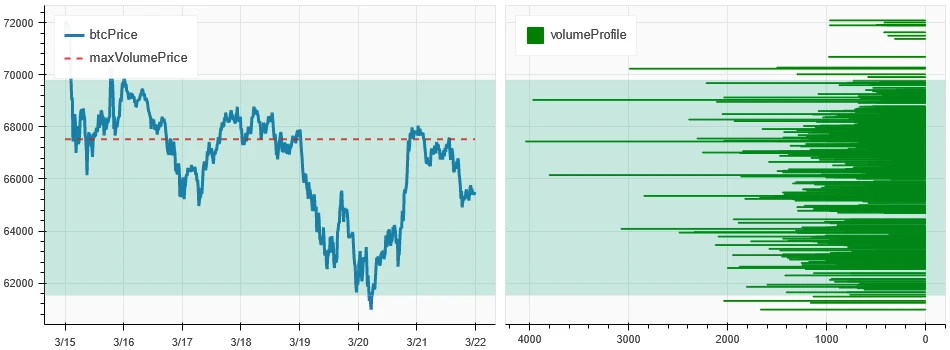
The picture above is the distribution map of BTC’s intensive trading areas in the past week.
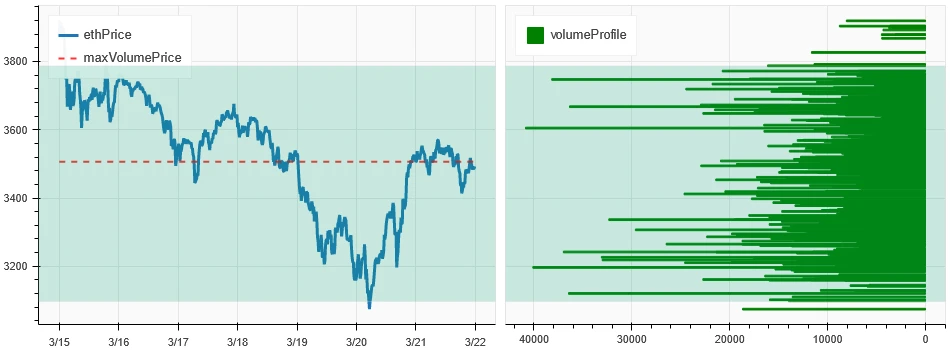
The picture above is the distribution map of ETH’s intensive trading areas in the past week.
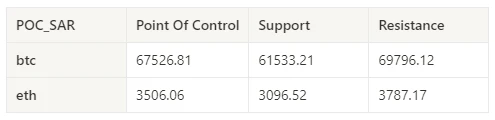
Table showing the intensive weekly trading ranges for BTC and ETH over the past week
Volume and Open Interest
In the past week, the trading volume of BTC and ETH was the largest during the 3.20 interest rate meeting; the open interest of both BTC and ETH decreased.
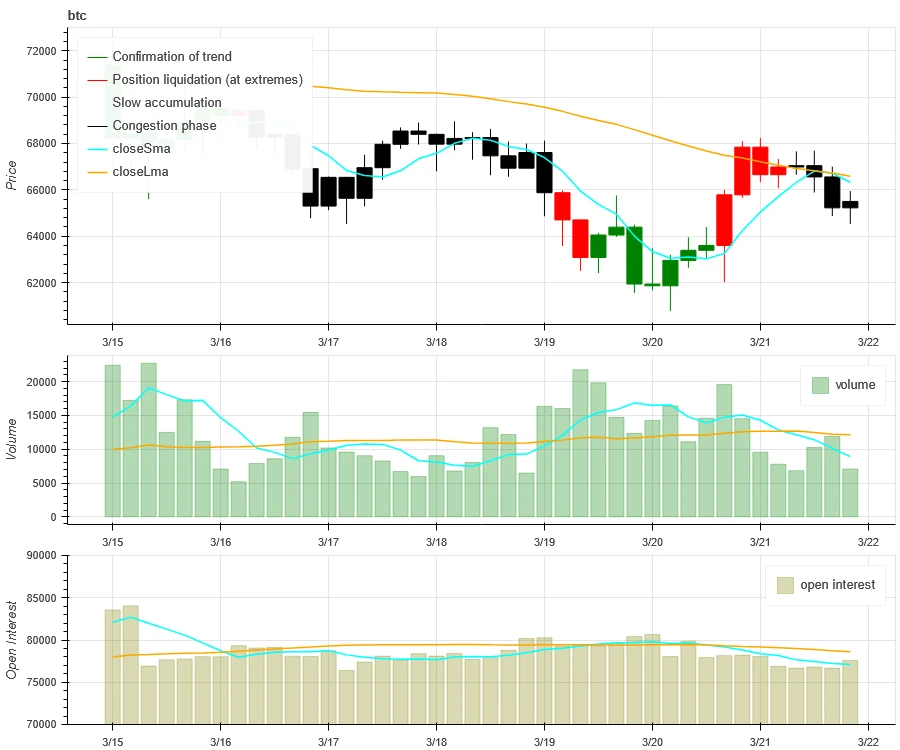
The price trend of BTC at the top of the picture above, the middle is the trading volume, the bottom is the open interest, the light blue is the 1-day average, and the orange is the 7-day average. The color of the K line represents the current status. Green means that the price rise is supported by trading volume, red means positions are being closed, yellow means positions are slowly accumulating, and black means congestion.
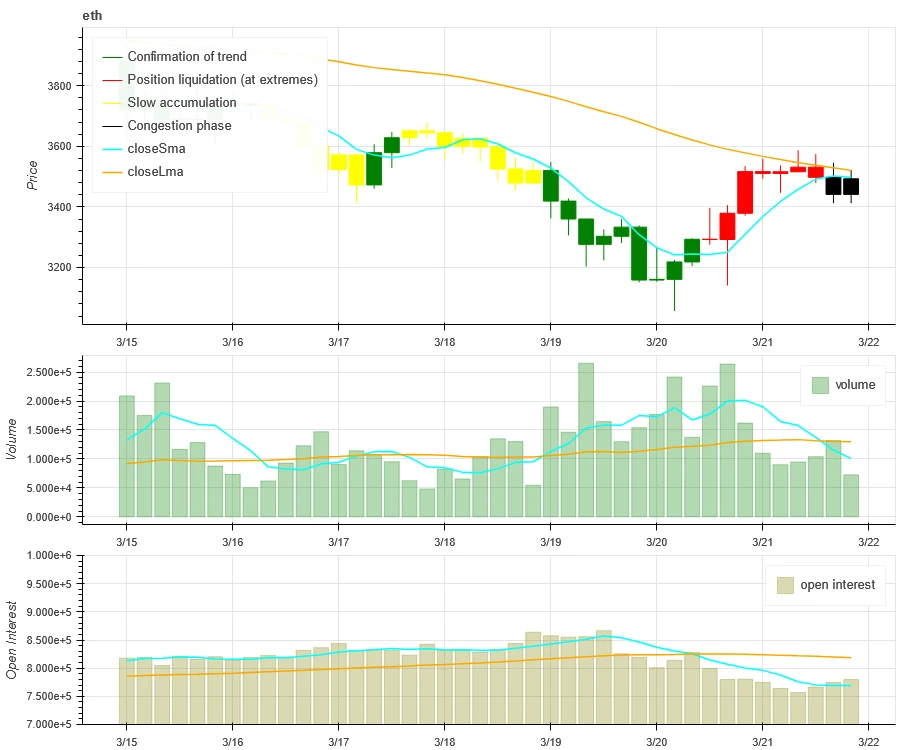
The price trend of ETH at the top of the picture above, the middle is the trading volume, the bottom is the open interest, the light blue is the 1-day average, and the orange is the 7-day average. The color of the K line represents the current status. Green means that the price rise is supported by trading volume, red means positions are being closed, yellow means positions are slowly accumulating, and black means congestion.
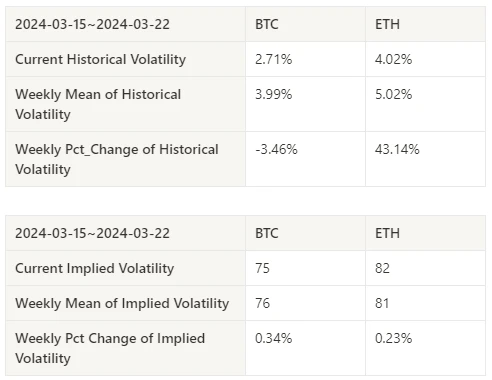
Historical Volatility vs. Implied Volatility
The historical volatility of BTC and ETH in the past week was the highest at 3.20; the implied volatility of BTC and ETH both increased slightly from the beginning of the week.
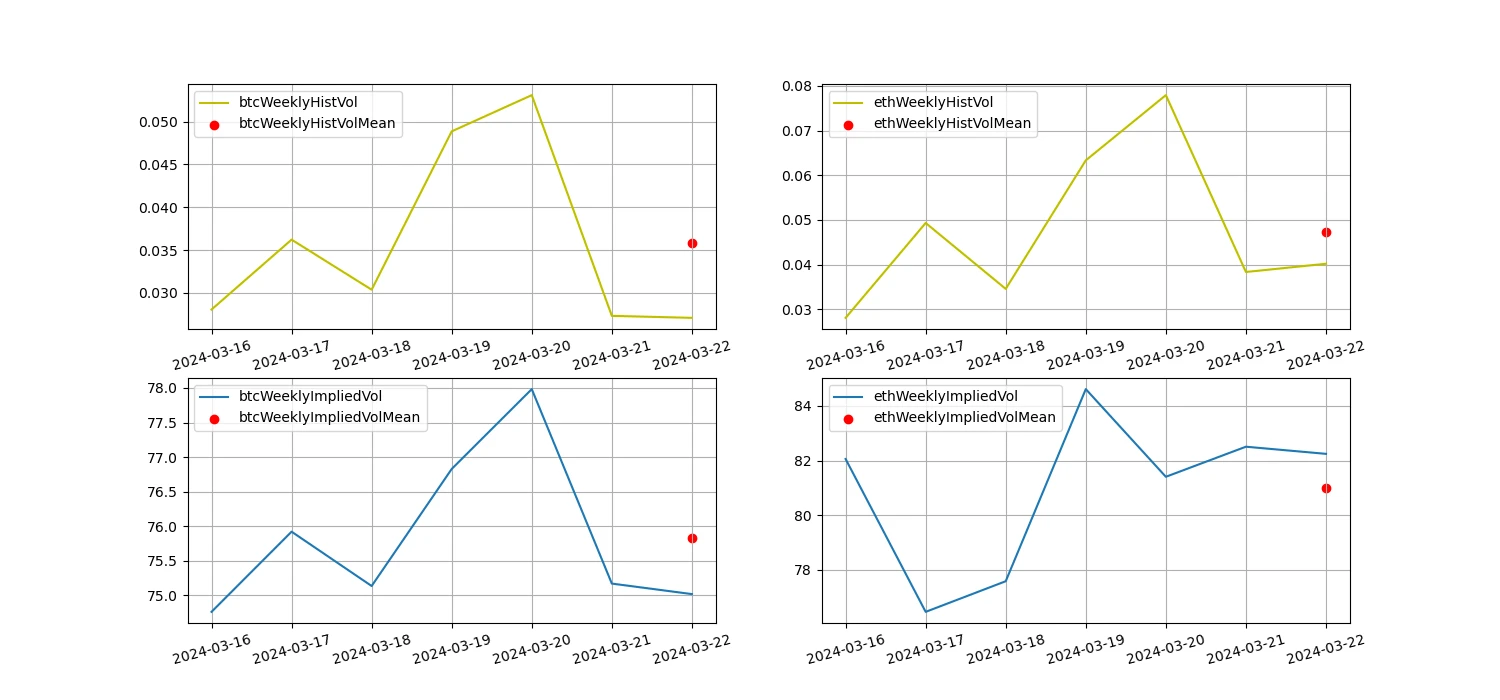
The yellow line is historical volatility, the blue line is implied volatility, and the red dot is its 7-day average
event driven
This weeks FOMC interest rate meeting started at 2024.3.21 00:00 (Beijing time). During the meeting, mainstream currencies had downward amplitudes, and then rebounded and rose.
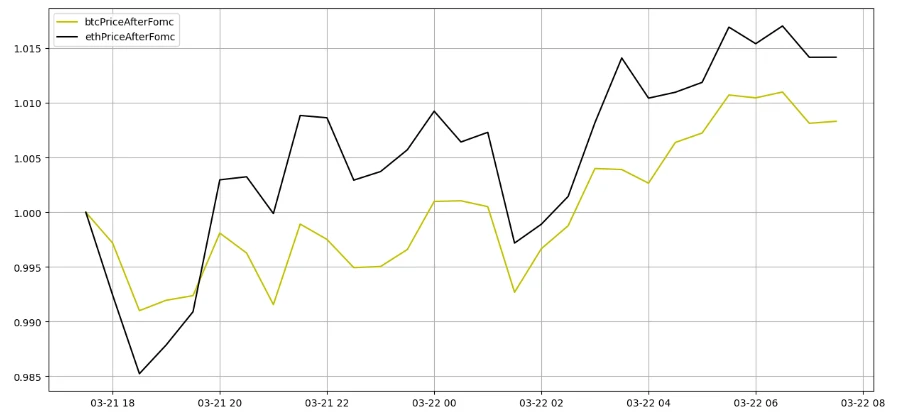
Price trend after the FOMC meeting, where the yellow line is Bitcoin and the black line is Ethereum
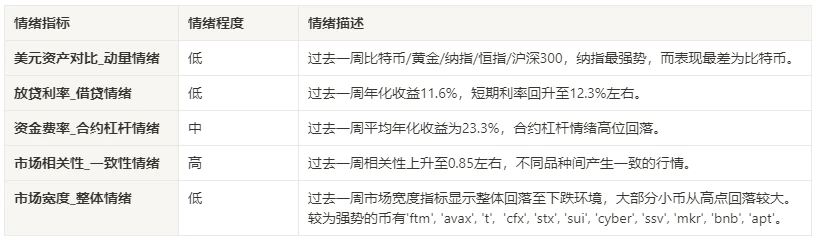
sentiment indicator
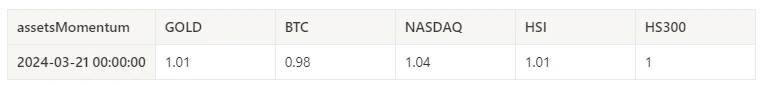
momentum sentiment
In the past week among Bitcoin/Gold/Nasdaq/HSI/CSI 300, Nasdaq was the strongest, while Bitcoin was the worst performer.
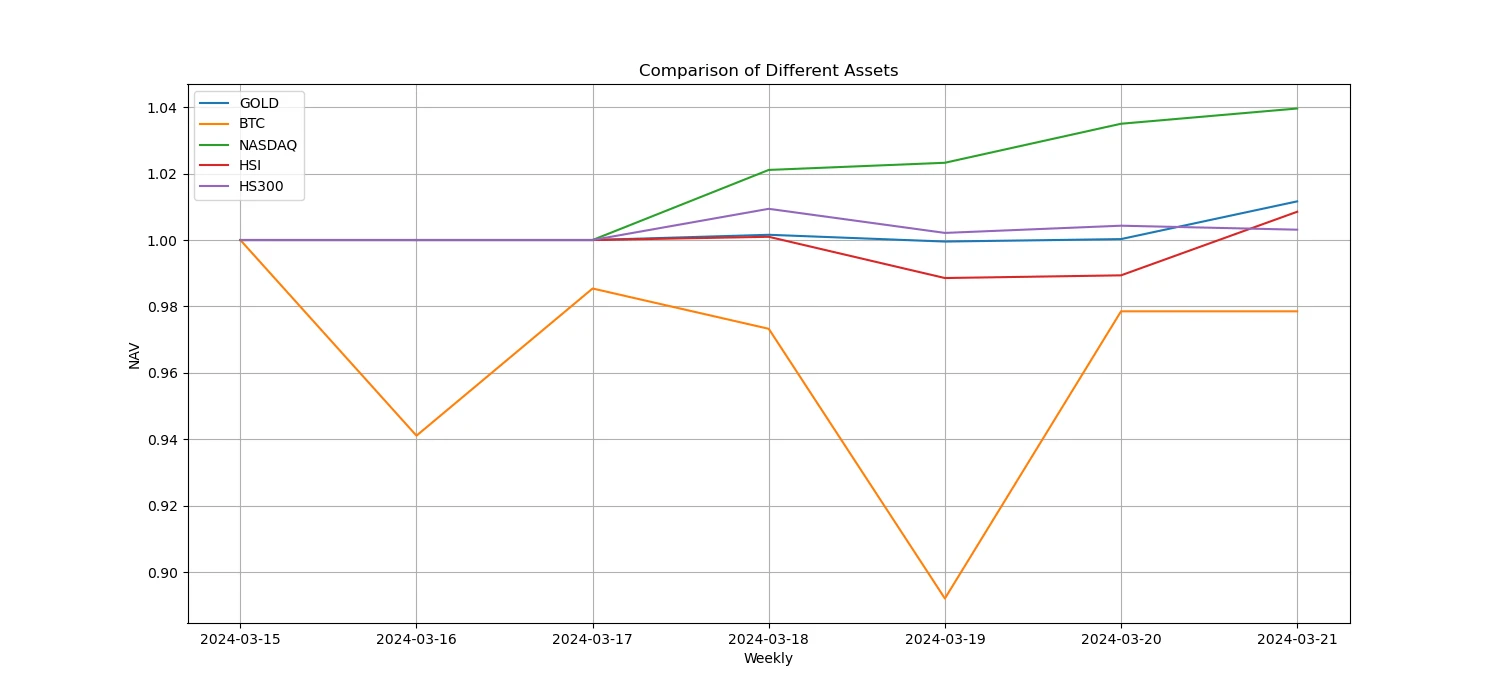
The picture above shows the trends of different assets over the past week.
Lending interest rate_Lending sentiment
The annualized return on USD lending averaged 11.6% in the past week, and short-term interest rates have rebounded to a low of around 12.3%.
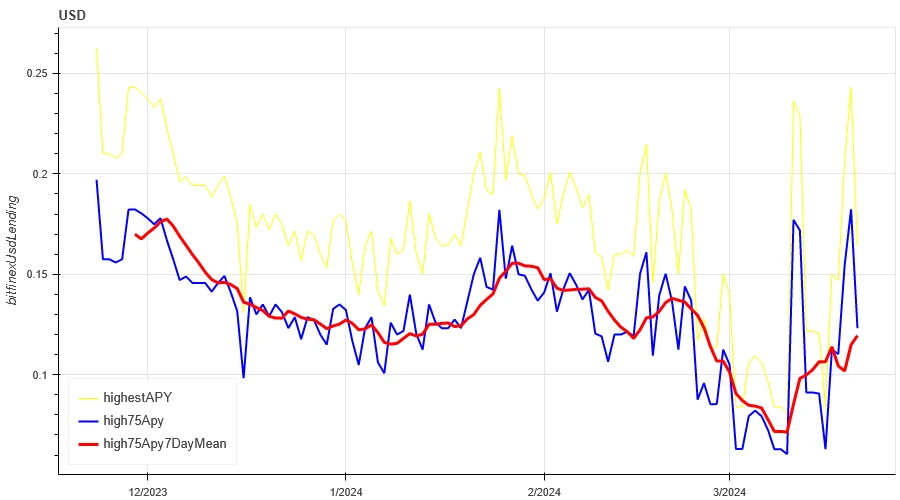
The yellow line is the highest price of the USD interest rate, the blue line is 75% of the highest price, and the red line is the 7-day average of 75% of the highest price
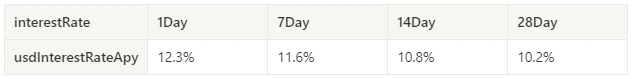
The table shows the average return of USD interest rate for different holding days in the past
Funding Rate_Contract Leverage Sentiment
The average annualized return on BTC tariffs in the past week was 23.3%, and contract leverage sentiment fell back from highs.
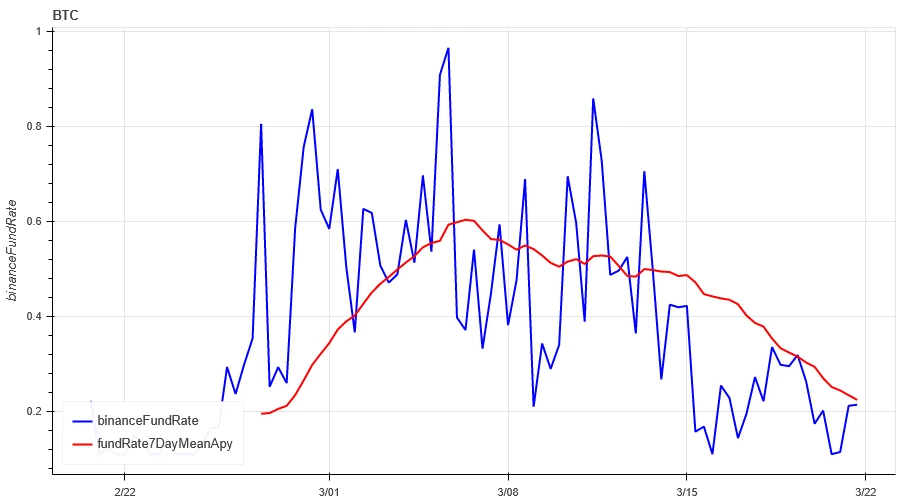
The blue line is the funding rate of BTC on Binance, and the red line is its 7-day average
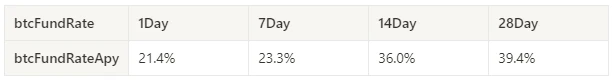
The table shows the average return of BTC fees for different holding days in the past
Market Correlation_Consistent Sentiment
Among the 129 coins selected in the past week, the correlation has increased to around 0.85, resulting in consistent prices among different varieties.
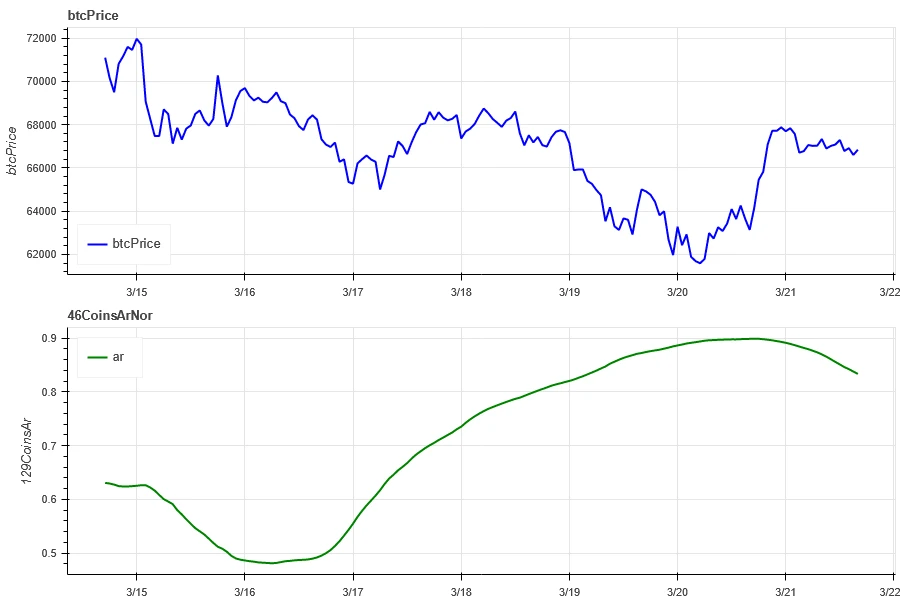
The blue line in the above picture first shows the Bitcoin price, and the green line is [1000 floki, 1000 lunc, 1000 pepe, 1000 shib, 100 0x ec, 1inch, aave, ada , agix, algo, ankr, ant, ape, apt, arb, ar, astr, atom, audio, avax, axs, bal, band, bat, bch, bigtime, blur, bnb, btc, celo, cfx, chz, ckb , comp, crv, cvx, cyber, dash, dgb, doge, dot, dydx, egld, enj, ens, eos,etc, eth, fet, fil, flow, ftm, fxs, gala, gmt, gmx, grt, hbar , hot, icp, icx, imx, inj, iost, iotx, jasmy, kava, klay, ksm, ldo, link, loom, lpt, lqty, lrc, ltc, luna 2, magic, mana, matic, meme, mina, mkr, near, neo, ocean, one, ont, op, pendle, qnt, qtum, rndr, rose, rune , rvn, sand, sei, sfp, skl, snx, sol, ssv, stg, storj, stx, sui, sushi, sxp, theta, tia, trx, t, uma, uni, vet, waves, wld, woo, xem , xlm, xmr, xrp, xtz, yfi, zec, zen, zil, zrx] overall correlation
Market Breadth_Overall Sentiment
Of the 129 coins selected in the past week, 39% had prices above the 30-day moving average, compared with 36% of BTC prices above the 30-day moving average, and 49% had prices greater than 20% from the lowest price in the past 30 days. , 10% are less than 10% from the highest price in the past 30 days. The market width indicator in the past week shows that the overall market has fallen back to a downward environment, and most small coins have fallen significantly from their highs.
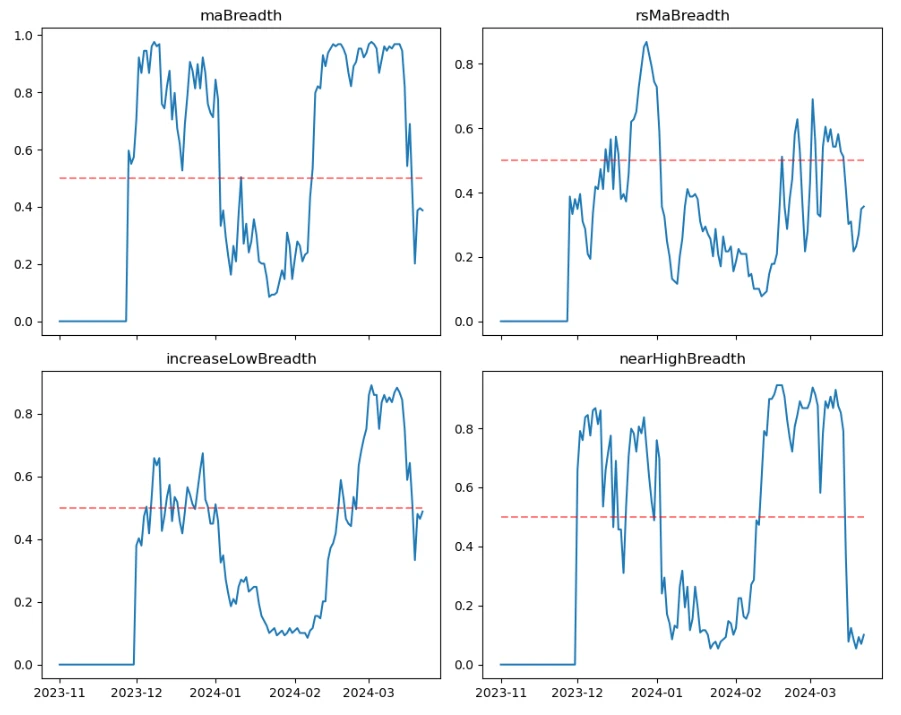
The picture above is [1000 floki, 1000 lunc, 1000 pepe, 1000 shib, 100 0x ec, 1inch, aave, ada, agix, algo, ankr, ant, ape, apt, arb, ar, astr, atom, audio, avax, axs, bal, band , bat, bch, bigtime, blur, bnb, btc, celo, cfx, chz, ckb, comp, crv, cvx, cyber, dash, dgb, doge, dot, dydx, egld, enj, ens, eos,etc, eth , fet, fil, flow, ftm, fxs, gala, gmt, gmx, grt, hbar, hot, icp, icx, imx, inj, iost, iotx, jasmy, kava, klay, ksm, ldo, link, loom, lpt , lqty, lrc, ltc, luna 2, magic, mana, matic, meme, mina, mkr, near, neo , ocean, one, ont, op, pendle, qnt, qtum, rndr, rose, rune, rvn, sand, sei, sfp, skl, snx, sol, ssv, stg, storj, stx, sui, sushi, sxp, theta , tia, trx, t, uma, uni, vet, waves, wld, woo, xem, xlm, xmr, xrp, xtz, yfi, zec, zen, zil, zrx] The proportion of each width indicator on the 30th day

Summarize
In the past week, the prices of Bitcoin (BTC) and Ethereum (ETH) have fluctuated and fallen in a wide range. The historical volatility and trading volume were the highest during the FOMC meeting on March 20, and the open interest volume decreased compared with the beginning of the week. . Implied volatility has increased slightly from the beginning of the week. In addition, funding rates continue to decline from highs, indicating that contract trading sentiment is gradually easing. The market breadth indicator shows that the overall market has begun to enter a downward trend, with most currencies falling from their highest prices compared to last week.
In terms of events, the Federal Reserve’s interest rate meeting was held in the past week. During the meeting, mainstream currencies had downward amplitudes, and then rebounded and rose. The current situation shows that the macro level is good for Bitcoin in the second half of 2024, but it is currently in a downward adjustment in the short term, and there will be fluctuations with high uncertainty.
Twitter: @DerivativesCN
Website: https://dcbot.ai/


