


Mainstream currencies rebound after falling due to strong non-agricultural data
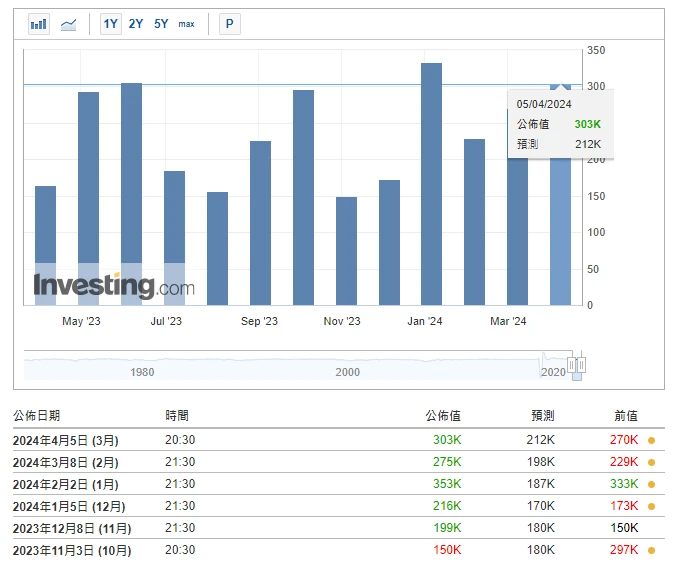
The United States added 303,000 non-farm jobs in March, continuing to significantly exceed the expected average of 200,000 and marking the largest increase since May last year. After the data was released, Bitcoin fell slightly and then rebounded to a maximum of around US$68,000. The price generated a large trading volume at US$67,000. A support level was formed at this position in the short term. The current price is above the support. We need to continue to observe whether the market situation is stable in the future. Enough upward momentum.
The Hong Kong Web3 conference is in progress. Sister Mu’s online Bitcoin prediction predicts that Bitcoin will rise to 1.5 million US dollars in 2030.

Cathie Wood, CEO and Chief Investment Officer of ARK Invest, said this when asked how the price of Bitcoin will develop.
Cathie Wood:
I have been asked this question from different angles. The result of our analysis from multiple angles is that Bitcoin will rise to $1.5 million in 2030. This price prediction comes from a survey of institutions, using the downside ratio and volatility. analyze. The previous price prediction for Bitcoin in 2030 was US$600,000, but the adoption of the Bitcoin spot ETF will push the Bitcoin price to US$1.5 million in 2030.
If I gave you this number last year, it was probably closer to $600,000. Why add the $600,000 number to 1.5 million? Because the SEC gave the “green light” and approved the issuance of spot Bitcoin ETFs for mainstream institutions. If you allocate assets based on modern portfolio theory, 5% of assets allocated to Bitcoin would give us an estimate of $1.5 million, because we feel that investment institutions will move in that direction.
Bitcoin halving is about 13 days away from today (2024.04.05)
Countdown to halving:https://www.binance.com/en/events/bitcoin-halving
Market technical and emotional environment analysis

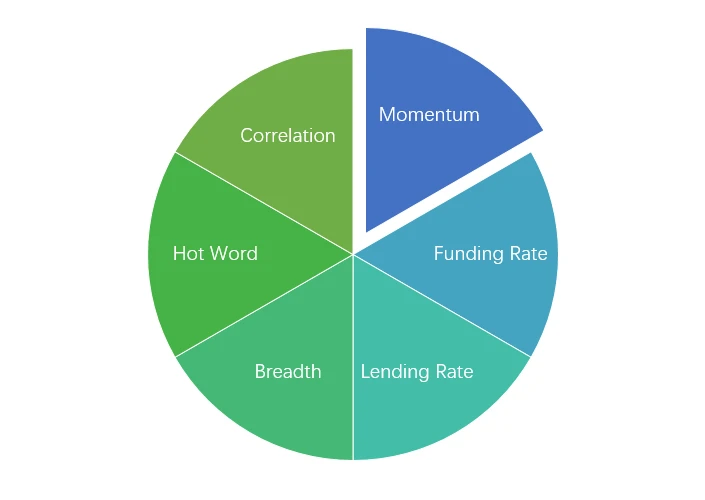
Sentiment analysis components

Technical indicators
Price trend
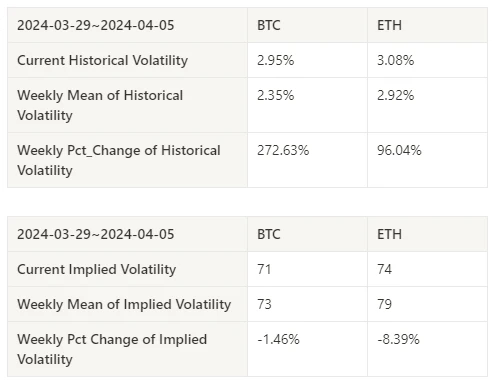
BTC price fell by -3.24% and ETH price by -6.55% in the past week.
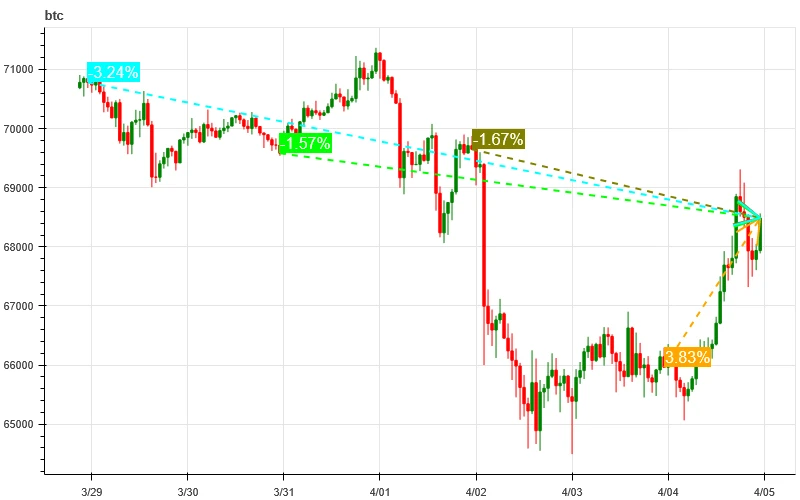
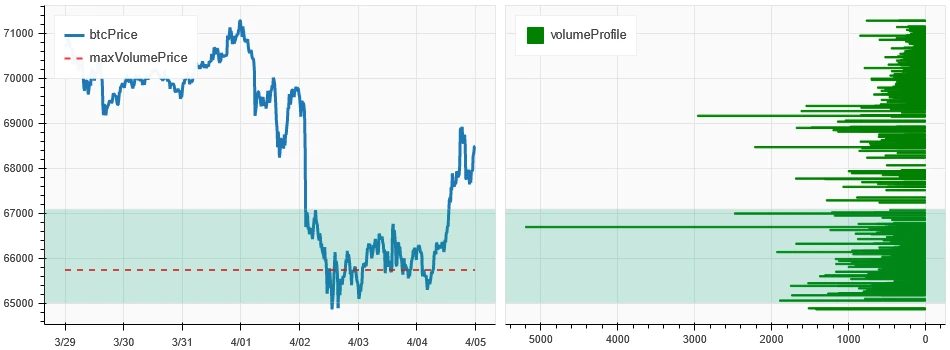
The picture above is the price chart of BTC over the past week
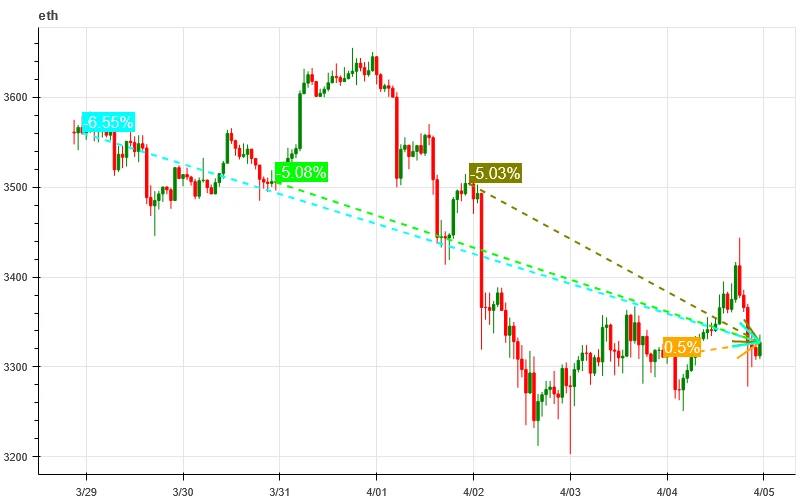
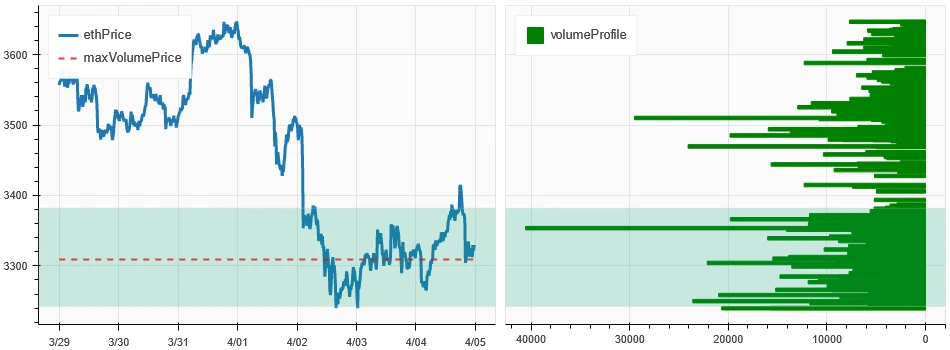
The picture above is the price chart of ETH over the past week
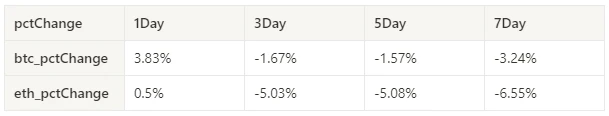
Table showing the rate of price change over the past week
Price and volume distribution chart (support and resistance)
In the past week, BTC and ETH prices formed new intensive trading areas at low levels.
The picture above is the distribution map of BTC’s intensive trading areas in the past week.
The picture above is the distribution map of ETH’s intensive trading areas in the past week.
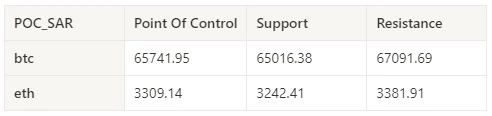
Table showing the intensive weekly trading ranges for BTC and ETH over the past week
Volume and Open Interest
The trading volume of BTC and ETH in the past week was the largest when it fell continuously at 4.2; the open interest of BTC and ETH both decreased slightly.
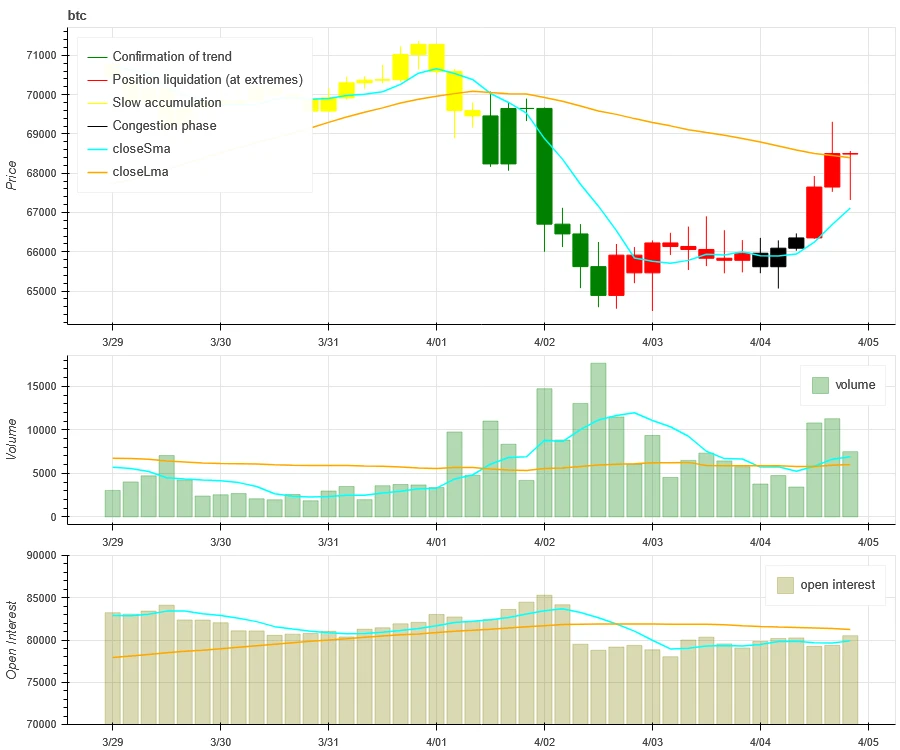
The price trend of BTC at the top of the picture above, the middle is the trading volume, the bottom is the open interest, the light blue is the 1-day average, and the orange is the 7-day average. The color of the K line represents the current status. Green means that the price rise is supported by trading volume, red means positions are being closed, yellow means positions are slowly accumulating, and black means congestion.
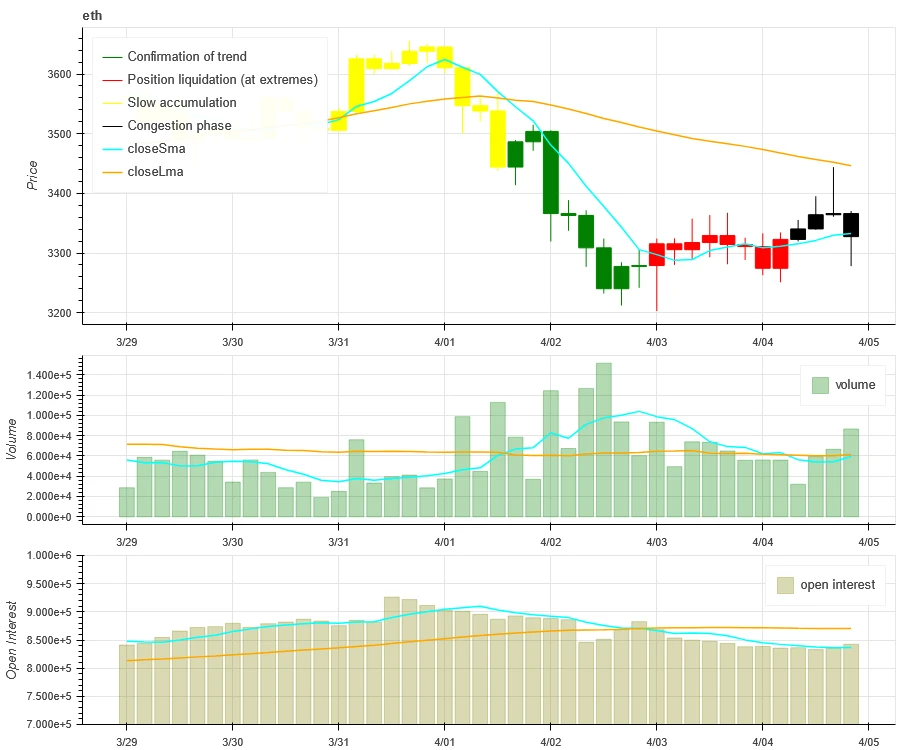
The price trend of ETH at the top of the picture above, the middle is the trading volume, the bottom is the open interest, the light blue is the 1-day average, and the orange is the 7-day average. The color of the K line represents the current status. Green means that the price rise is supported by trading volume, red means positions are being closed, yellow means positions are slowly accumulating, and black means congestion.
Historical Volatility vs. Implied Volatility
The historical volatility of BTC and ETH in the past week was the highest at 4.2; the implied volatility of BTC and ETH both dropped from the beginning of the week.
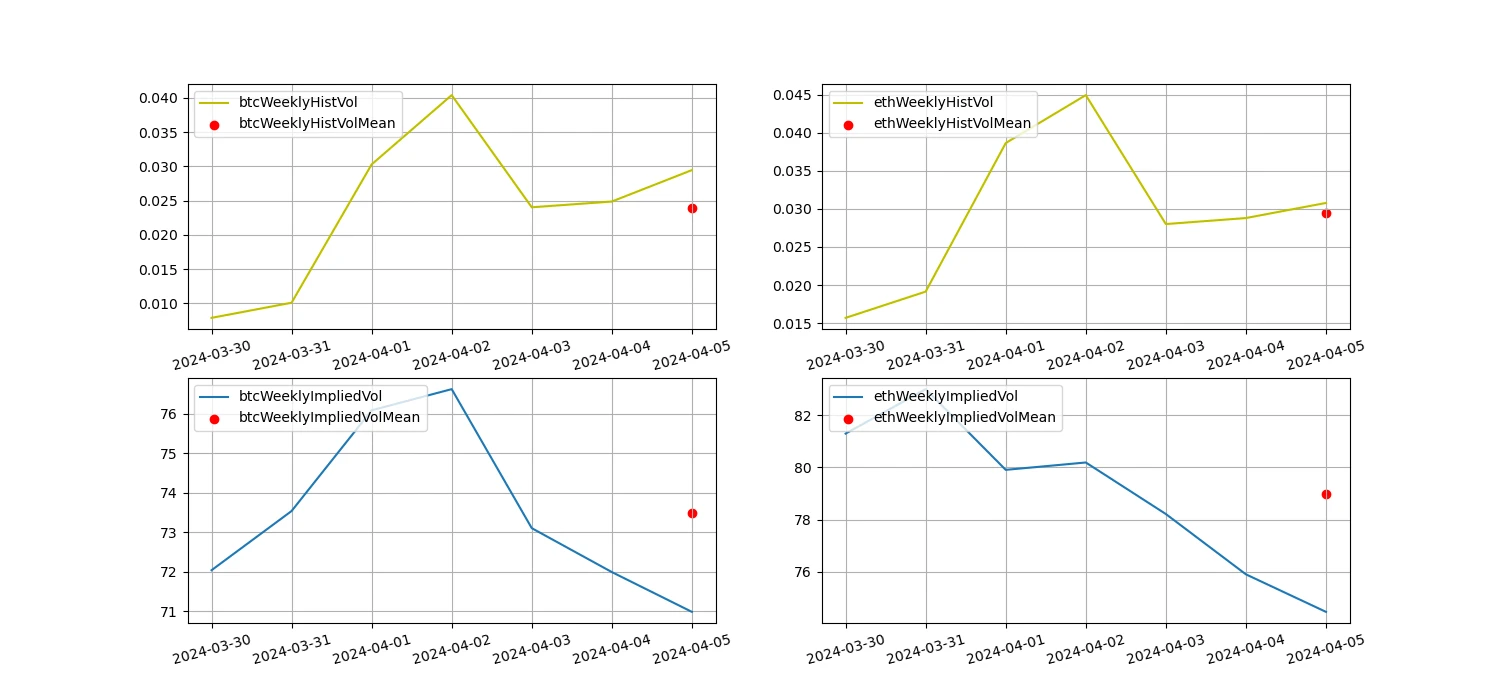
The yellow line is historical volatility, the blue line is implied volatility, and the red dot is its 7-day average
event driven
This week on 2024.04.05 20:30 (Beijing time) after the non-agricultural data was released, Bitcoin fell slightly and then rebounded to a maximum of around US$68,000. The price generated a large trading volume at US$67,000, forming a support level at this position in the short term. , the price is currently above the support, and we need to continue to observe whether the market has sufficient upward momentum.
sentiment indicator
momentum sentiment
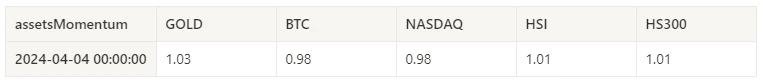
Among Bitcoin/Gold/Nasdaq/HSI/CSI 300, gold was the strongest in the past week, while Nasdaq was the worst performer.
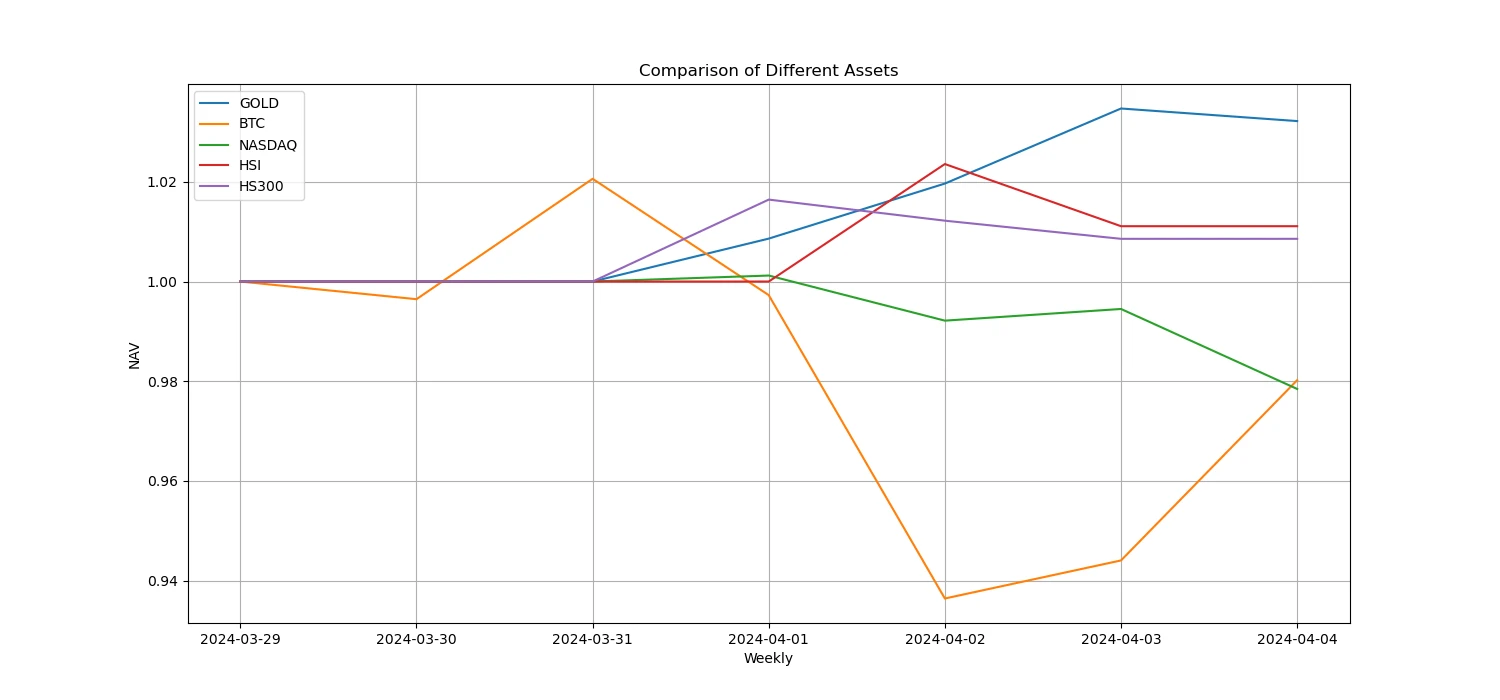
The picture above shows the trends of different assets over the past week.
Lending interest rate_Lending sentiment
The annualized return on USD lending averaged 14.8% in the past week, and short-term interest rates rose to around 15%.
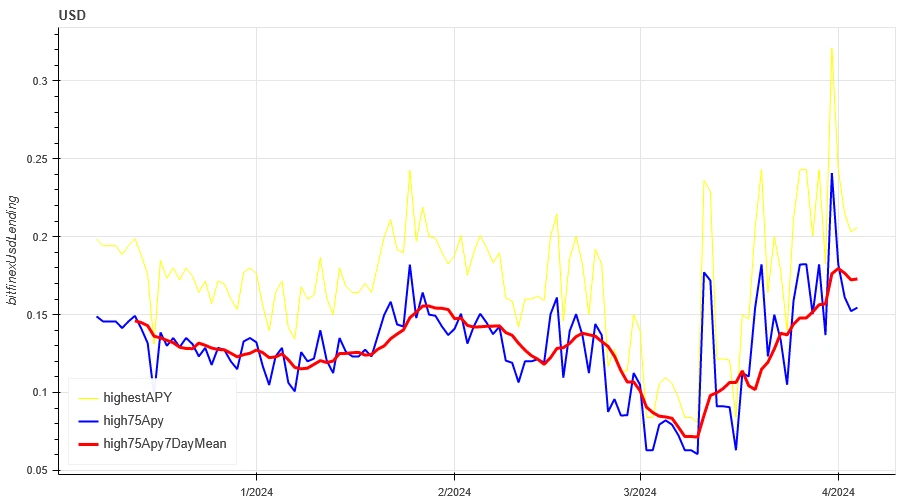
The yellow line is the highest price of the USD interest rate, the blue line is 75% of the highest price, and the red line is the 7-day average of 75% of the highest price
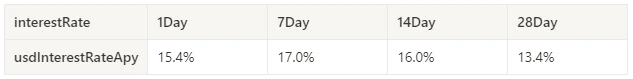
The table shows the average return of USD interest rate for different holding days in the past
Funding Rate_Contract Leverage Sentiment
The average annualized return on BTC tariffs in the past week was 22.5%, and contract leverage sentiment has rebounded from lows.
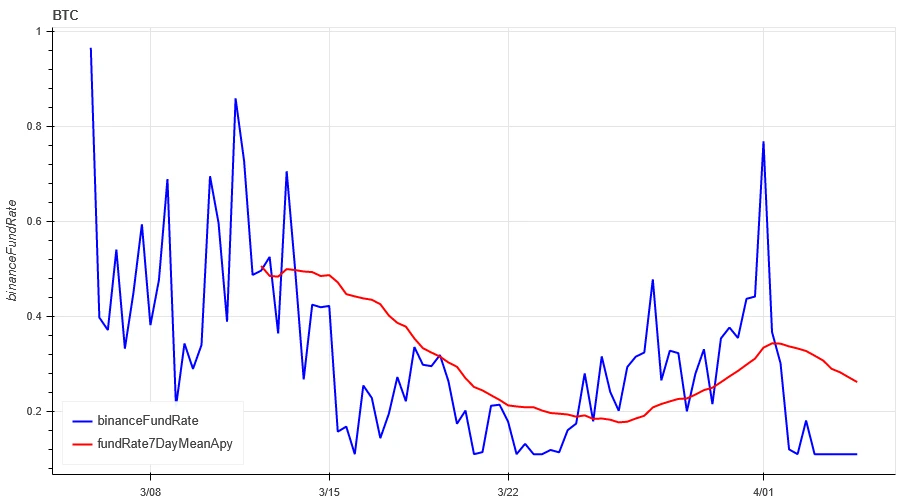
The blue line is the funding rate of BTC on Binance, and the red line is its 7-day average
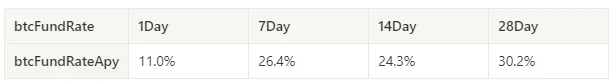
The table shows the average return of BTC fees for different holding days in the past
Market Correlation_Consistent Sentiment
The correlation among the 129 coins selected in the past week has increased to around 0.85, resulting in relatively consistent prices among different varieties.
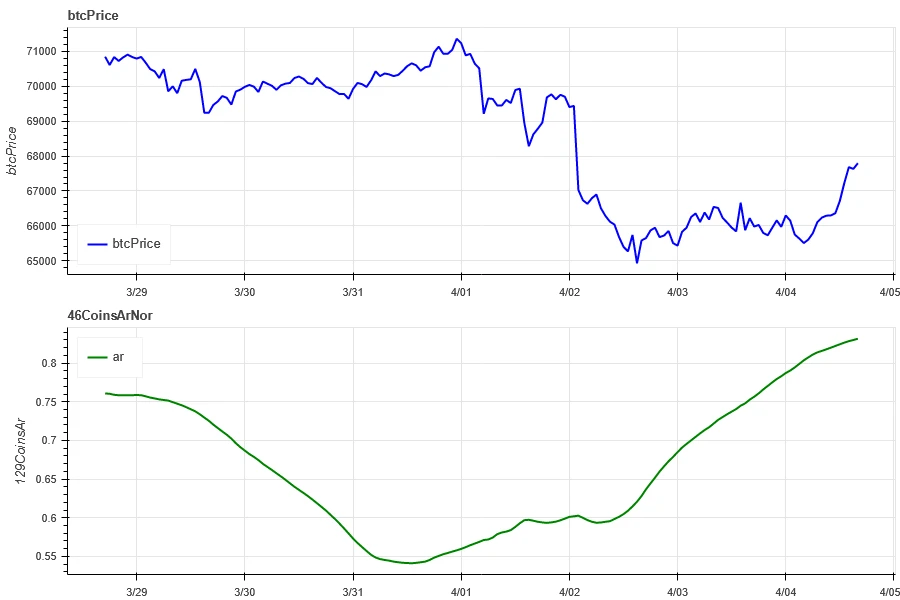
The blue line in the above picture first shows the Bitcoin price, and the green line is [1000 floki, 1000 lunc, 1000 pepe, 1000 shib, 100 0x ec, 1inch, aave, ada , agix, algo, ankr, ant, ape, apt, arb, ar, astr, atom, audio, avax, axs, bal, band, bat, bch, bigtime, blur, bnb, btc, celo, cfx, chz, ckb , comp, crv, cvx, cyber, dash, dgb, doge, dot, dydx, egld, enj, ens, eos,etc, eth, fet, fil, flow, ftm, fxs, gala, gmt, gmx, grt, hbar , hot, icp, icx, imx, inj, iost, iotx, jasmy, kava, klay, ksm, ldo, link, loom, lpt, lqty, lrc, ltc, luna 2, magic, mana, matic, meme, mina, mkr, near, neo, ocean, one, ont, op, pendle, qnt, qtum, rndr, rose, rune , rvn, sand, sei, sfp, skl, snx, sol, ssv, stg, storj, stx, sui, sushi, sxp, theta, tia, trx, t, uma, uni, vet, waves, wld, woo, xem , xlm, xmr, xrp, xtz, yfi, zec, zen, zil, zrx] overall correlation
Market Breadth_Overall Sentiment
Of the 129 coins selected in the past week, 12.4% had prices above the 30-day moving average. Compared with 12.4% of BTC prices above the 30-day moving average, 15.5% had prices greater than 20% from the lowest price in the past 30 days. , the proportion that is less than 10% from the highest price in the past 30 days is 7%. The market width indicator over the past week shows that the overall market has entered a relatively weak stage.
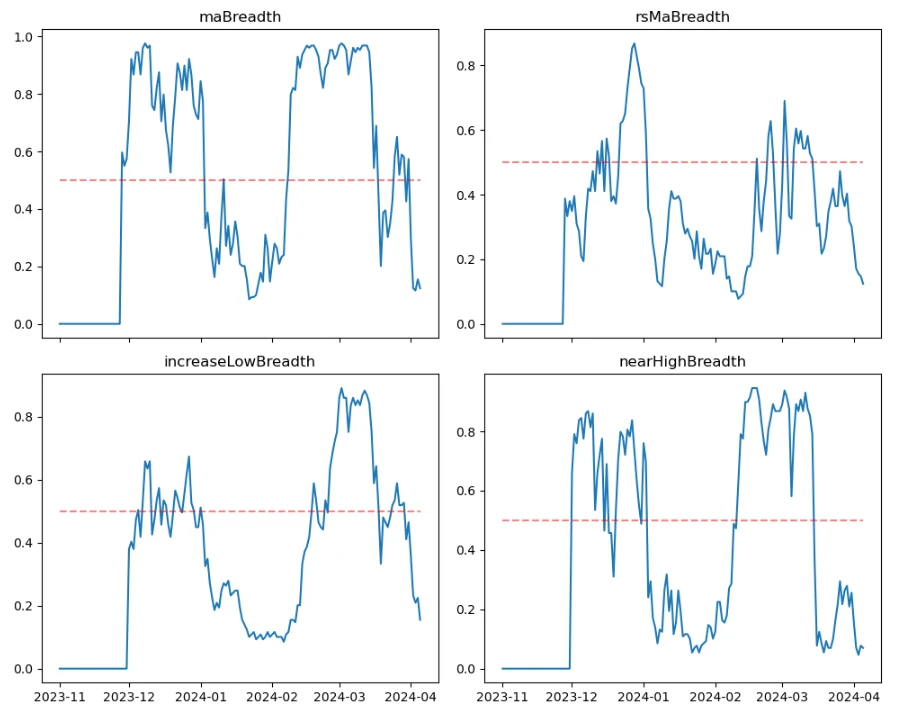
The picture above is [1000 floki, 1000 lunc, 1000 pepe, 1000 shib, 100 0x ec, 1inch, aave, ada, agix, algo, ankr, ant, ape, apt, arb, ar, astr, atom, audio, avax, axs, bal, band , bat, bch, bigtime, blur, bnb, btc, celo, cfx, chz, ckb, comp, crv, cvx, cyber, dash, dgb, doge, dot, dydx, egld, enj, ens, eos,etc, eth , fet, fil, flow, ftm, fxs, gala, gmt, gmx, grt, hbar, hot, icp, icx, imx, inj, iost, iotx, jasmy, kava, klay, ksm, ldo, link, loom, lpt , lqty, lrc, ltc, luna 2, magic, mana, matic, meme, mina, mkr, near, neo , ocean, one, ont, op, pendle, qnt, qtum, rndr, rose, rune, rvn, sand, sei, sfp, skl, snx, sol, ssv, stg, storj, stx, sui, sushi, sxp, theta , tia, trx, t, uma, uni, vet, waves, wld, woo, xem, xlm, xmr, xrp, xtz, yfi, zec, zen, zil, zrx] The proportion of each width indicator on the 30th day

Summarize
In the past weeks market conditions, the prices of Bitcoin (BTC) and Ethereum (ETH) have both fallen to a certain extent. The historical volatility and trading volume have been at 4.2, which is the largest during the continuous decline. The open interest volume is higher than at the beginning of the week. decline. Implied volatility for BTC and ETH is down from the start of the week. In addition, funding rates have fallen back from their high levels, indicating a sharp decline in contract trading sentiment. Market breadth indicator The overall market has entered a relatively weak stage. In terms of events, after the release of non-agricultural data on 4.5, the prices of mainstream currencies fell slightly and then rebounded. Members of dcBot will also be at the Hong Kong Web3 venue this week. If you are interested, please contact TG to make an appointment.
Twitter: @DerivativesCN
Website: https://dcbot.ai/


