
Crypto Market Sentiment Research Report (2024.04.05-04.12): Short-term declines require defensive measures
Short-term defensive measures are needed
We cannot accurately assess whether it is suitable to buy at the bottom at present, but the following data from the past week reminds us that we need to be prepared for risks at all times:

The current crypto market is extremely correlated: price fluctuations are often highly correlated during unilateral declines, and the overall market performance may have a greater impact on individual assets.
Funding rate reaches a low level or even becomes negative: Funding rate is a mechanism in contract trading. A low level or even a negative number may mean that market sentiment is biased towards the short side and needs to be handled with caution.
Most Small Coins Have Fallen Below Past Support Levels: Many smaller cryptocurrencies have fallen below past support levels, showing weak price action and requiring close attention to market dynamics.
Mainstream coin prices are below the 30-day moving average and close to past lows: The prices of mainstream cryptocurrencies are relatively low, approaching or below past lows, and below the 30-day moving average, which may indicate that the market is in a downtrend in the short term.
International wars continue: There is a risk of war in the current international situation, and geopolitical tensions may create uncertainty and impact on the market.
It is often said that those who drown are usually the ones who know how to swim. Similarly, in the investment world, it is often the experienced people who engage in leveraged trading during bull markets who end up suffering the most losses, overestimating their abilities or taking unnecessary risks, and ultimately facing dire consequences. When prices plummet, the decline is like a free fall, happening quickly and unexpectedly. Traders who are good at riding bullish trends may become complacent and over-rely on leverage, exposing themselves to significant losses when market conditions change. Therefore, in the current environment, do not use leverage heavily, keep enough cash to wait out short-term declines, and professional investors may consider configuring strategies such as CTA and call options to protect against possible future declines.
Market technical and sentiment environment analysis
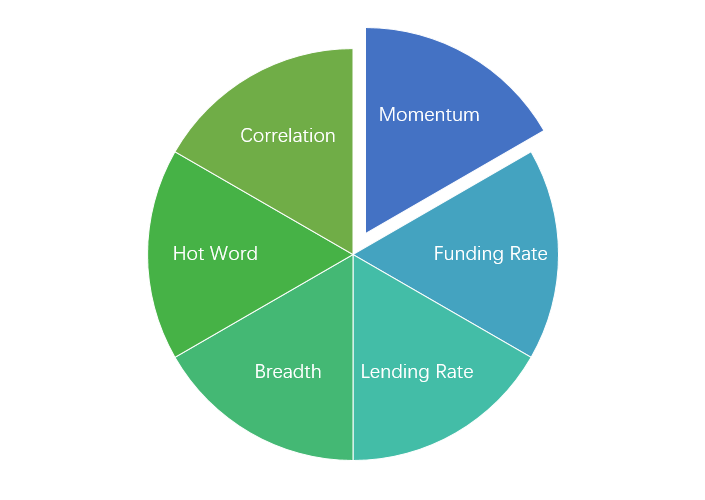
Sentiment Analysis Components

Technical indicators
Price trend
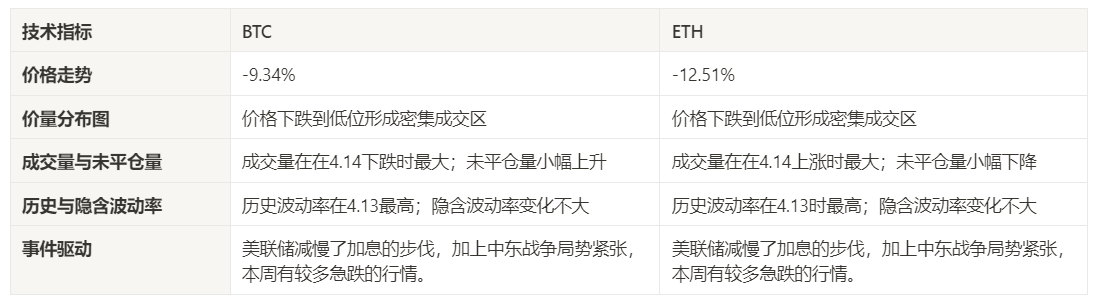
BTC price fell -9.34% and ETH price fell -12.51% in the past week.
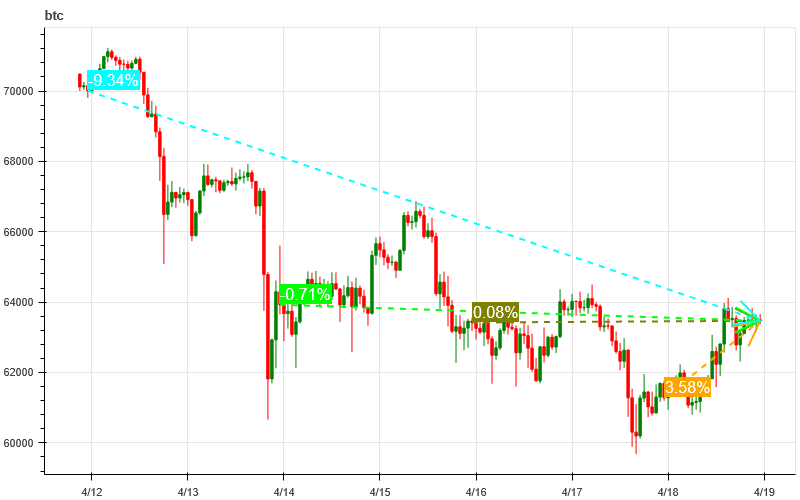
The above picture is the price chart of BTC in the past week.
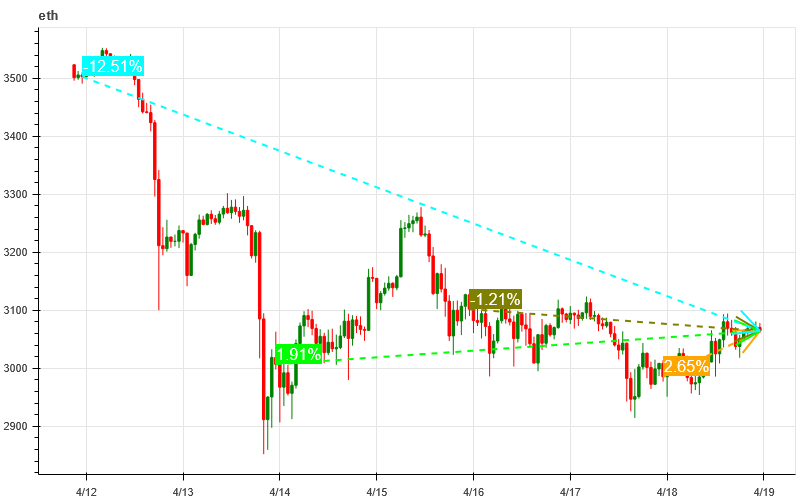
The above picture is the price chart of ETH in the past week.
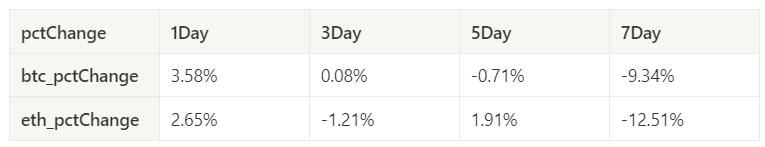
The table shows the price change rate over the past week.
Price Volume Distribution Chart (Support and Resistance)
In the past week, the prices of BTC and ETH fell to low levels, forming a dense trading area.
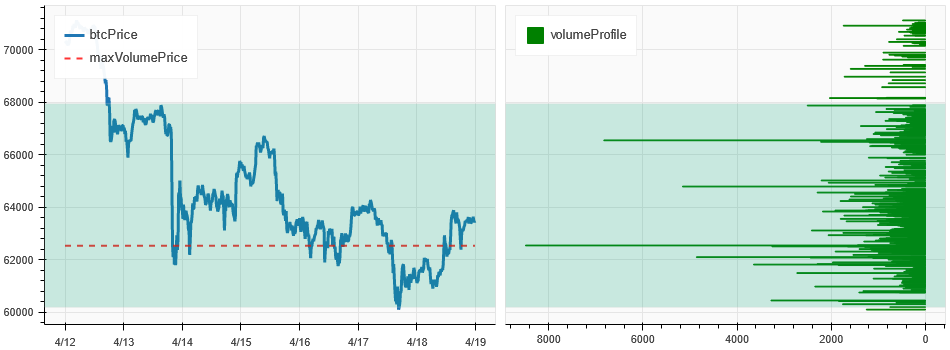
The above picture shows the distribution of BTC's dense trading areas in the past week.
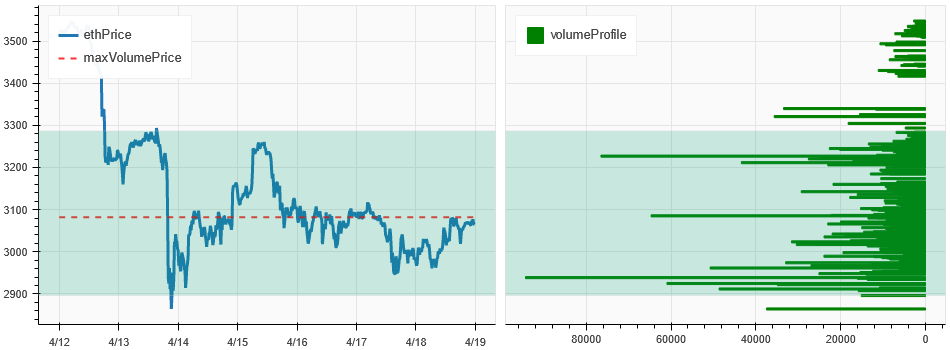
The above picture shows the distribution of ETH's dense trading areas in the past week.
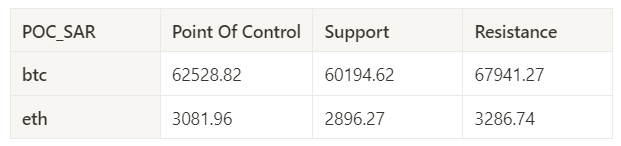
The table shows the weekly intensive trading range of BTC and ETH in the past week.
Volume and Open Interest
BTC and ETH trading volume was the largest on the 4.14 drop in the past week; open interest for both BTC and ETH fell.
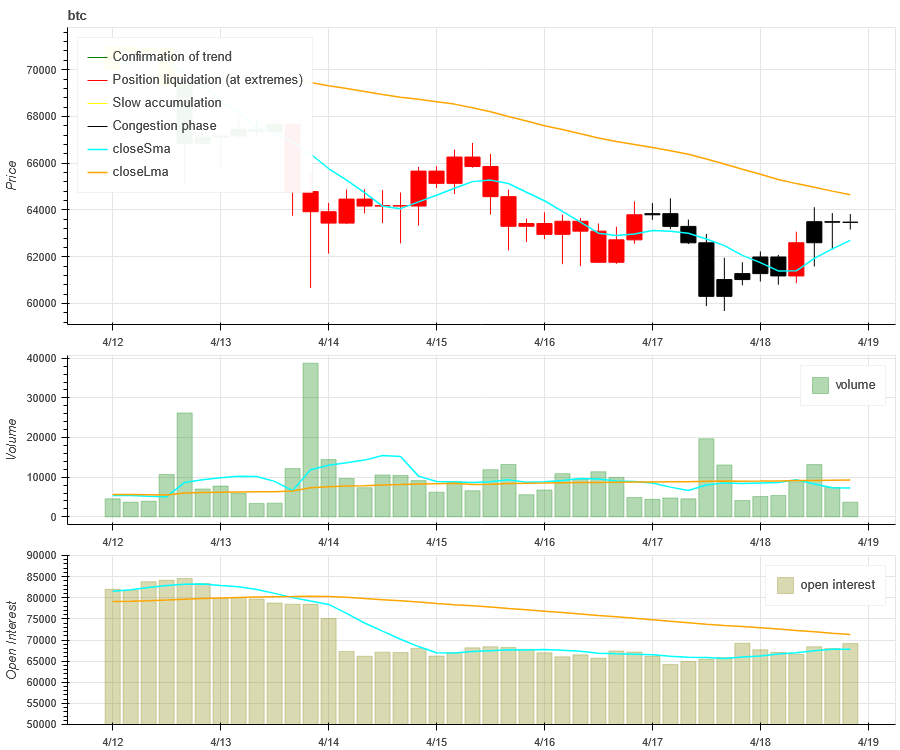
The top of the above picture shows the price trend of BTC, the middle shows the trading volume, the bottom shows the open interest, the light blue is the 1-day average, and the orange is the 7-day average. The color of the K-line represents the current state, green means the price rise is supported by the trading volume, red means closing positions, yellow means slowly accumulating positions, and black means crowded state.
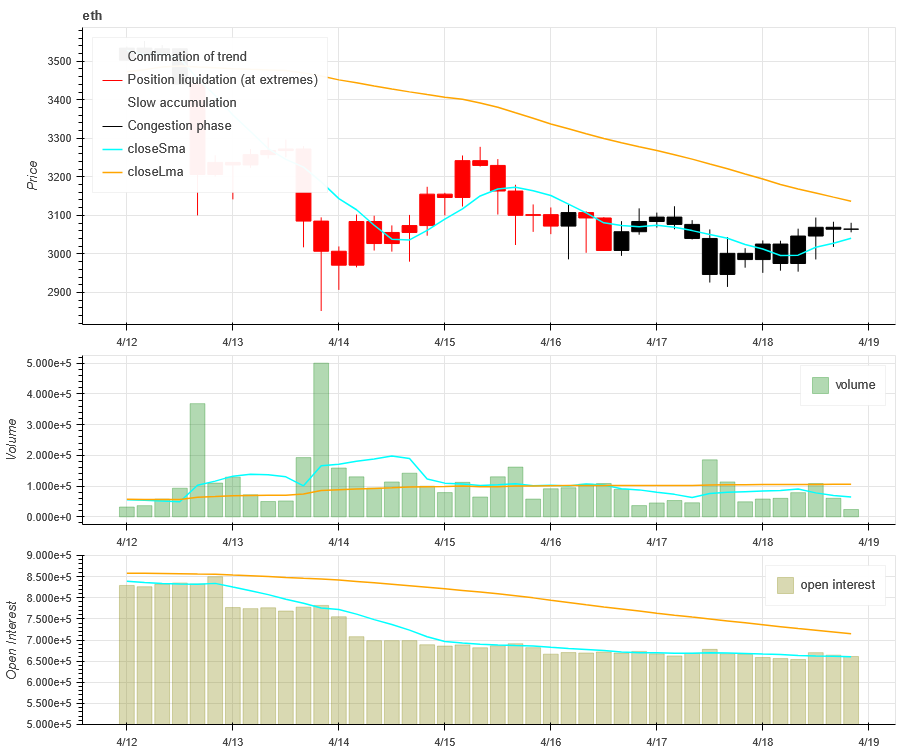
The top of the above picture shows the price trend of ETH, the middle is the trading volume, the bottom is the open interest, the light blue is the 1-day average, and the orange is the 7-day average. The color of the K-line represents the current state, green means the price rise is supported by the trading volume, red is closing positions, yellow is slowly accumulating positions, and black is crowded.
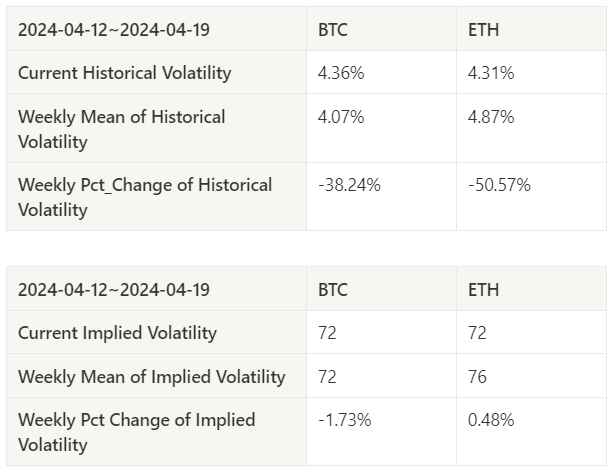
Historical Volatility vs. Implied Volatility
In the past week, the historical volatility of BTC and ETH was the highest at 4.13; the implied volatility of BTC and ETH did not change much.
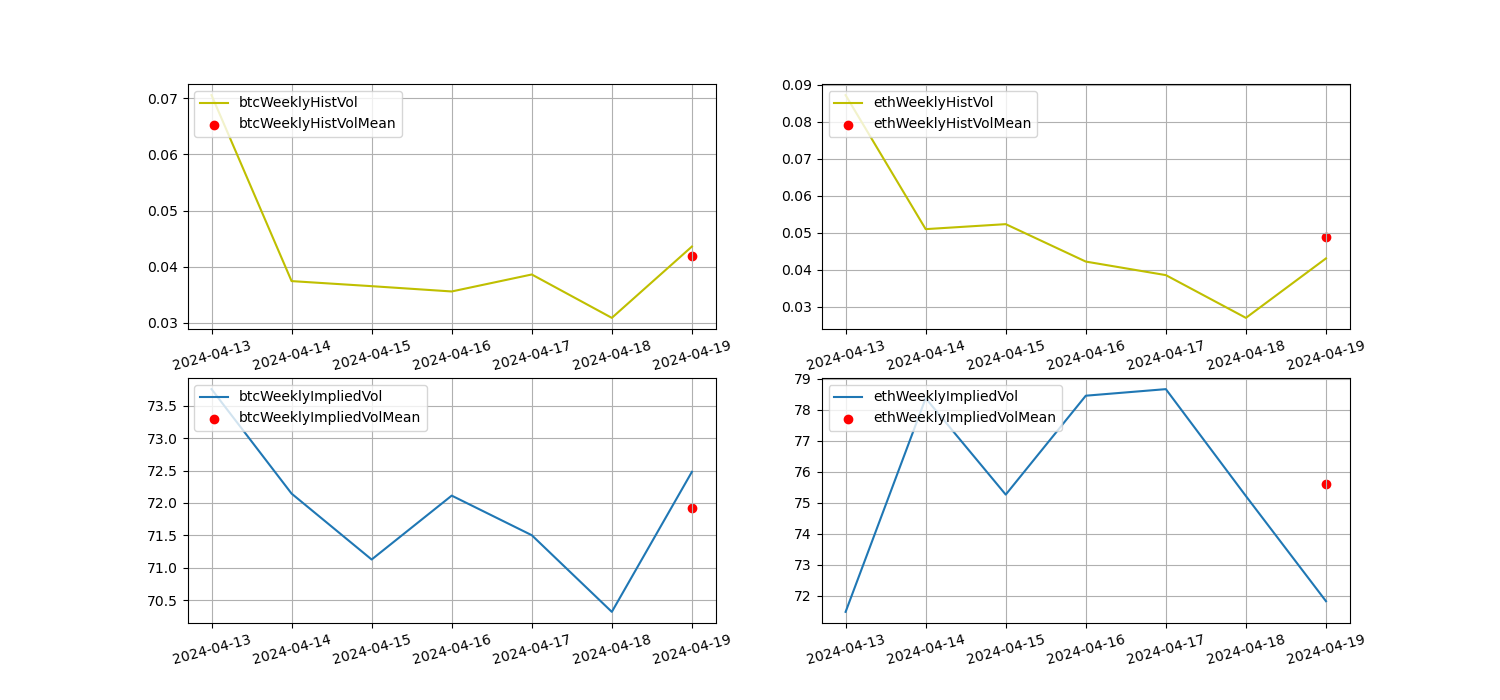
The yellow line is the historical volatility, the blue line is the implied volatility, and the red dot is its 7-day average.
Event-driven
Events of this week: The Federal Reserve has slowed down the pace of interest rate cuts, and coupled with the tense situation in the Middle East war, Bitcoin has seen more sharp declines.
Sentiment Indicators
Momentum Sentiment
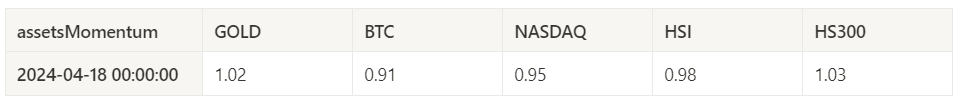
In the past week, among Bitcoin/Gold/Nasdaq/Hang Seng Index/SSE 300, HS 300 was the strongest, while Bitcoin performed the worst.
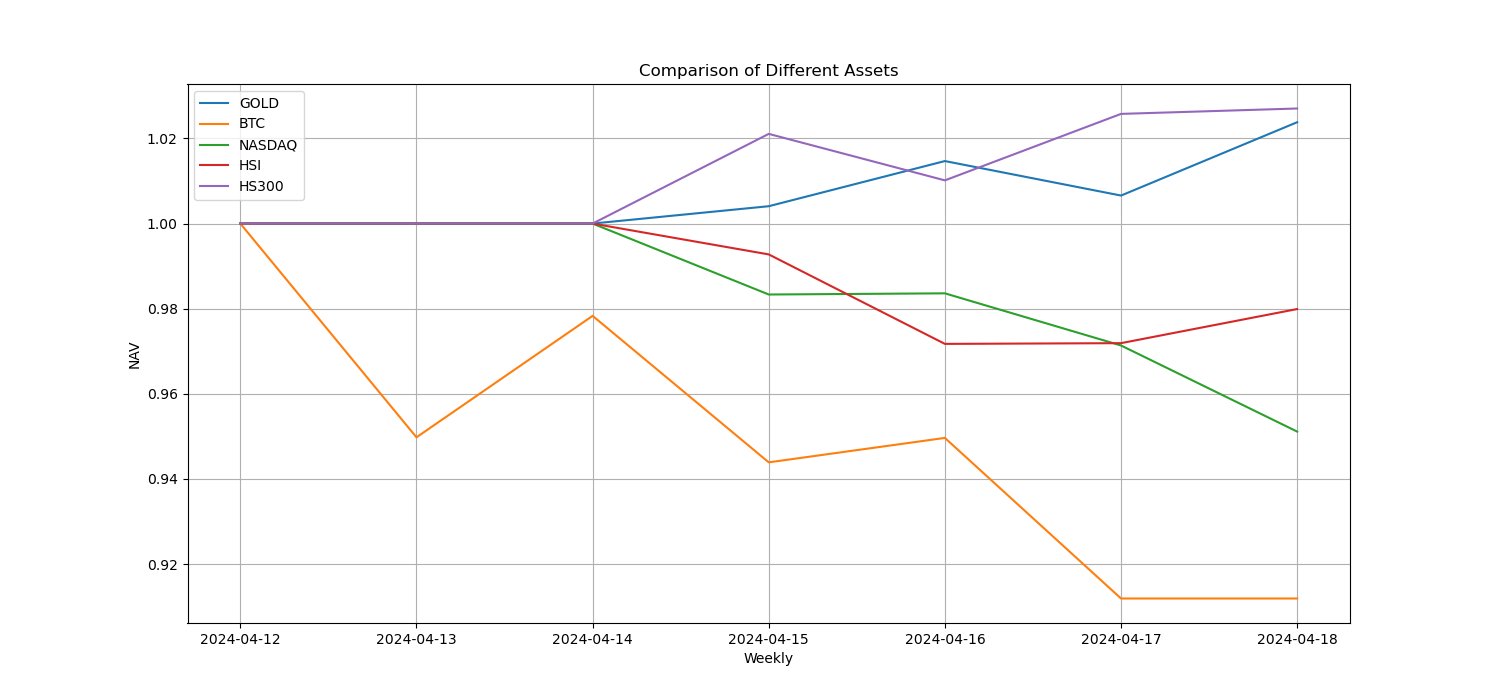
The above picture shows the trend of different assets in the past week.
Lending Rate_Lending Sentiment
Over the past week, the average annualized return on USD lending was 12.8%, and short-term interest rates fell to around 8.6%.
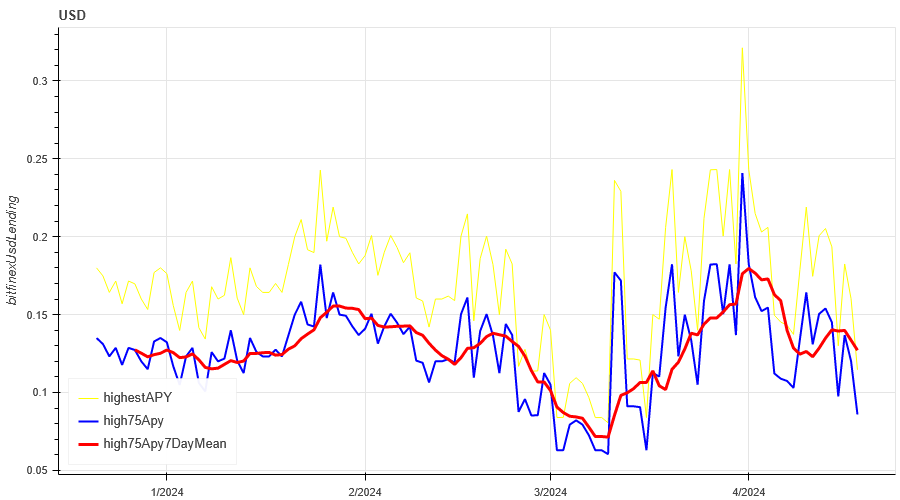
The yellow line is the highest price of USD interest rate, the blue line is 75% of the highest price, and the red line is the 7-day average of 75% of the highest price.
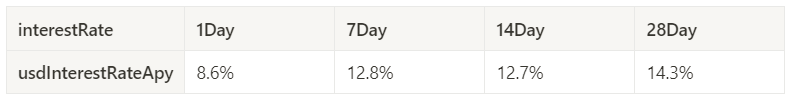
The table shows the average returns of USD interest rates for different holding days in the past
Funding Rate_Contract Leverage Sentiment
The average annualized return on BTC fees in the past week was 9.7%, and contract leverage sentiment fell sharply in the short term.
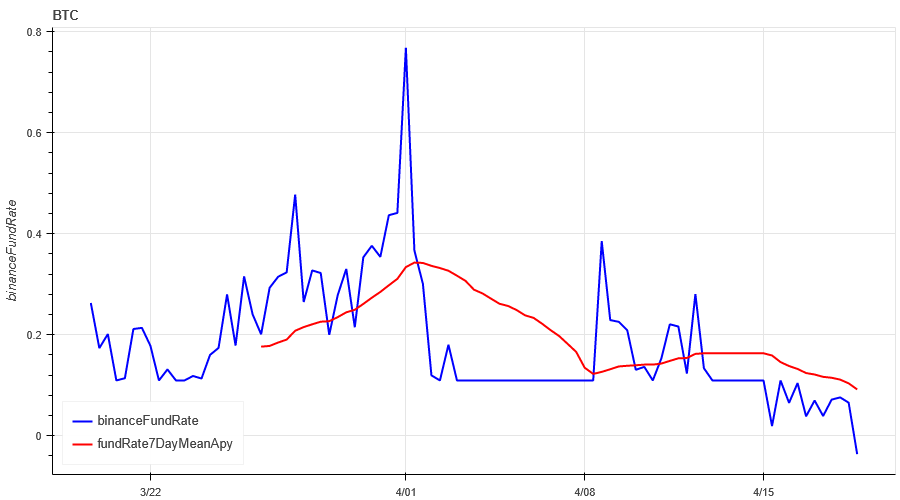
The blue line is the funding rate of BTC on Binance, and the red line is its 7-day average
The table shows the average return of BTC fees for different holding days in the past.
Market Correlation_Consensus Sentiment
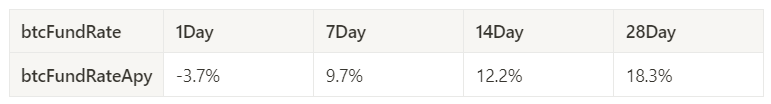
The correlation among the 129 coins selected in the past week rose to around 0.95, resulting in extremely consistent market conditions among different varieties.
In the above figure, the blue line is the price of Bitcoin, and the green line is ['1000 floki', '1000 lunc', '1000 pepe', '1000 shib', '100 0x ec', '1inch', 'aave', 'ada', 'agix', 'algo', 'ankr', 'ant', 'ape', 'apt', 'arb', 'ar', 'astr', 'atom', 'audio', 'avax', 'axs', 'bal', 'band', 'bat', 'bch', 'bigtime', 'blur', 'bnb', 'btc', 'celo', 'cfx', 'chz', 'ckb', 'comp', 'crv', 'cvx', 'cyber', 'dash', 'dgb', 'doge', 'dot', 'dydx', 'egld', 'enj', 'ens', 'eos','etc', 'eth', 'fet', 'fil', 'flow', 'ftm', 'fxs', 'gala', 'gmt', 'gmx', 'grt', 'hbar', 'hot', 'icp', 'icx', 'imx', 'inj', 'iost', 'iotx', 'jasmy', 'kava', 'klay', 'ksm', 'ldo', 'link', 'loom', 'lpt', 'lqty', 'lrc', 'ltc', 'luna 2', 'magic', 'mana', 'matic', 'meme', 'mina', 'mkr', 'near', 'neo', 'ocean', 'one', 'ont', 'op', 'pendle', 'qnt', 'qtum', 'rndr', 'rose', 'rune', 'rvn', 'sand', 'sei', 'sfp', 'skl', 'snx', 'sol', 'ssv', 'stg', 'storj', 'stx', 'sui', 'sushi', 'sxp', 'theta', 'tia', 'trx', 't', 'uma', 'uni', 'vet', 'waves', 'wld', 'woo', 'xem', 'xlm', 'xmr', 'xrp', 'xtz', 'yfi', 'zec', 'zen', 'zil', 'zrx'] overall correlation
Market Breadth_Overall Sentiment
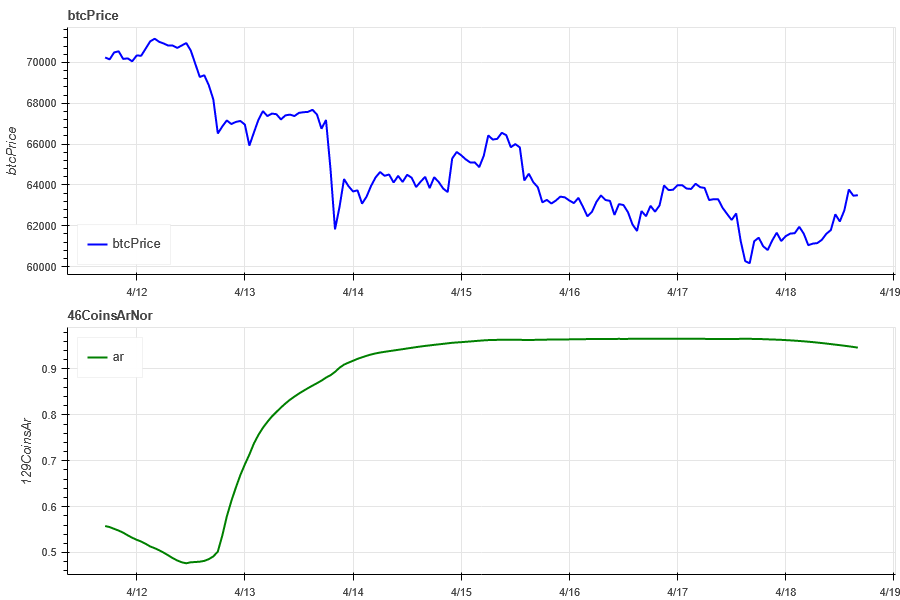
Among the 129 coins selected in the past week, 3.9% of the coins were priced above the 30-day moving average, 5.4% of the coins were priced above the 30-day moving average relative to BTC, 4.6% of the coins were more than 20% away from the lowest price in the past 30 days, and 2.3% of the coins were less than 10% away from the highest price in the past 30 days. The market breadth indicator in the past week showed that the overall market was in an extremely weak stage.
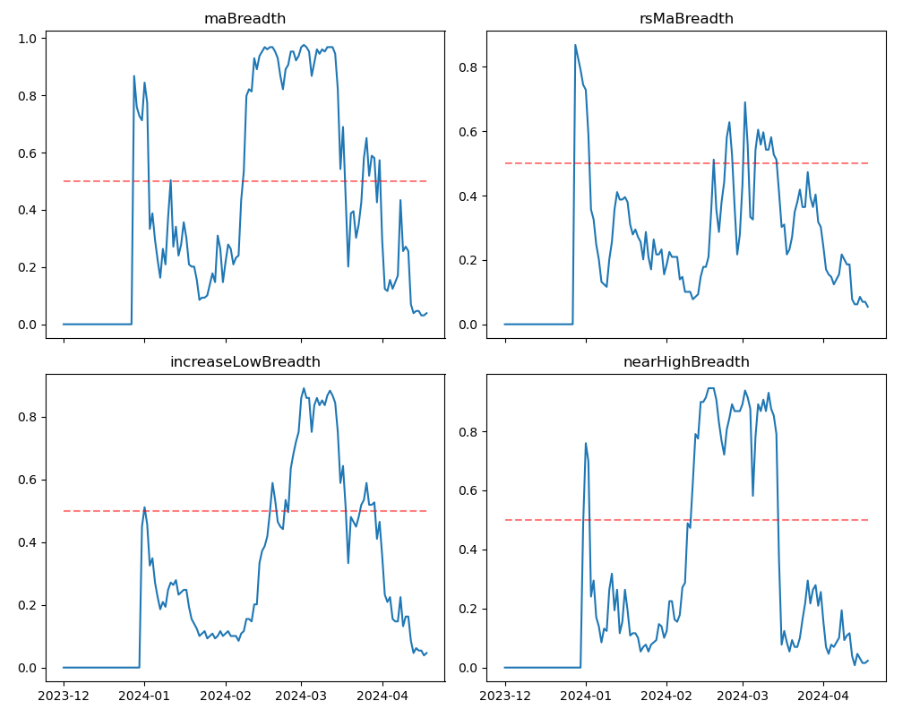
The above picture is ['1000 floki', '1000 lunc', '1000 pepe', '1000 shib', '100 0x ec', '1inch', 'aave', 'ada', 'agix', 'algo', 'ankr', 'ant', 'ape', 'apt', 'arb', 'ar', 'astr', 'atom', 'audio', 'avax', 'axs', 'bal', 'band', 'bat', 'bch', 'bigtime', 'blur', 'bnb', 'btc', 'celo', 'cfx', 'chz', 'ckb', 'comp', 'crv', 'cvx', 'cyber', 'dash', 'dgb', 'doge', 'dot', 'dydx', 'egld', 'enj', 'ens', 'eos','etc', 'eth', 'fet', 'fil', 'flow', 'ftm', 'fxs', 'gala', 'gmt', 'gmx', 'grt', 'hbar', 'hot', 'icp', 'icx', 'imx', 'inj', 'iost', 'iotx', 'jasmy', 'kava', 'klay', 'ksm', 'ldo', 'link', 'loom', 'lpt', 'lqty', 'lrc', 'ltc', 'luna 2', 'magic', 'mana', 'matic', 'meme', 'mina', 'mkr', 'near', 'neo', 'ocean', 'one', 'ont', 'op', 'pendle', 'qnt', 'qtum', 'rndr', 'rose', 'rune', 'rvn', 'sand', 'sei', 'sfp', 'skl', 'snx', 'sol', 'ssv', 'stg', 'storj', 'stx', 'sui', 'sushi', 'sxp', 'theta', 'tia', 'trx', 't', 'uma', 'uni', 'vet', 'waves', 'wld', 'woo', 'xem', 'xlm', 'xmr', 'xrp', 'xtz', 'yfi', 'zec', 'zen', 'zil', 'zrx'] 30-day proportion of each width indicator

Summarize
In the past week's market, the prices of Bitcoin (BTC) and Ethereum (ETH) fluctuated at a low level after falling at the beginning of the week. The historical volatility and trading volume were both large during the decline from April 13 to 14, and the open interest decreased. The implied volatility of BTC and ETH did not change much. In addition, the funding rate dropped sharply, indicating that the contract trading sentiment was low. The market breadth indicator is in an extremely weak stage as a whole. In terms of events, the Federal Reserve has slowed down the pace of interest rate cuts, and the tense situation of the war in the Middle East has led to a sharp drop in Bitcoin. Bitcoin will be halved in the next day, and long-term investors can pay close attention to the investment opportunities and risk management of the halving.
Twitter: @DerivativesCN
Website: https://dcbot.ai/


