


Original article by: Bitcoin Magazine Pro
Original translation: Vernacular Blockchain
Bitcoins four-year cycle has long been of great interest to investors and cryptocurrency enthusiasts, who carefully track these recurring price action patterns to predict upcoming market moves. However, given the changing dynamics of the Bitcoin market and the economic environment, we must acknowledge that the traditional four-year capital flow cycle may be drawing to a close. Here, we will explore whether we should consider the possibility of the end of Bitcoins four-year cycle, and whether this theory is well-supported by evidence or is just speculation.
1. Interpreting Bitcoin’s four-year cycle
Bitcoins four-year cycle is primarily driven by Bitcoin halving events, which occur approximately every four years. During a halving event, the mining reward for Bitcoin transactions is halved, thereby reducing the velocity of new Bitcoins in circulation. In the past, these halving events have triggered bull/bear cycles in Bitcoin prices:
Halving event: The new supply of Bitcoin is cut in half.
Post-Halving Bull Run: Usually accompanied by 12-18 months of price increases.
Bear Market: A period of falling prices after a peak in prices.
Transition period: Slow recovery until the next halving.
These cycles have been well documented, and multiple models such as the Stock-to-Flow model demonstrate these patterns. Therefore, our current price trend suggests that the four-year cycle is still in operation. However, the historical price increases have become less significant, and the peaks are not as sharp as in previous cycles.
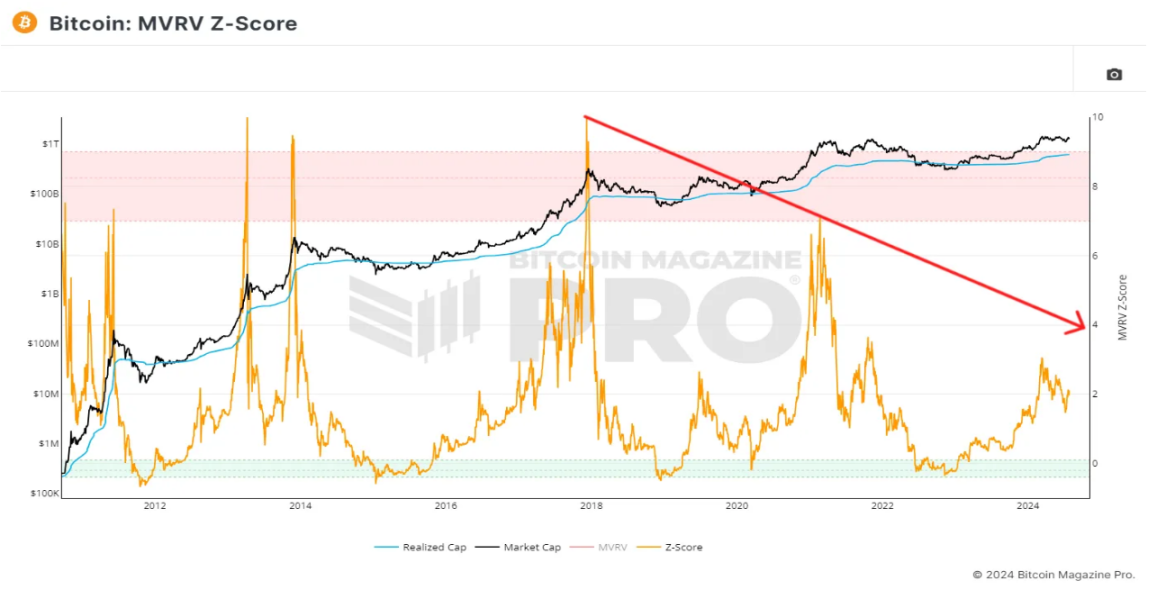
2. Stable MVRV Z-score
The MVRV Z-score compares Bitcoins market cap to its realized market cap, providing insights into market valuation. The downward trend in the Z-score peaks suggests that the volatility of market reactions has decreased over time. This suggests that while Bitcoin still follows a cyclical pattern, the magnitude of these cycles may decrease as the market matures and market cap grows. The chart below shows the MVRV Z-score (orange line) and its declining peaks (red line) over the first two cycles.
3. Focus on the inventory-to-flow model
The stock-to-flow model is a popular framework for predicting Bitcoin prices based on scarcity, which takes into account these gradual reductions in inflation. The model compares Bitcoins existing stock (existing supply) to its flow (newly minted Bitcoins). As Bitcoins flow decreases due to halving events and constant block additions, its stock-to-flow ratio increases, indicating increased scarcity and, in theory, increased value.
It is clear that Bitcoins price trend after the 2024 halving is similar to previous cycles. The model shown in the figure below suggests that the reduction in supply could push the price to about $440,000 (red line) within a year after the halving. Such a high peak would break the trend in the figure below, which is the continued decline in deviations from the S2F fair valuation, and the decrease in peak volatility in the oscillator below.
Until we see hard evidence that the model is no longer valid, we need to consider it as a possibility. Remember, if the model continues indefinitely, it will eventually predict that Bitcoin will be worth more than the total value of the world’s currencies; while this is not technically impossible, is hyperbitcoinization inevitable?

4. Impact of reduced inflation
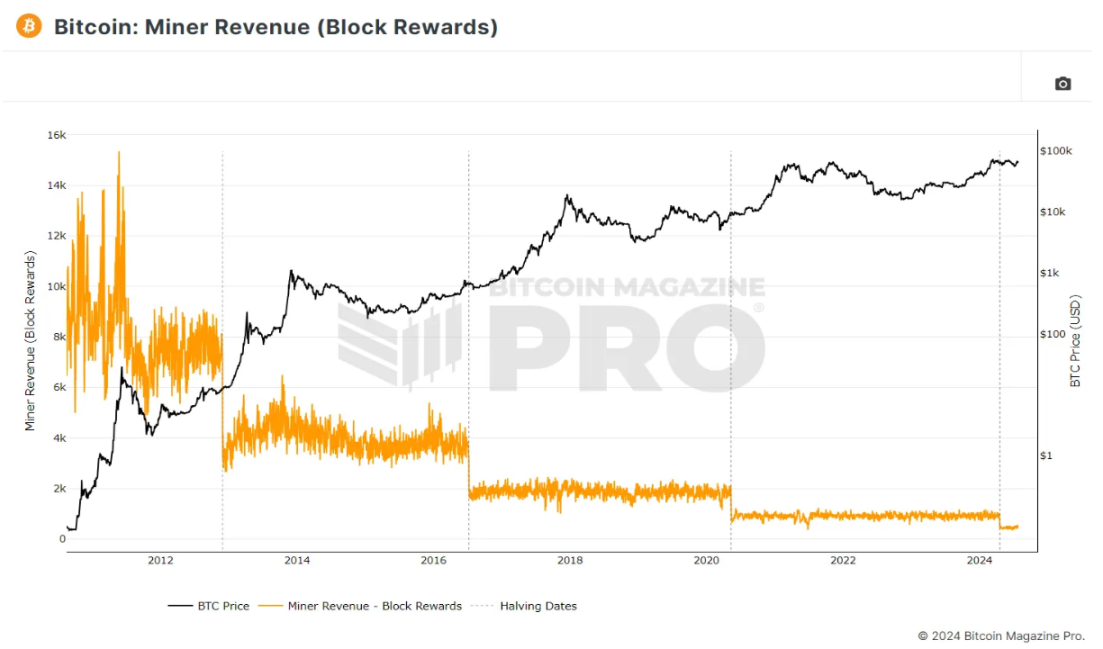
Halving events significantly reduce miners BTC revenue and have historically driven prices higher. However, as block rewards decrease over time, the impact of halvings on Bitcoin prices may weaken. For example, the change from 6.25 BTC per block to 3.125 BTC was quite significant, but future halvings will see smaller reductions, potentially weakening their impact on the market.
When Bitcoin’s last halving occurred in May 2020, the circulating supply was approximately 18.37 million BTC. The block reward at the time was 6.25 BTC, with an annual inflation rate of approximately 1.82%. Over the next four years, this ratio gradually decreased as the supply increased. When the most recent 2024 halving occurred, the inflation rate had fallen by approximately 6%, to approximately 1.71%. After the 2024 halving, the block reward was halved to 3.125 BTC. As the total supply continues to increase, the annual inflation rate has fallen to less than 1% (currently around 0.85%). This continued decline emphasizes the foresight in Bitcoin’s design, but its impact is gradually becoming less significant.
Currently, there are approximately 19.7 million Bitcoins in circulation, with a block reward of 3.125 BTC generated every ten minutes. This means that we have mined 94% of the total supply, and the remaining 1.3 million BTC will be mined in the next 120 years. The following chart shows the BTC income that miners receive from block rewards alone every day (orange line), and its trend towards 0.
5. Changes in miner income and fee-based incentives
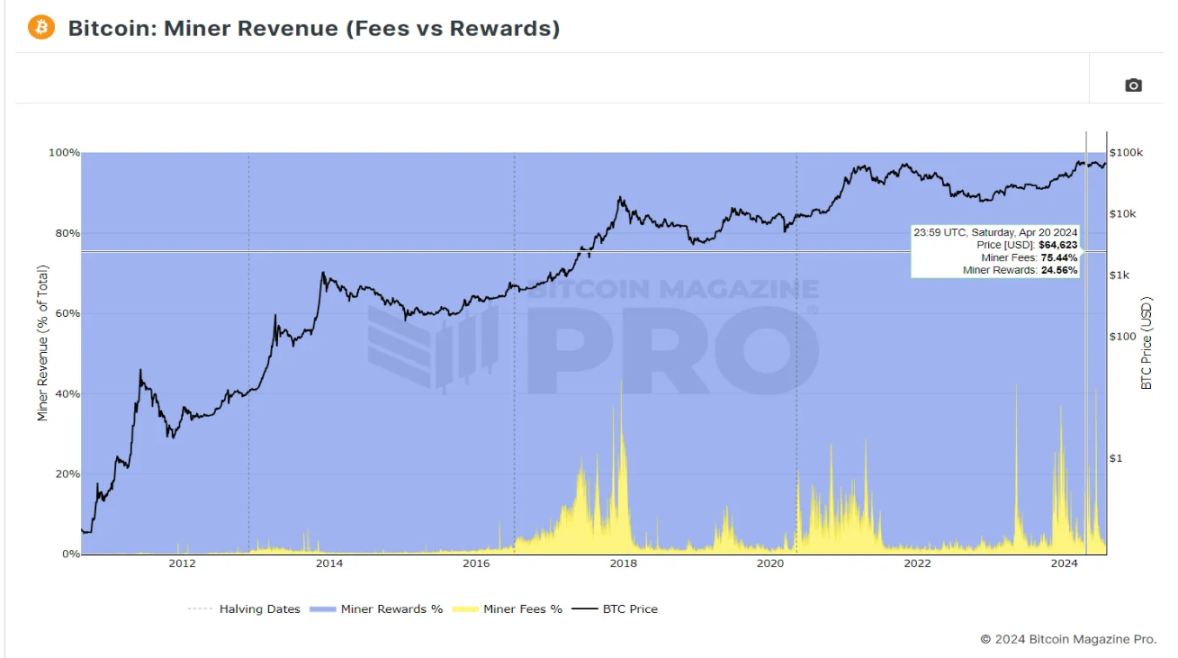
As block rewards decrease, transaction fees make up for the shortfall in miners’ income. On April 20, 2024, the day of the halving, the total transaction fees reached 1257.72 BTC, which was more than 3.07 times the block reward (409.38 BTC) on that day. This is the first time that miners’ income from transaction fees exceeds block rewards, marking a trend towards a mining model based on transaction fees.
As miners receive more revenue from transaction fees, the importance of halving events in shaping miners’ incentives may decrease. If transaction fees account for a larger share of miners’ revenue (as shown in the yellow shaded area in the figure below), miners may be less concerned about the impact of a 50% reduction in block rewards (block reward revenue is represented by the blue shaded area in the figure below). This shift suggests that the dominant influence of halving events on miner behavior and Bitcoin prices may weaken over time.
6. The impact of hodling
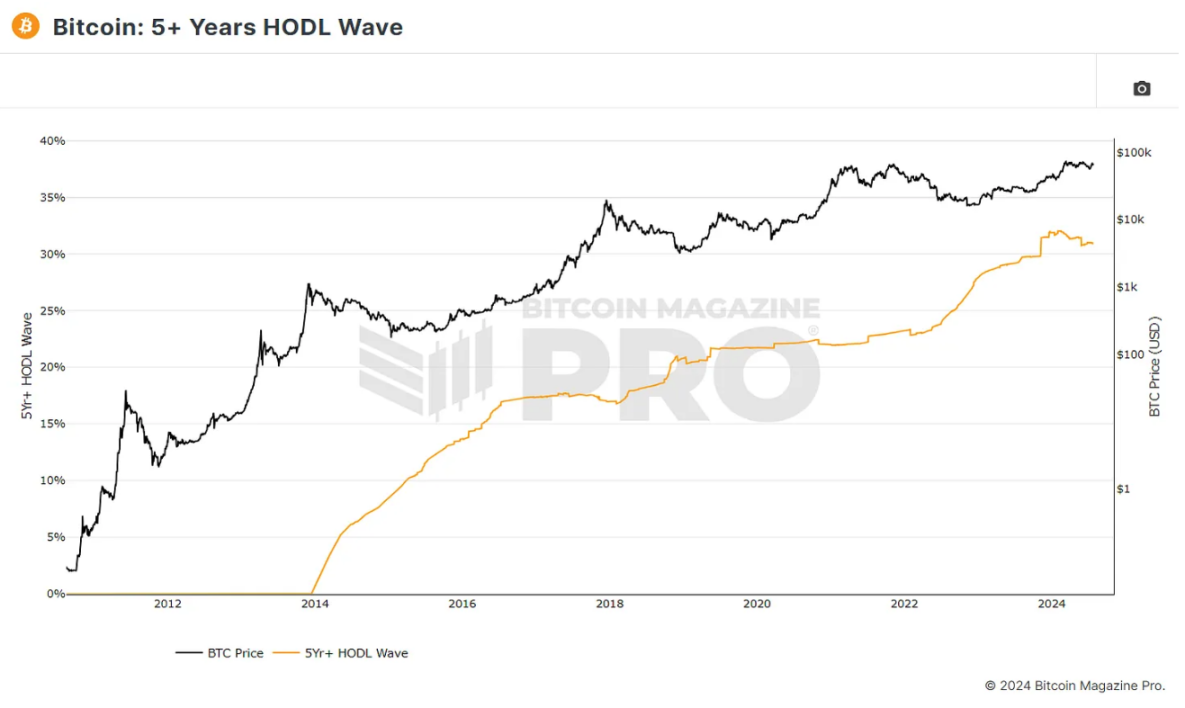
The increasing trend of holding Bitcoin for the long term is another factor that could dampen cyclical fluctuations in Bitcoin prices. Data shows that more than 30% of the supply has not moved in the past 5 years, and this proportion may continue to rise rapidly at a macro level, as shown in the figure below; the orange line shows the percentage of Bitcoin that has not moved in at least half a century. Whether these Bitcoins are lost or held by long-term investors, this behavior reduces the circulating supply and now exceeds the impact of the reduction in new supply brought about by the halving event.
If 10% of these investors who hold for more than 5 years (about 3.2% of the circulating BTC supply) decide to take profits during this cycle, 630,400 BTC will flow into the open market. During the entire four-year halving cycle, only 656,250 new Bitcoins are minted, and this small difference clearly depicts the new market dynamics.
7. The prospect of an extended market cycle
This decreasing inflation could attract more institutional and even sovereign investment. Institutions like BlackRock and countries like El Salvador recognize the potential for rising scarcity and price appreciation in Bitcoin. Demand is expected to surge as more investors recognize Bitcoin’s unique monetary properties. However, this demand will likely be more in sync with traditional liquidity cycles and macroeconomic-driven risk appetite, rather than driven by retail speculation as in previous cycles.
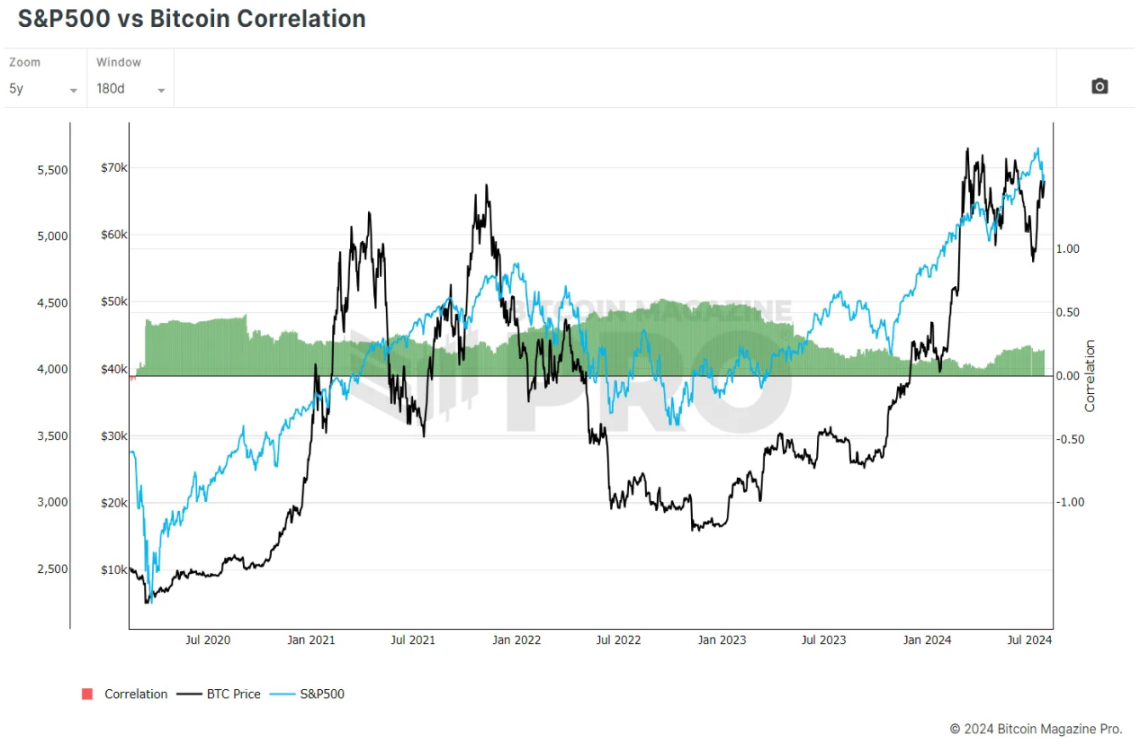
Given the likely weakening of the impact of Bitcoins own fundamentals, the increasing influence of new market participants, and Bitcoins historically strong positive correlation with traditional assets and indices such as the SP 500, Bitcoin may begin to follow more traditional market cycles, such as those of the stock market, which typically last 8-10 years. In the chart below, we can see Bitcoin price action (black line) versus SP 500 price action (blue line).
These parallel movements can be measured on a scale of -1 (negative correlation) to 1 (positive correlation). Over the past 5 years, the 6-month correlation for these assets has often been above 0.6, showing a strong relationship between the two. When one moves, the other usually follows.
8. The Evolving Bitcoin Market
Until we observe significant deviations from historical patterns, such as Bitcoins failure to reach new all-time highs after the halving, the four-year cycle remains a valuable framework for understanding Bitcoin market behavior. A reduced impact of halving events does not mean they will become bearish. On the contrary, their impact may weaken.
The recent Bitcoin halving event remains bullish and will likely continue to have a positive impact on Bitcoin prices in 2024 and beyond, albeit with potentially smaller returns and less price volatility. While there is no hard evidence that the impact of halving events has stopped, the overall impact of future halving events is expected to diminish, impacting a predictable four-year cycle.


