The information, opinions and judgments on the markets, projects, currencies, etc. mentioned in this article are for reference only and do not constitute any investment advice.

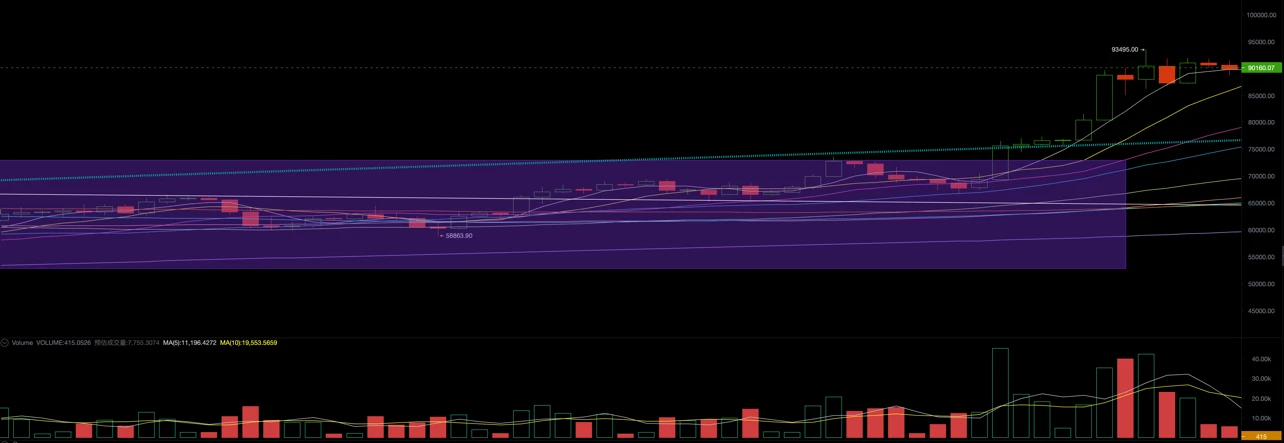
After returning to the upward trend line last week, BTC continued to advance this week, recording a sharp increase of 11.76% in a single week. Driven by the Trump deal market, BTCs cumulative increase has exceeded 30%, and it has ushered in greater selling pressure in the short term, but thanks to the support and promotion of strong buying power, it has recorded a sharp increase again.
This week, BTC opened at 80427.69 and closed at 89886.69 USD, with the volume effectively enlarged, achieving four consecutive weeks of growth. In October, after taking the 200-day moving average, BTC surged again this week, completely getting rid of the suppression of the new high consolidation zone and rushing to the bull-bear dividing line (the blue line in the above figure, about 75,000 USD), with no technical indicators suppressing it.
The October CPI data released by the United States and the hawkish speech by Federal Reserve Chairman Powell during the week changed the markets expectations for a rate cut in December, dragging down the three major U.S. stock indexes for several days. However, BTCs trend was significantly stronger than that of the Nasdaq, not only achieving a sharp rise during the week, but also showing signs of an independent trend.
Federal Reserve and economic data
Data from the U.S. Department of Labor on Wednesday showed that the CPI rose 2.6% year-on-year in October, the first year-on-year acceleration since March. This year-on-year growth was in line with market expectations, but Powells subsequent speech reduced the dovish guidance, saying that the U.S. economy was performing quite well and there was no rush to lower interest rates. This caused the U.S. stock market, which had already cut interest rates by 25 basis points in December, to fall into a weak trend, with the three major stock indexes falling 3.15%, 1.24% and 2.98% respectively during the week. The upward trend of gold also came to an abrupt halt, with London gold falling 4.58% this week.
The US dollar index rose another 1.63% this week, reaching an astonishing 106.6842 as of Saturday. Both long-term and short-term US bonds remain high. The trend of global capital flowing into the US market has not changed.
Is the Trump rally over? It is too early to tell. We believe that the lowered expectations for interest rate cuts will have a relatively short-term impact, and the market may soon price in this lowered expectation. The soft landing of the U.S. economy and the profit growth trend of core companies have not changed in the medium and long term.
Stablecoins and BTC Spot ETF
The capital inflow into the crypto asset market this week was relatively optimistic.
Dragged down by the U.S. stock market, the BTC Spot ETF channel recorded outflows on two of the five trading days, but still had a net inflow of more than US$1.6 billion for the whole week, slightly exceeding last week.
Following last week, the inflow scale of the stablecoin channel continued to surpass the BTC Spot ETF channel, reaching US$4.46 billion, showing that the inflow of funds from non-US regions is very urgent.
The massive inflow of funds has become a strong support for BTC to continue to rise after returning to the upward trend line last week. Although the short-term increase is huge, if the inflow of funds continues, a large adjustment may not occur.
Selling off
The “Trump market” has pushed BTC up by nearly 30%, and the sharp rise in the short term has triggered a large-scale sell-off by investors. According to the eMerge Engine on-chain data monitoring, long-term investors “reduce” 180,000 BTC, reaping profits of more than $1 billion.
However, on-chain monitoring shows that more than 20,000 BTC in exchange reserves have flowed out this week, indicating that the scale of the sell-off is still smaller than the scale of new investors buying.
On-chain data shows that as of the 16th, the average floating profit of short-term investors remained at a high level of 26%, indicating that there is still a large selling pressure in the subsequent market. Once the inflow of funds slows down, short-term prices may fall.
In the medium to long term, we are cautiously optimistic. The biggest uncertainty comes from the interest rate cut in December and whether there will be a major adjustment in the US stock market.
Cycle Indicators
The EMC BTC Cycle Metrics indicator is 0.875, and the market is in an upward phase and is showing a vigorous upward trend.
EMC Labs was founded by crypto asset investors and data scientists in April 2023. It focuses on blockchain industry research and Crypto secondary market investment, takes industry foresight, insight and data mining as its core competitiveness, and is committed to participating in the booming blockchain industry through research and investment, and promoting blockchain and crypto assets to bring benefits to mankind.
For more information, please visit: https://www.emc.fund


