Original | Odaily Planet Daily ( @OdailyChina )
Author|Nan Zhi ( @Assassin_Malvo )

In the previous article Looking back at the market data of the past 4 years, which stage of the bull market are we in? , based on the market and market data of the past four years starting from 2020, we found that the rate, active buying transaction volume, and total transaction volume are effective leading indicators of the market. However, these three indicators gave two completely opposite conclusions . The rate shows that the current market has just entered a slightly FOMO stage from a cooling-off period, but the active buying transaction volume and total transaction volume have hit historical highs, indicating the top of the stage .
The author believes that the divergence in the indicator conclusions is mainly caused by the prevalence of Bitcoin spot ETFs and micro-strategy coin hoarding. These net inflows of funds outside the traditional currency circle have pushed up Bitcoin prices and trading volumes. On the other hand, its transactions are isolated from CEXs such as Binance and the leverage form is completely different, resulting in a derailment of fees and prices.
Therefore, the author aims to explore what stage of the bull market we are in through other more general, intuitive and historical indicators.
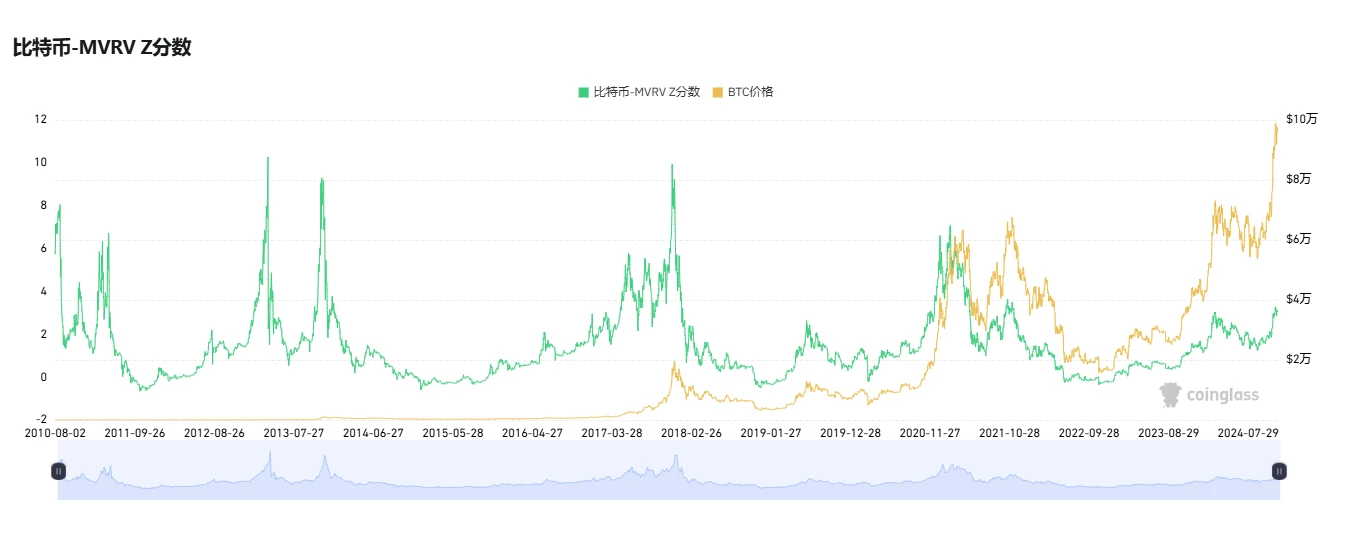
MVRV-Z score
MVRV (market value to realized value ratio) is an algorithm used to assess whether a market is overvalued or undervalued. It does this by comparing Bitcoin’s current market value and realized value.
The market value refers to the circulating market value, and the realized value refers to the total of the last moving prices of each bitcoin . For example, 100,000 bitcoins were last transferred three years ago when the price was US$65,000, which was recorded as 100,000 × 65,000. The total value can be calculated by dividing the market value by the realized value to get MVRV.
The algorithm of MVRV-Z score is (market value - realized value) ÷ standard deviation of market value. This method excludes short-term price noise and is more suitable for capturing extreme market sentiment.
According to coinglass , the current value of MVRV-Z is 3.2, close to the peak in November 2021, but still a long way from the first half of 2021 and the end of 2017.
ahr 999 index
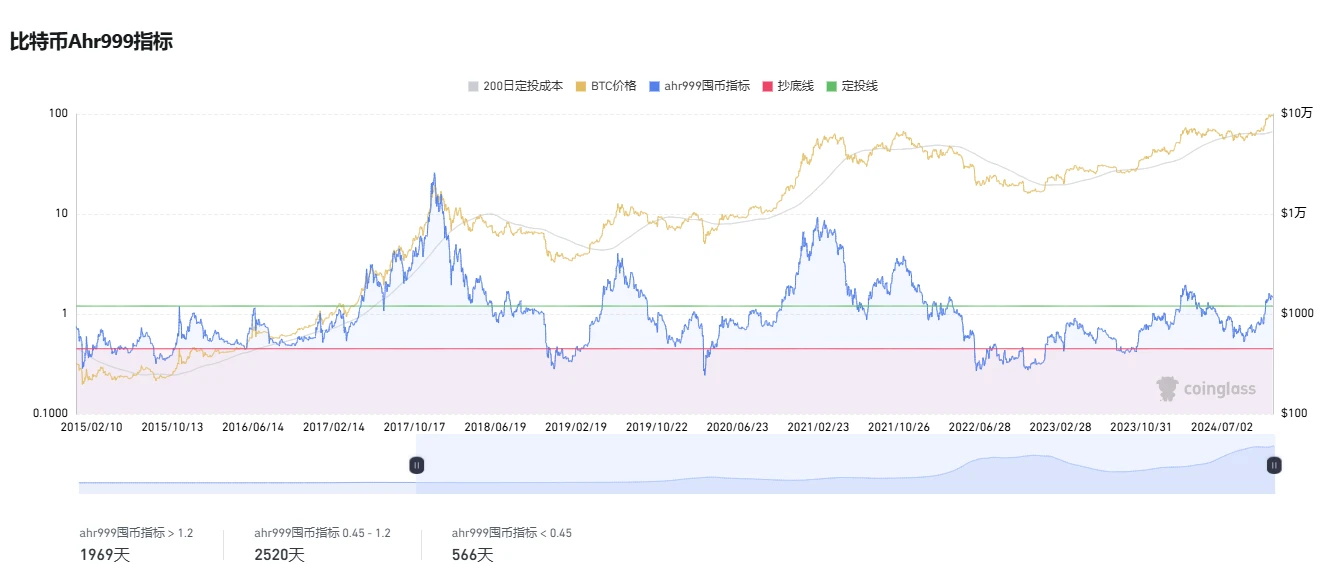
The Bitcoin AHR 999 Index is a parameter proposed by AHR 999 in 2018 to guide coin hoarding. According to AHR 999s statistics that year, 8.5% of the time the index was less than 0.45, which was defined as the bottom-fishing range ; 46.3% of the time it was between 0.45 and 1.2, which was defined as the fixed investment range ; and 29.3% of the time it was above 1.2, which was the stop-investment waiting range .
According to coinglass , the current value of the indicator is 1.49 , which is relatively close to the high of 1.75 in March this year, but still relatively far from the two peaks of 6 and 3.4 in 21 years .
PlanB: Bitcoin will rise to $150,000 in December
PlanB and his Stock-to-Flow model ( S2F ) became a legend during the bull market from 2019 to the first half of 2021 because it successfully predicted that Bitcoin would reach $55,000 at the beginning of 2021, but it went astray in the second half of 2021 and completely failed in 2022.
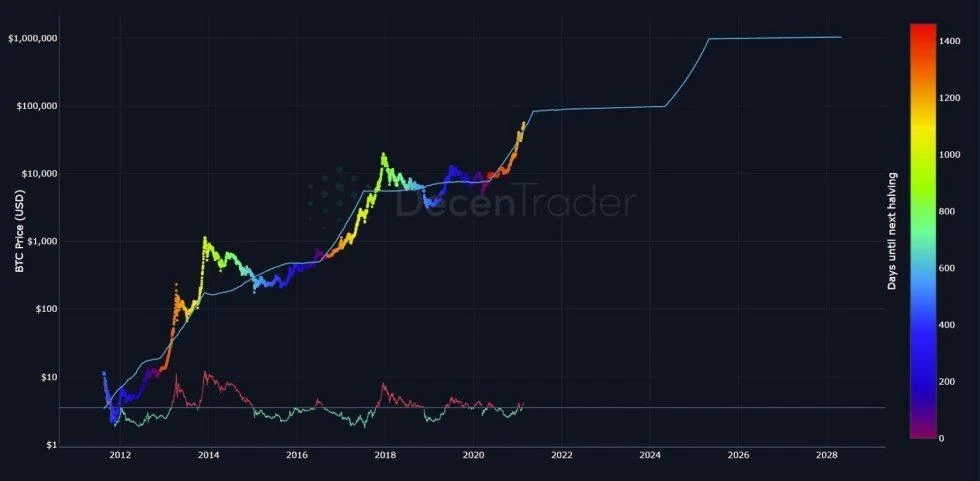
As Bitcoin once again leads the market, PlanB begins to return to the market. Yesterday, PlanB posted on the X platform that according to its speculation on Bitcoins market trend in the next few years released at the end of September, BTC has basically achieved the first two goals, namely, rising to $70,000 in October and $100,000 in November (actually $99,800 but close enough), and BTCs next goal is to rise to $150,000 in December .
Rate cut cycle
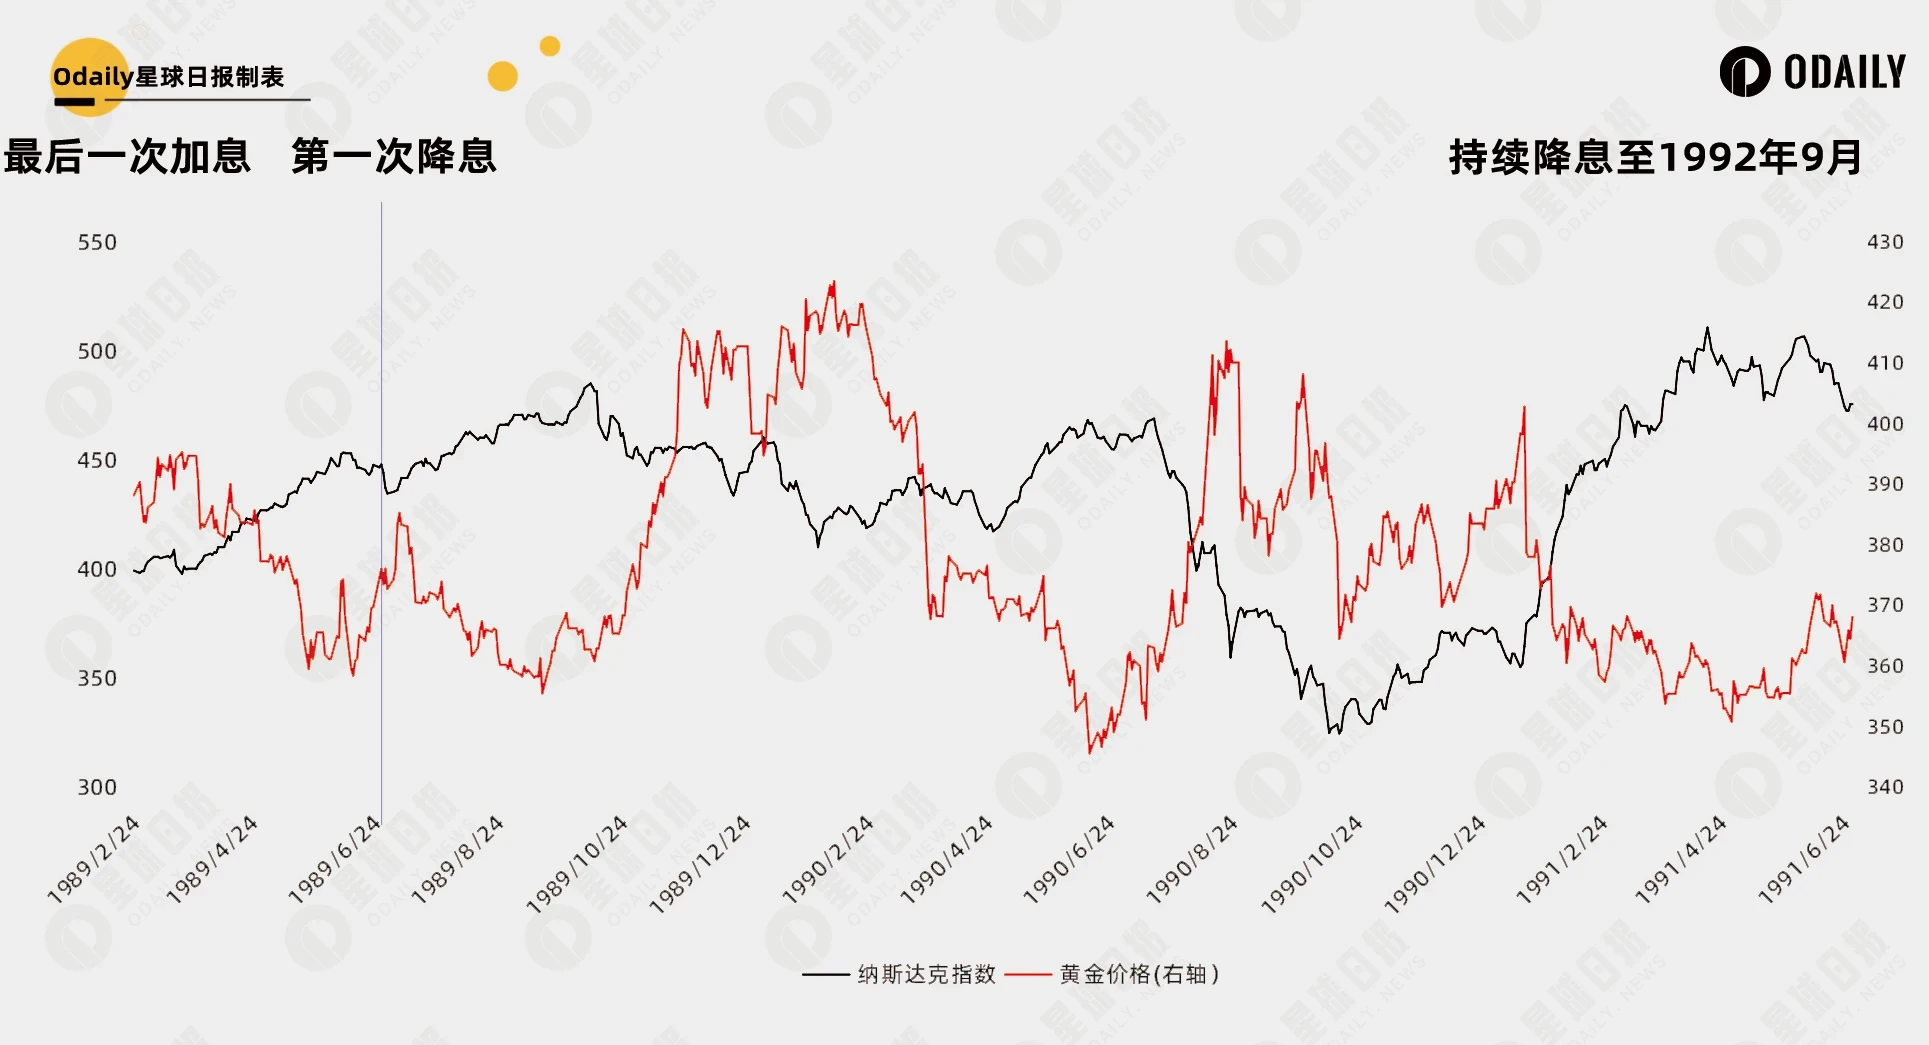
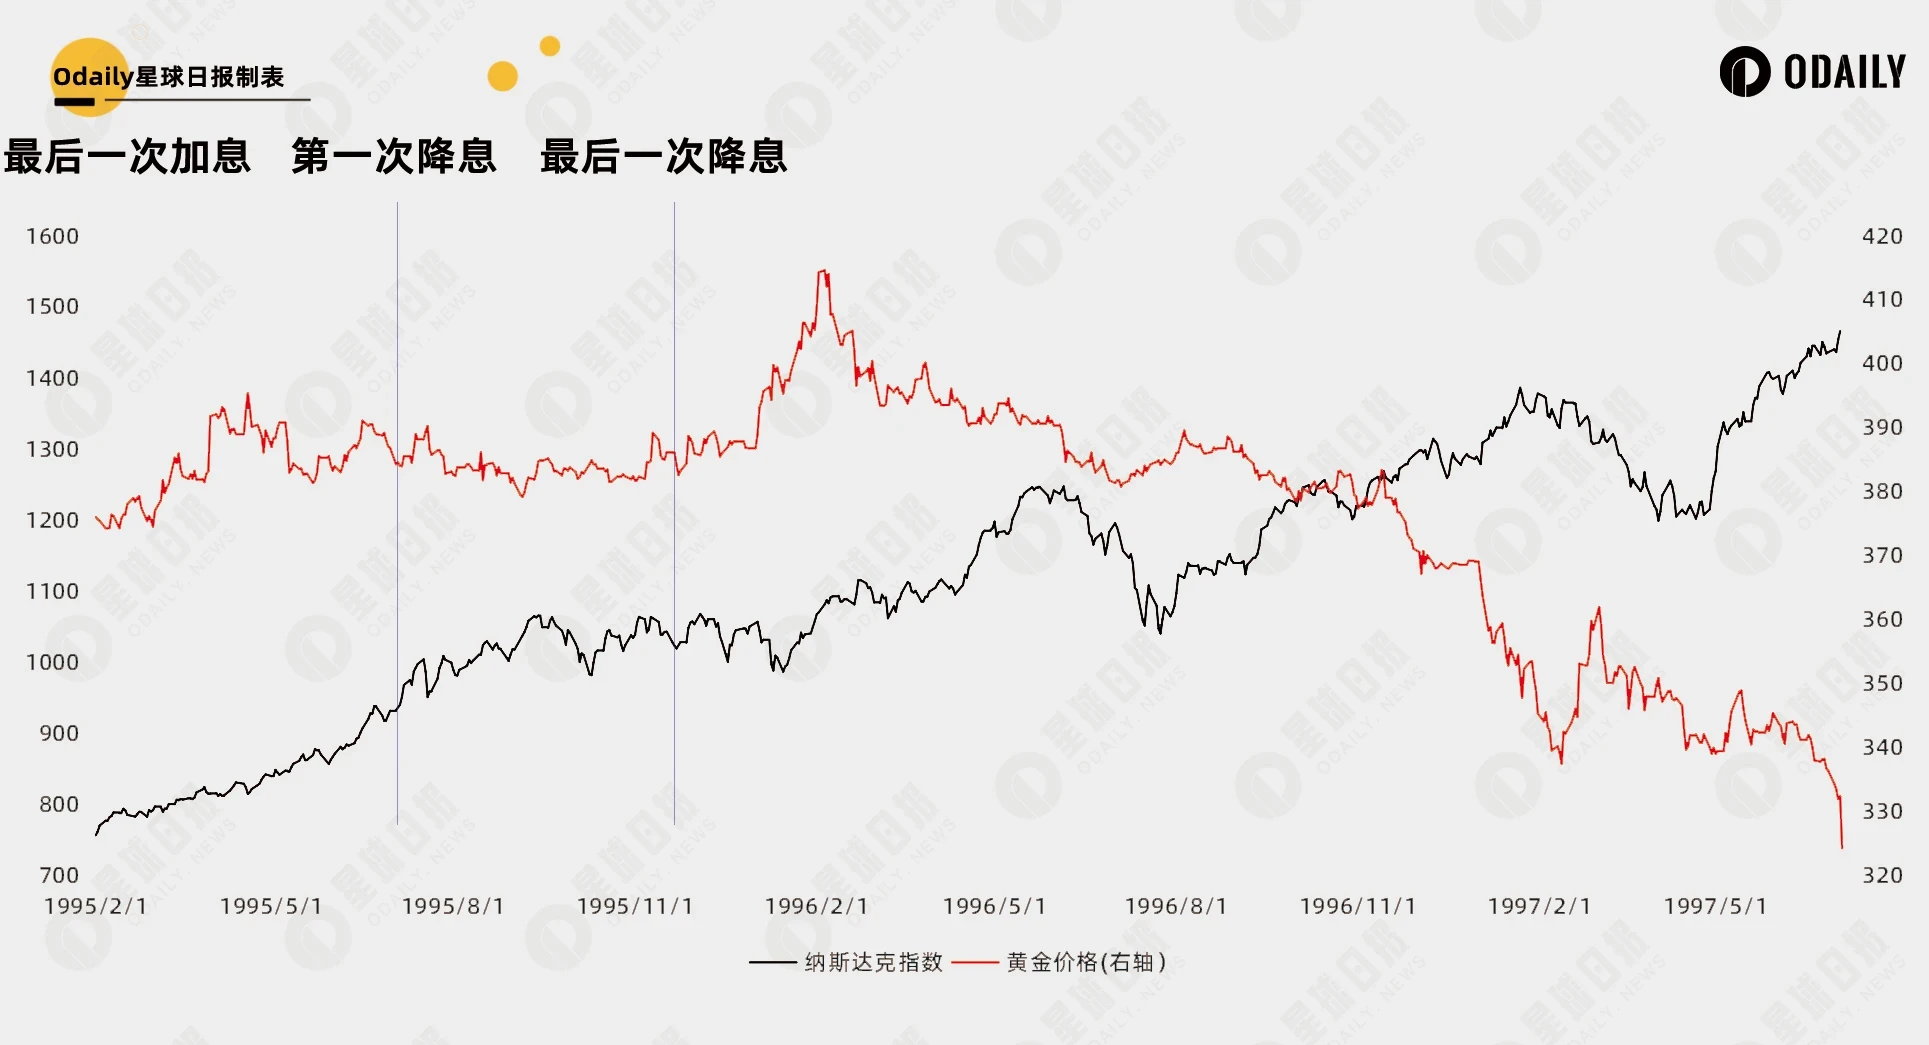
In the article Summarizing the 35-year U.S. interest rate cycle, can the interest rate cut in 36 days start the second bull market of Bitcoin? , the author summarizes the performance of U.S. stocks and gold in the past 35 years after the five interest rate cuts in the United States, and concludes that whether or not the interest rate is cut is not the fundamental reason for the markets ups and downs. The impact of the interest rate cut on the future market depends on the overall economic situation at that time. Is it to actively cut interest rates to promote economic development, or is it forced to cut interest rates due to a black swan event? From the perspective of U.S. stocks, it is a struggle between economic resilience and loose liquidity pricing.
If we want to compare the two, the current rate cut cycle is closest to the 1989 rate cut cycle. At that time, the United States experienced a seven-year expansion period and faced high inflation pressure in 1988-89. It responded to inflation by raising interest rates very high, with the highest interest rate close to 10%. In the following three years, the United States began to cut interest rates continuously, from 9.75% on February 24, 1989 to 3.00% on September 4, 1992.
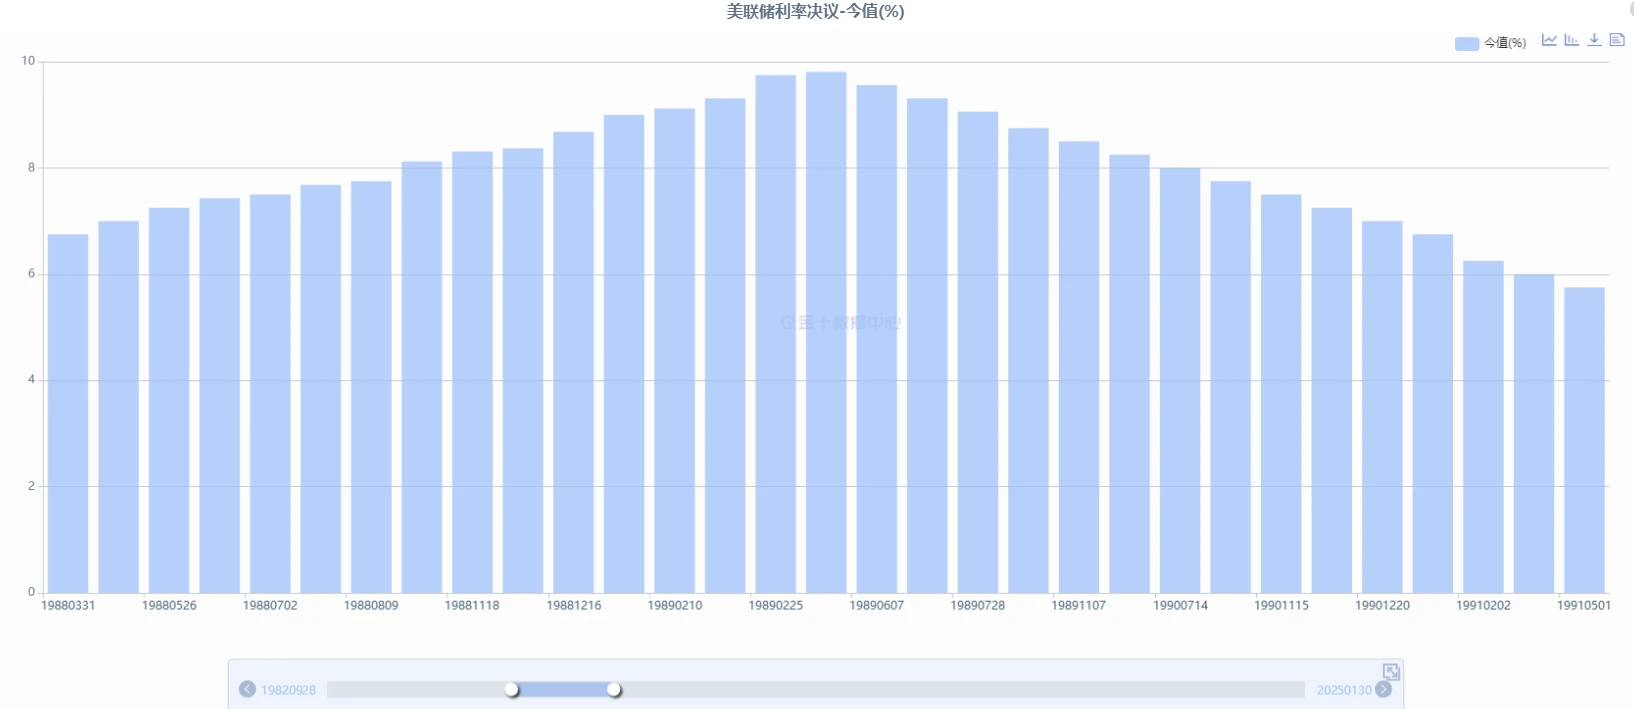
According to the dot plot released in September , the Feds interest rate is expected to drop by about 2% from the current 4.75% within two years. How did the interest rate trend after the historical rate cut? It can be divided into two stages, 1989 and 1995. The US stock market continued to fluctuate during the first three years of the rate cut cycle. The rate cut stopped in 1992 and lasted for two years. After a short precautionary rate hike in 1994, there was no more significant interest rate adjustment, and then the US stock market started a continuous bull market. Therefore, from the perspective of macro fundamentals, we are still in the early and middle stages.
Other classic indicators
Fear and Greed Index
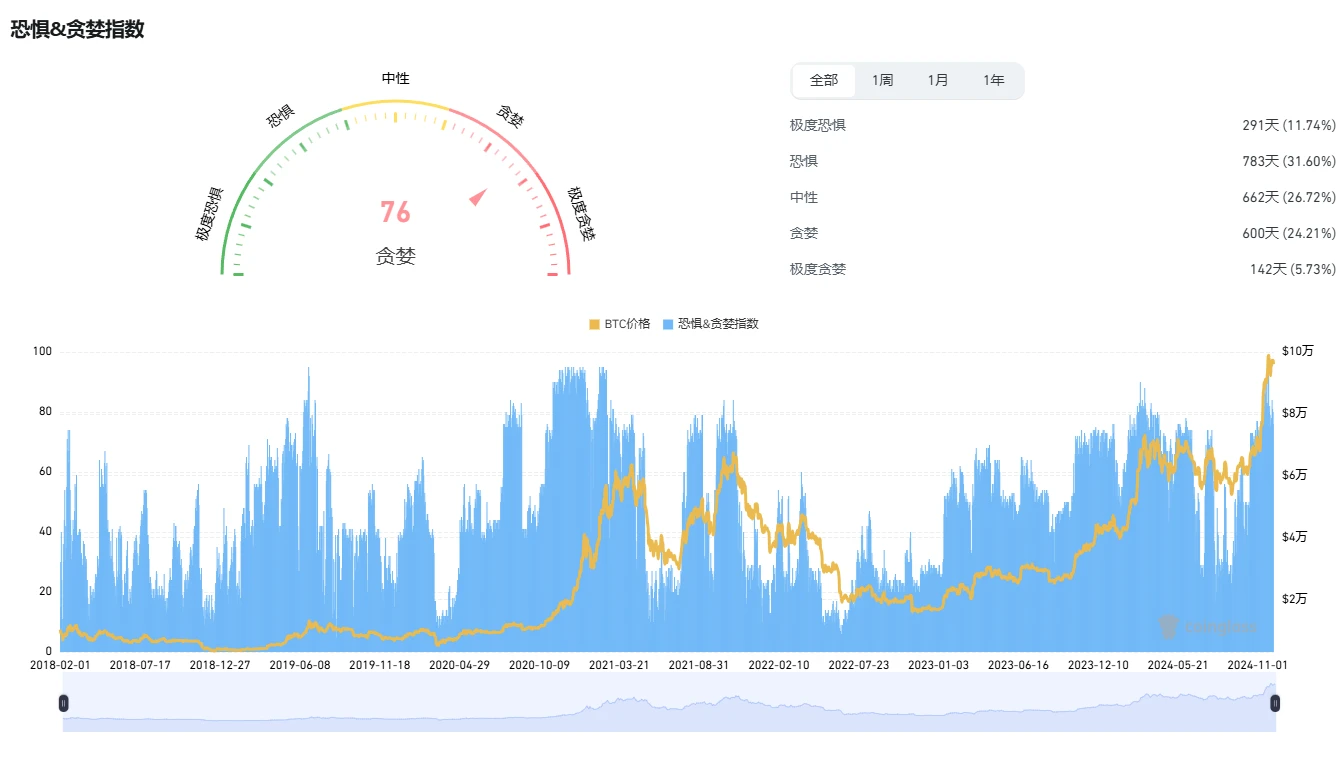
Todays greed index is 76, which has declined from its highest point. The recent highest point was 94 on November 22 , when the price of Bitcoin was $95,829. This greed value exceeds that of November 21 and March 24, and is at the same level as the peak value of 95 in February 21.
200-week moving average
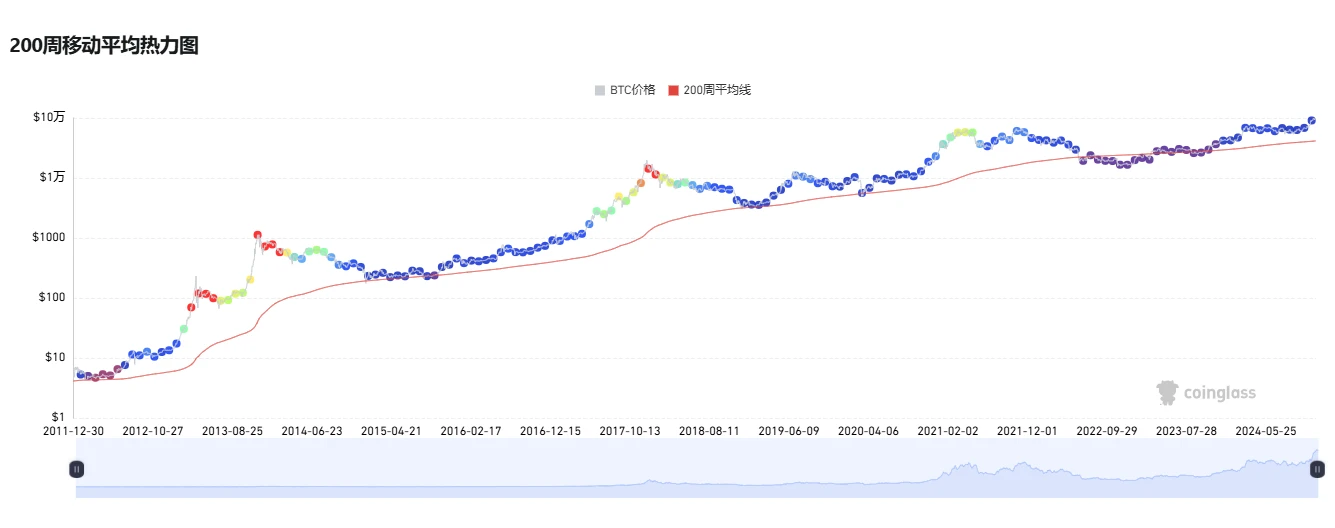
Historically, the price of Bitcoin usually bottoms out near the 200-week moving average, and a sharp deviation from the average indicates a peak. At the peak in 21 years, the price of Bitcoin was about 4 times the 200-week average, while the current price is about twice (96,500: 41,500), which is still at a relatively low point .
