Original author: Frank, PANews
The crypto market is once again enjoying a carnival. On December 5, Bitcoin broke through the $100,000 mark. Other altcoins also began to surge against this backdrop. Previously, PANews conducted a market analysis of the mainstream tokens in the overall market. Over 60% of the tokens have risen by more than 100% in the past month. (Related reading: The altcoin season is here! Data analysis of the performance of 289 tokens, 60% of which rose by more than 100%, with public chains and MEME being the hottest )
As the market is improving, investors are looking for targets that may be undervalued. Among many tracks, DeFi projects can be more easily quantified through data such as TVL and fees. In this regard, PANews conducted data analysis based on Defillama and Coingeckos DeFi-related tokens to see which projects are likely to be undervalued by the market from a data perspective.
Data description: The data for this analysis was taken from December 5, 2024. The data of 86 DeFi-related projects or public chains were analyzed, and then compared and analyzed after being summarized using the API program. Among them, the market value data and transaction volume data are from Coingecko, and the transaction volume refers to the 24-hour transaction volume of the token. TVL and fee data are from Defillama.
TVL perspective: 42 DeFi projects are relatively undervalued
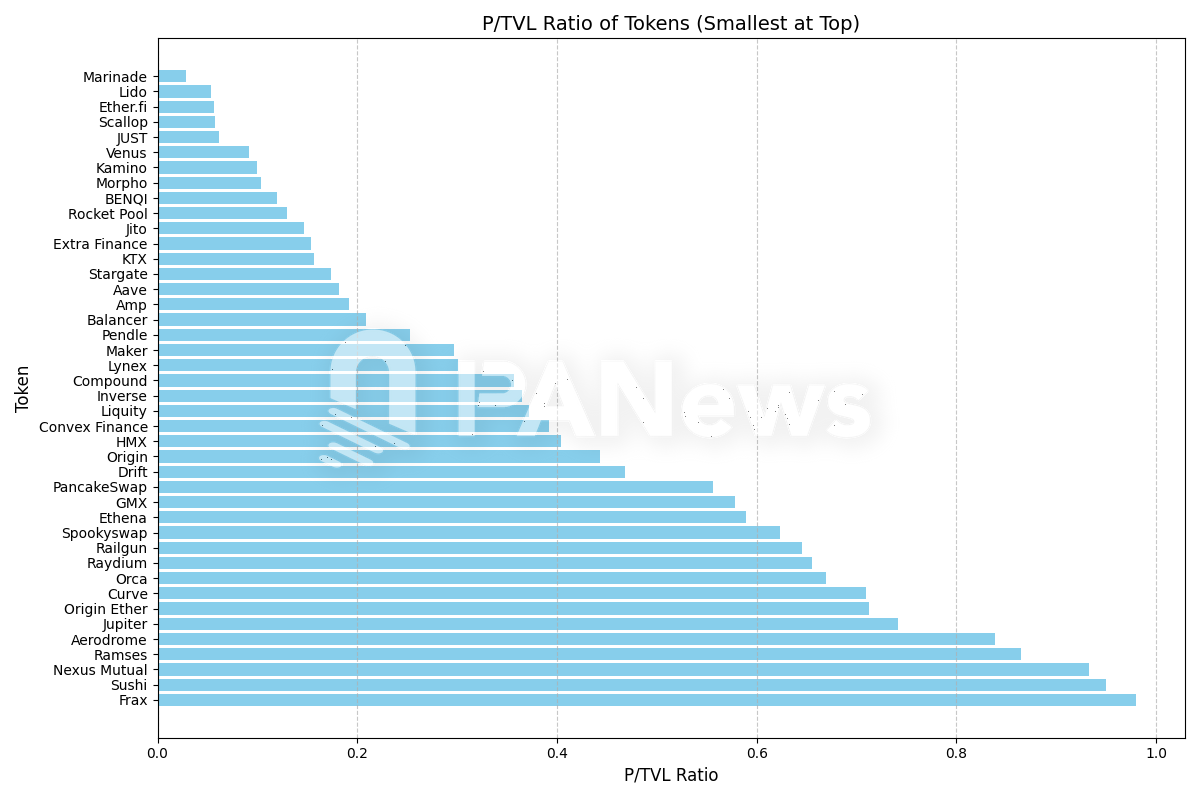
For DeFi projects, TVL (total value locked) is almost the most important metric. Generally speaking, the larger the TVL, the more funds deposited on the protocol, which means that the protocol has a thicker capital pool and better user recognition. As for projects that have already issued tokens, the P/TVL data has a certain reference value. If P/TVL is less than 1, it means that the TVL of this project has exceeded the total market value of the token and may be at a level that is underestimated by the market. If P/TVL is greater than 3, it means that the market believes that the token of the protocol has a high growth potential or the locked value provided by the protocol is considered insufficient.
After data analysis, we can see that among the samples, 42 tokens have a P/TVL less than 1. Among them, Marinade, Lido, Ether.fi, Scallop, JUST, Venus, Kamino, Morpho, BENQI, Rocket Pool and other projects have the lowest values and are ranked in the top ten.

Among these projects, TVL data of Lido, Aave, Ether.fi, JUST, Maker, Ethena, Amp, Pendle, Jito, and Compound are in the top ten. These are also DeFi projects that have dominated the list for a long time, and they are high TVL and low market value projects. According to the latest data disclosed by Grayscale, as of December 5, 2024, the investment portfolio of Grayscale DeFi Fund consists of 5 tokens: $UNI, $AAVE, $MKR, $LDO, and $SNX. Among Grayscales holdings, $AAVE, $MKR, and $LDO are also at the forefront of P/TVL values less than 1.
Among the tokens with a P/TVL of less than 1, KTX.Finance has the lowest market value, with a market value of only $568,000 for its token KTC, but a TVL of $8.5 million. However, there are only a few trading markets for this token, and the total number of transfers on Arbitrum is only 35,000, indicating poor on-chain activity. In addition, some projects with lower market value include Ramses, HMX, Lynex, Scallop, Spookyswap, Extra Finance, Inverse, etc.
It is worth mentioning that in the ratio of TVL to market value, we can see that the ratios of several popular DEX protocols on Solana are less than 1, such as Raydium, Jupiter, Orca, etc. These projects account for more than 80% of the transaction volume on the Solana chain, but the market value of their tokens is lower than TVL.
What are the most profitable DeFi projects?
In addition to TVL, fees are also an important indicator for measuring the activity and profitability of DeFi projects. However, the reference method of fees is slightly different from TVL. In the fee calculation process, PANews focuses on using the total fee income of the last 30 days to calculate the average daily fee value, and then multiplies this fee value by 365 to simulate the expected annual fee based on the current fee level. This predicted annual fee is compared with the market value and the current total fee.
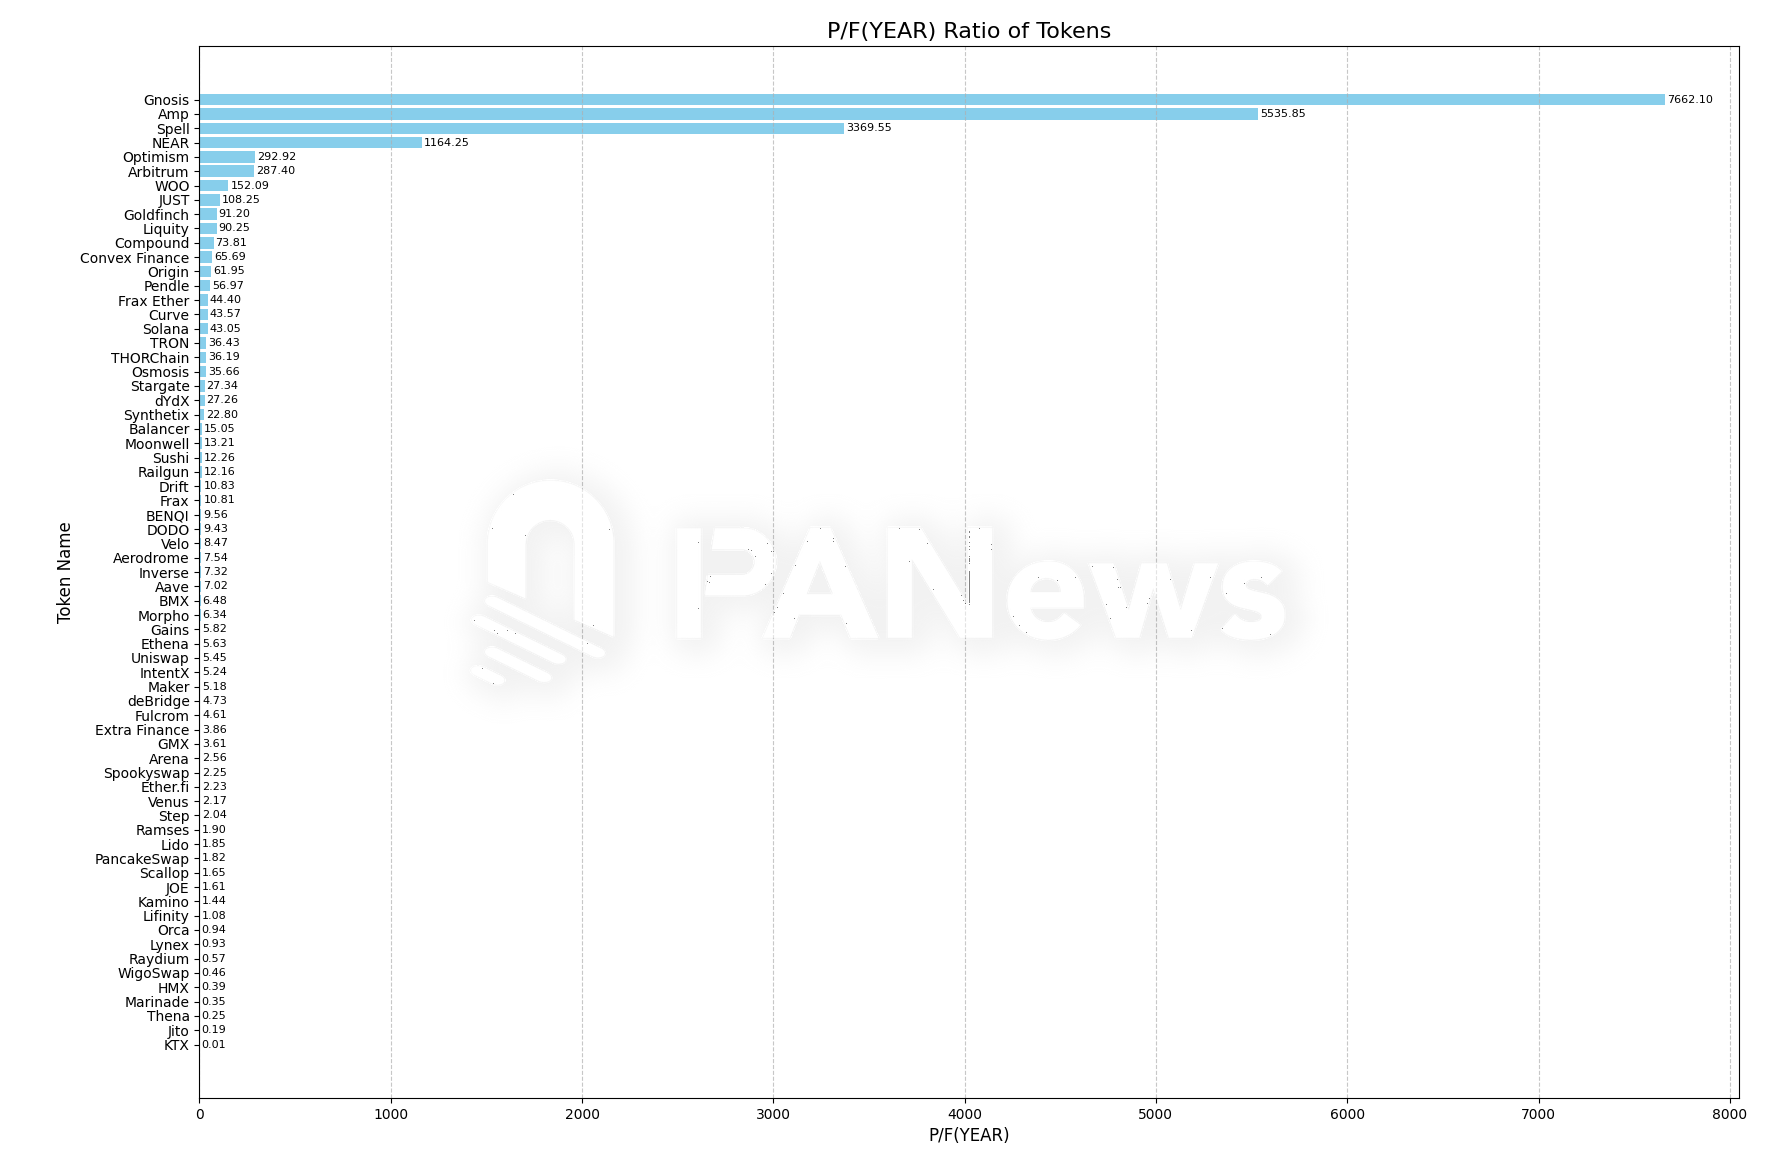
First is the ratio of annual expenses to market value. This ratio is very similar to the PE of a company in the traditional financial market. We refer to it as PF here. If the PF is less than 10, it means that the project is undervalued. The value between 10 and 20 is generally a reasonable range. 20 to 50 is a project with high growth expectations. If it is greater than 50 times, it is likely to be overvalued.
In this analysis, 38 projects have a PF value of less than 10, among which Lifinity, Orca, Lynex, Raydium, WigoSwap, HMX, Marinade, Thena, Jito, and KTX are among the top ten with the smallest values.

However, one thing to note here is that the high PF value of some projects does not necessarily mean that the valuation is overvalued. Rather, the cost generation mechanism of some projects is very low, especially when considering the PF value of the public chain. This data is usually more meaningful in some tools and decentralized exchanges or lending protocols.
In addition, among the 86 data analyzed, the predicted annual costs of 28 projects exceeded the total costs. This data means that if the current cost level is followed, the costs incurred by these projects in the next year will exceed the sum of past costs. It also shows that the activity and profitability of these projects are gradually increasing. The top ten projects in this data are Raydium, Jito, Solana, Thena, Ethena, Ether.fi, Orca, Aerodrome, Kamino, and KTX. Of course, when examining this data, the launch time of the project should also be considered. For example, for projects such as Ether.fi, which has been online for less than a year, the predicted annual costs will certainly exceed the total costs.
In addition, there is another indicator dimension to consider, which is the ratio between the token trading volume and market value. Generally speaking, if this ratio is greater than 0.1, it means that the market activity and liquidity of the token are good. Among these tokens, there are 51 projects with a V/P greater than 0.1.
8 projects combined several underestimated indicators

After screening in multiple data dimensions (P/TVL less than 1, V/P greater than 0.1, P/F(YEAR) less than 10, estimated annual cost greater than total cost), a total of 8 projects meet this condition: Raydium, KTX, Inverse, Aerodrome, Jito, Ethena, Morpho, Ether.fi. However, in the investigation of these projects, further judgment is needed based on the time of coin issuance, the online market, and community activity.
In addition, when judging whether a DeFi project is undervalued, it is often possible to make an estimate by comparing the indicators of some leading projects such as Uniswap and Sushi.
Finally, there are still some additional explanations about the judgment of the underestimation level of DeFi projects. The above data screening method is not absolute. The market performance of a token often depends on situations other than data. Unless the market is rational enough, it is possible to influence the trend completely according to the data model. In addition to the above data, there are many factors to consider, such as user activity, marketing, and project type. (The above analysis is in a sense a figment of the imagination and cannot be used as an investment basis. The market is risky and you need to be cautious when entering the market!)
All the specific data are here for readers reference.


