


Key Metrics (February 3-10 at 4pm Hong Kong Time)
BTC/USD rose 2.5% ($95.1k -> $97.5k), and ETH/USD rose 2.3% ($2.58k -> $2.75k).
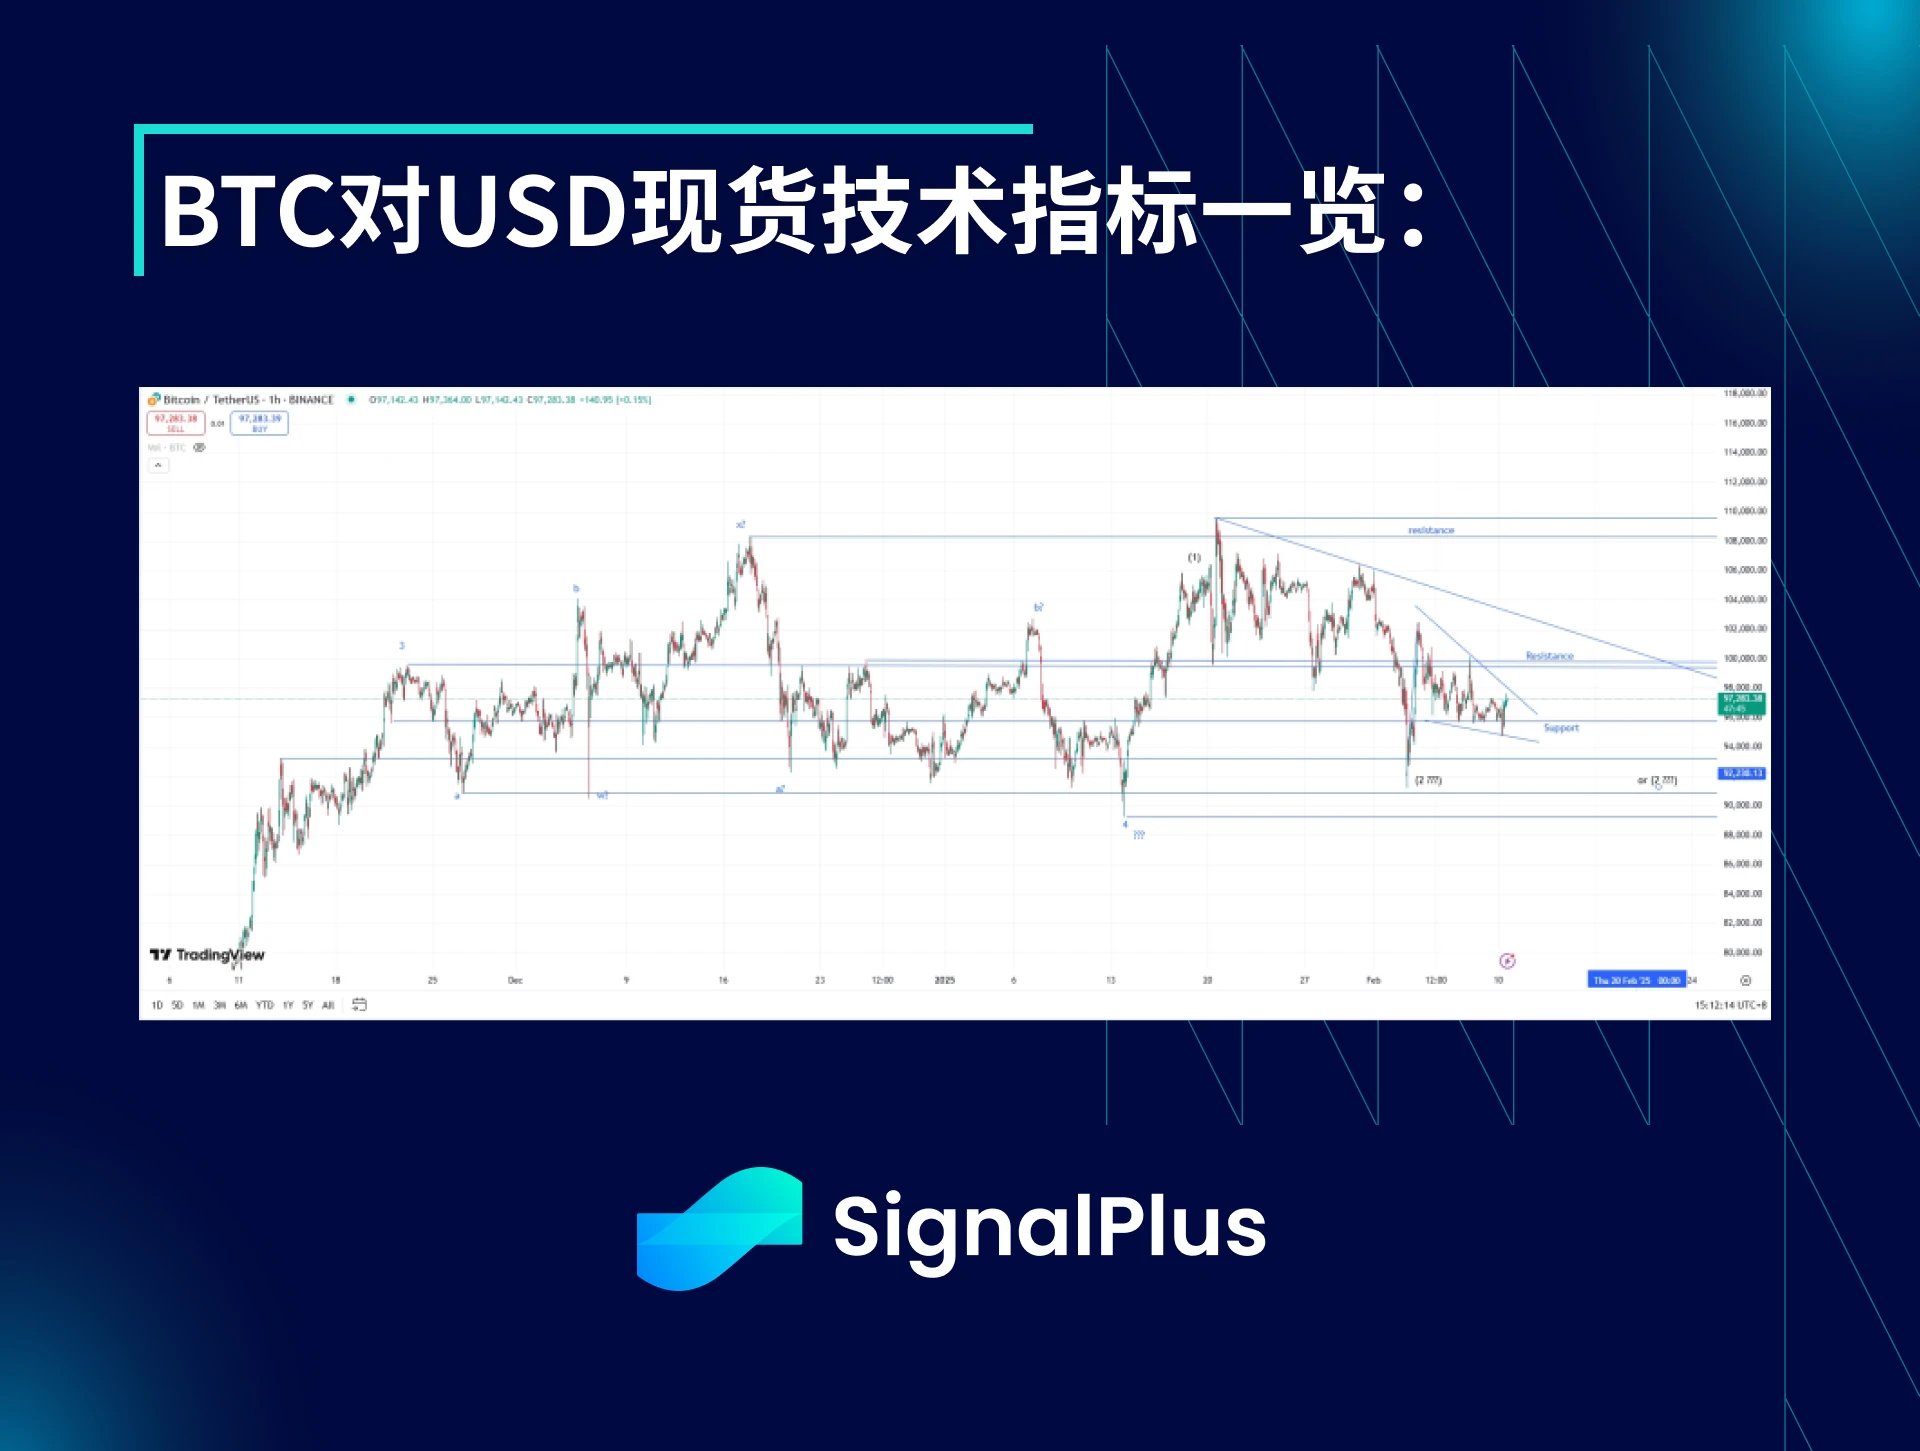
Last Mondays liquidation-induced decline (to $91k) quickly reversed, initially being lifted by the squeeze to $102k, and then forming a somewhat boring one-sided wedge pattern, which caused a compression of realized volatility. As the short-term price range continues to compress, we may see a turning point in price in the next trading sessions. Below the current price, there is strong support from $96k all the way to $93k, and further major support range is $91-89k. Given last weeks liquidations, the current market position may be clearer. Above the price, the $100k resistance level was strongly rejected after the release of the non-farm data on Friday, and there is resistance at $102k higher. After the price breaks this point, the technical chart will see a clear trend higher until we re-test the major overhead resistance between $108k-110k and the all-time high.
The lack of clear breakout momentum in the market may lead to a prolonged sideways trend. This trend will become more pronounced over the next 2-3 weeks if the price correction that started in December (or the price correction of the pre-inauguration rally) continues. Long-term we still expect a significant rise above $120k, but if the $89k support level is breached, the correction could extend downwards. Note that a breakout of this level does not negate the view that the price will continue to rise (but a drop to $60-65k would).
Market Theme
Market fears of a global trade war peaked last Monday. But Trump quickly dispelled market concerns by postponing the tariff increase less than 24 hours after the announcement, following constructive talks with the leaders of Mexico and Canada. Although the tariffs on China have already taken effect, the market had expected them. Things could still change after Trumps next conversation with President Xi Jinping.
Risk assets gradually recovered this week, with the SP 500 back above 6,000. The non-farm payrolls data, while lower than the expected, was more in line with private discussions, while interest rates and stocks reacted rather calmly. Overall, the macro backdrop remains supportive of risk assets, despite the tail risks of an escalation in the trade war and geopolitical turmoil.
Cryptocurrencies quickly moved on from Monday’s liquidation (Bitcoin dropped to as low as $90k and Ethereum reached a staggering low of $2100) and surged to $102k on Monday night after Trump’s cryptocurrency commissioner Sacks announced a press conference on Tuesday to “outline the administration’s plans for digital assets”. The market ultimately fell short as the relevant timeline was pushed back (to within 170 days), causing Bitcoin prices to fall back to the $95-98k range for the rest of the week. It looks like the catalyst for the Trump administration will not take effect until the second quarter.
BTC ATM Implied Volatility
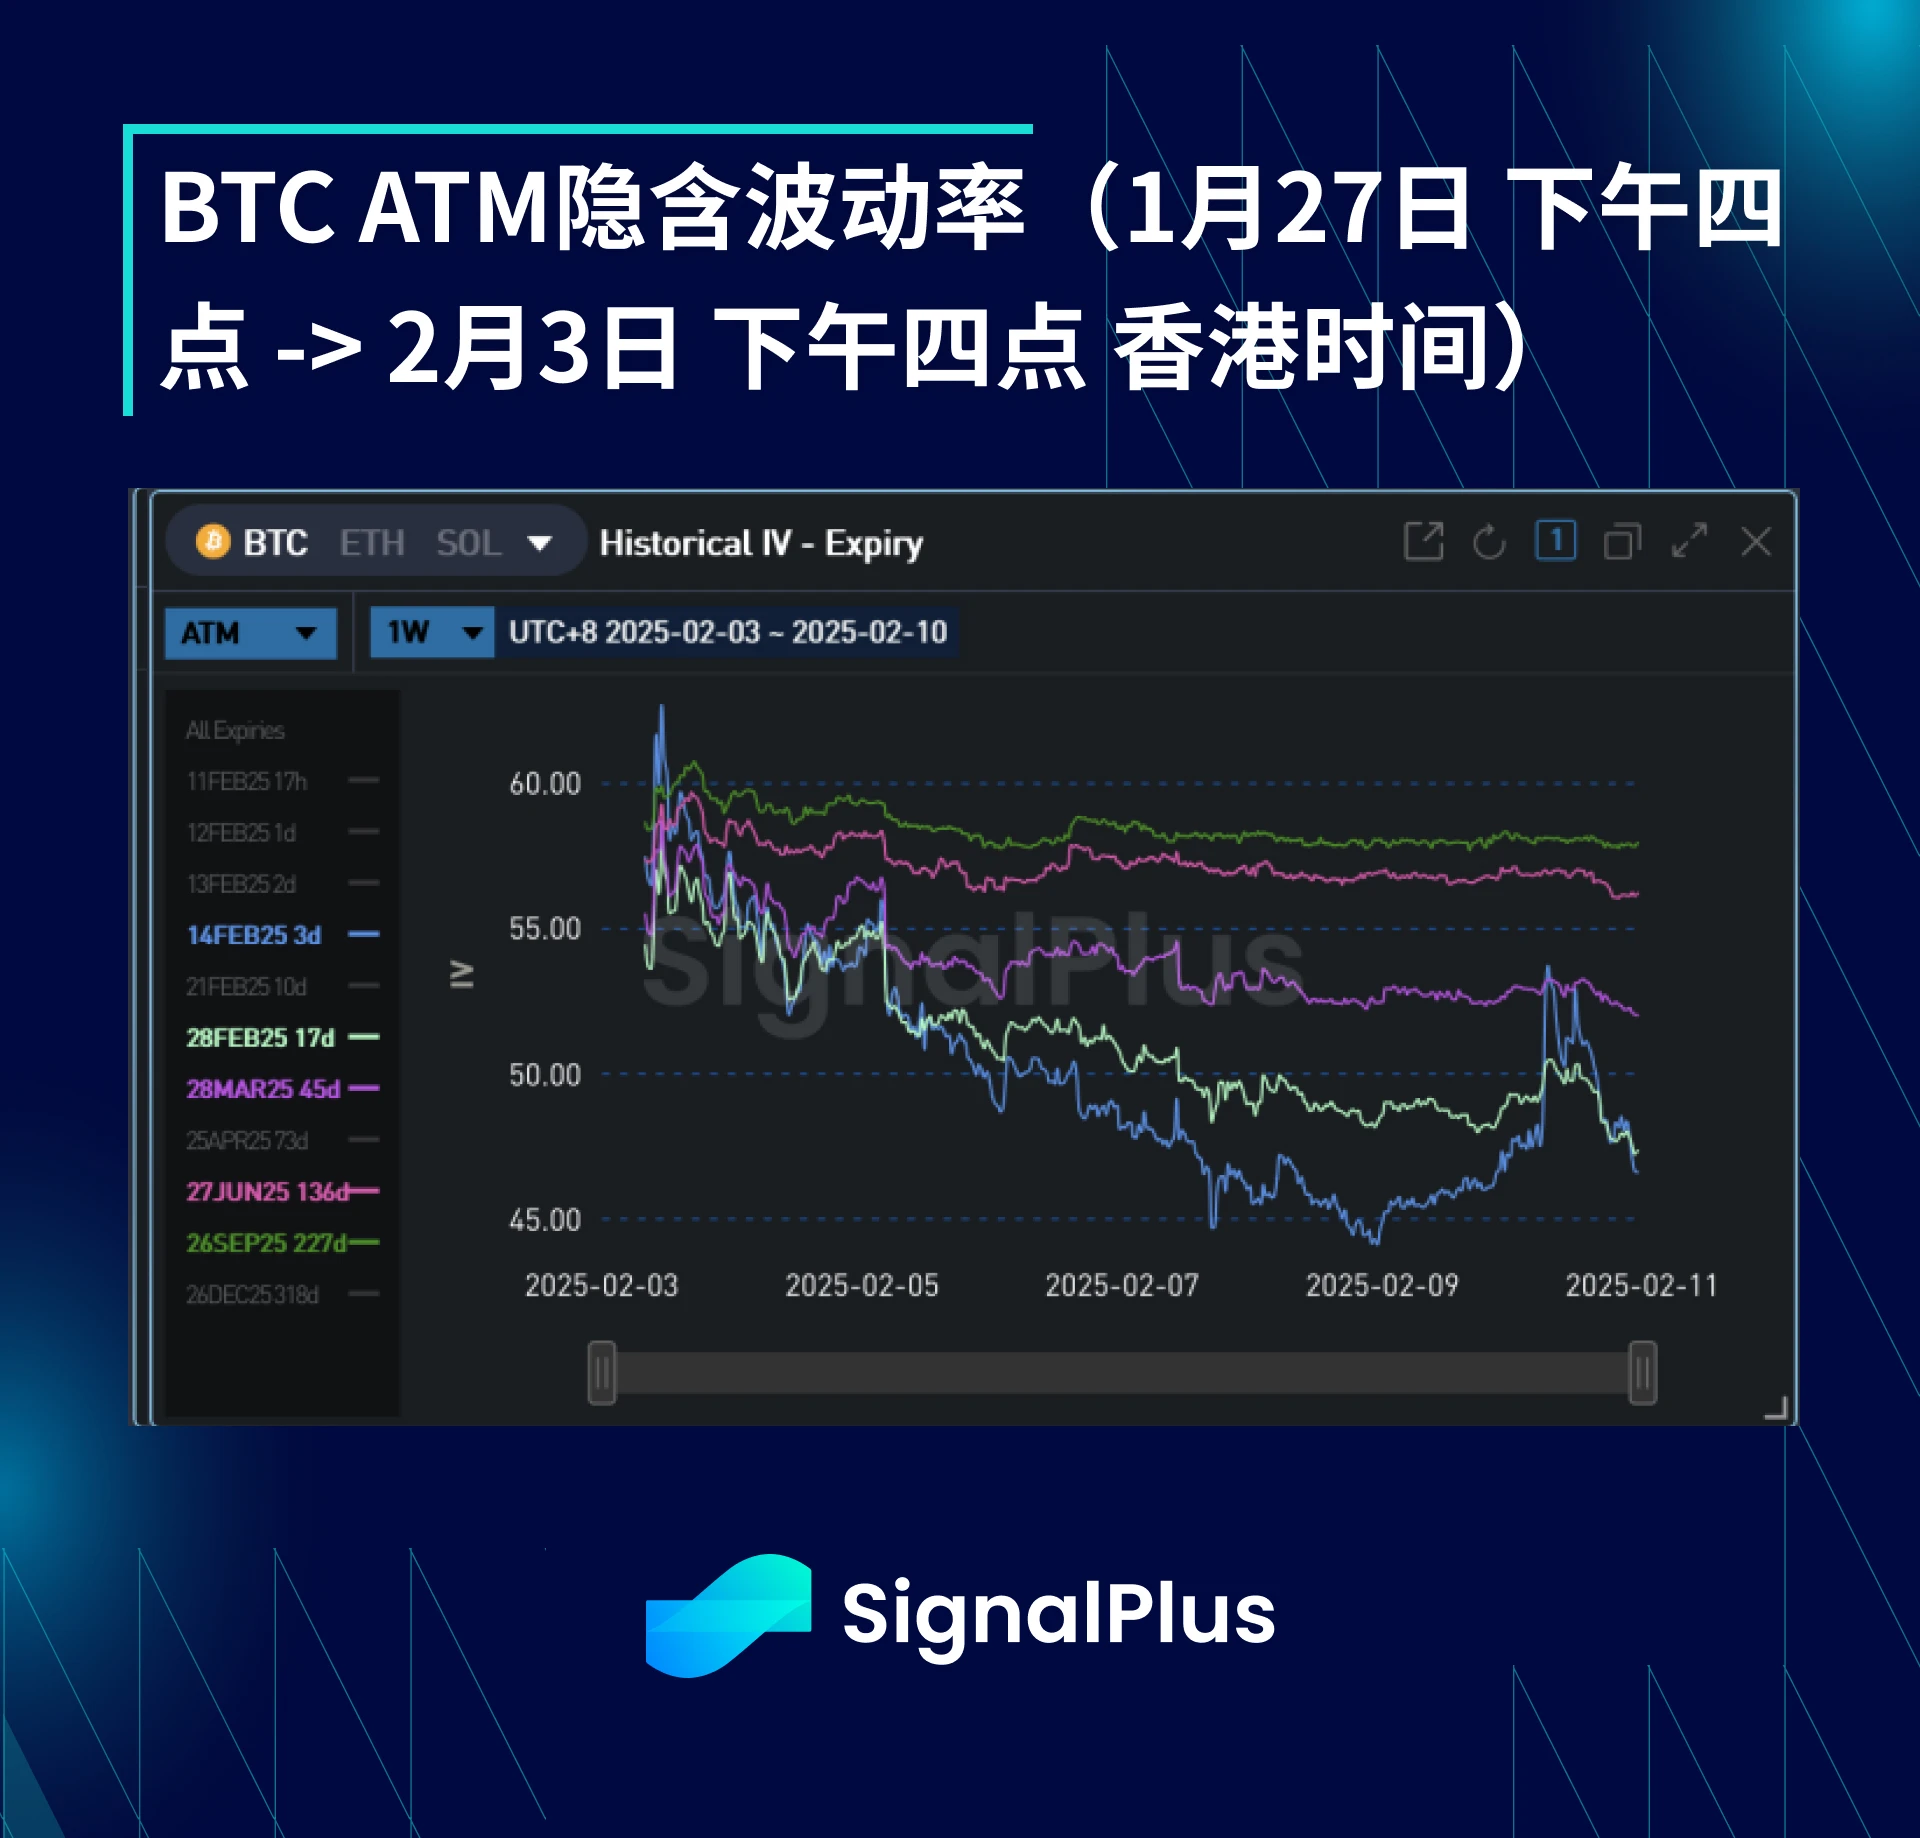
After the price drop caused by Mondays liquidation quickly subsided, the price returned to a more clear $95-100k. The market began to clear the structural upper positions prepared for the first quarter after the 2024 election, and implied volatility fell sharply. The last glimmer of hope was Sachs press conference on February 5, which caused short-term implied volatility to oscillate higher in anticipation of actual news about reserve inventories. However, there was nothing to note about this meeting except that the schedule was further postponed, so the market further cleared positions for the first quarter and pushed down implied volatility. Last week, both high-frequency and daily realized volatility were actually locked in the 50s, but most of it was due to the excessive rise caused by the reversal of the price on Monday and the subsequent press conference.
One notable phenomenon is the steepening of the term structure as the market pushes out the time for the Trump administration-related catalyst to take effect. Since no substantive results are expected from Sachs in the next 90-180 days, the market continues to clear positions in February and March expirations, but positions in June and beyond remain. At the same time, the market saw a very large April/December calendar spread trade (sell April and buy December), which further steepened the term structure.
BTC Skewness/Kurtosis:
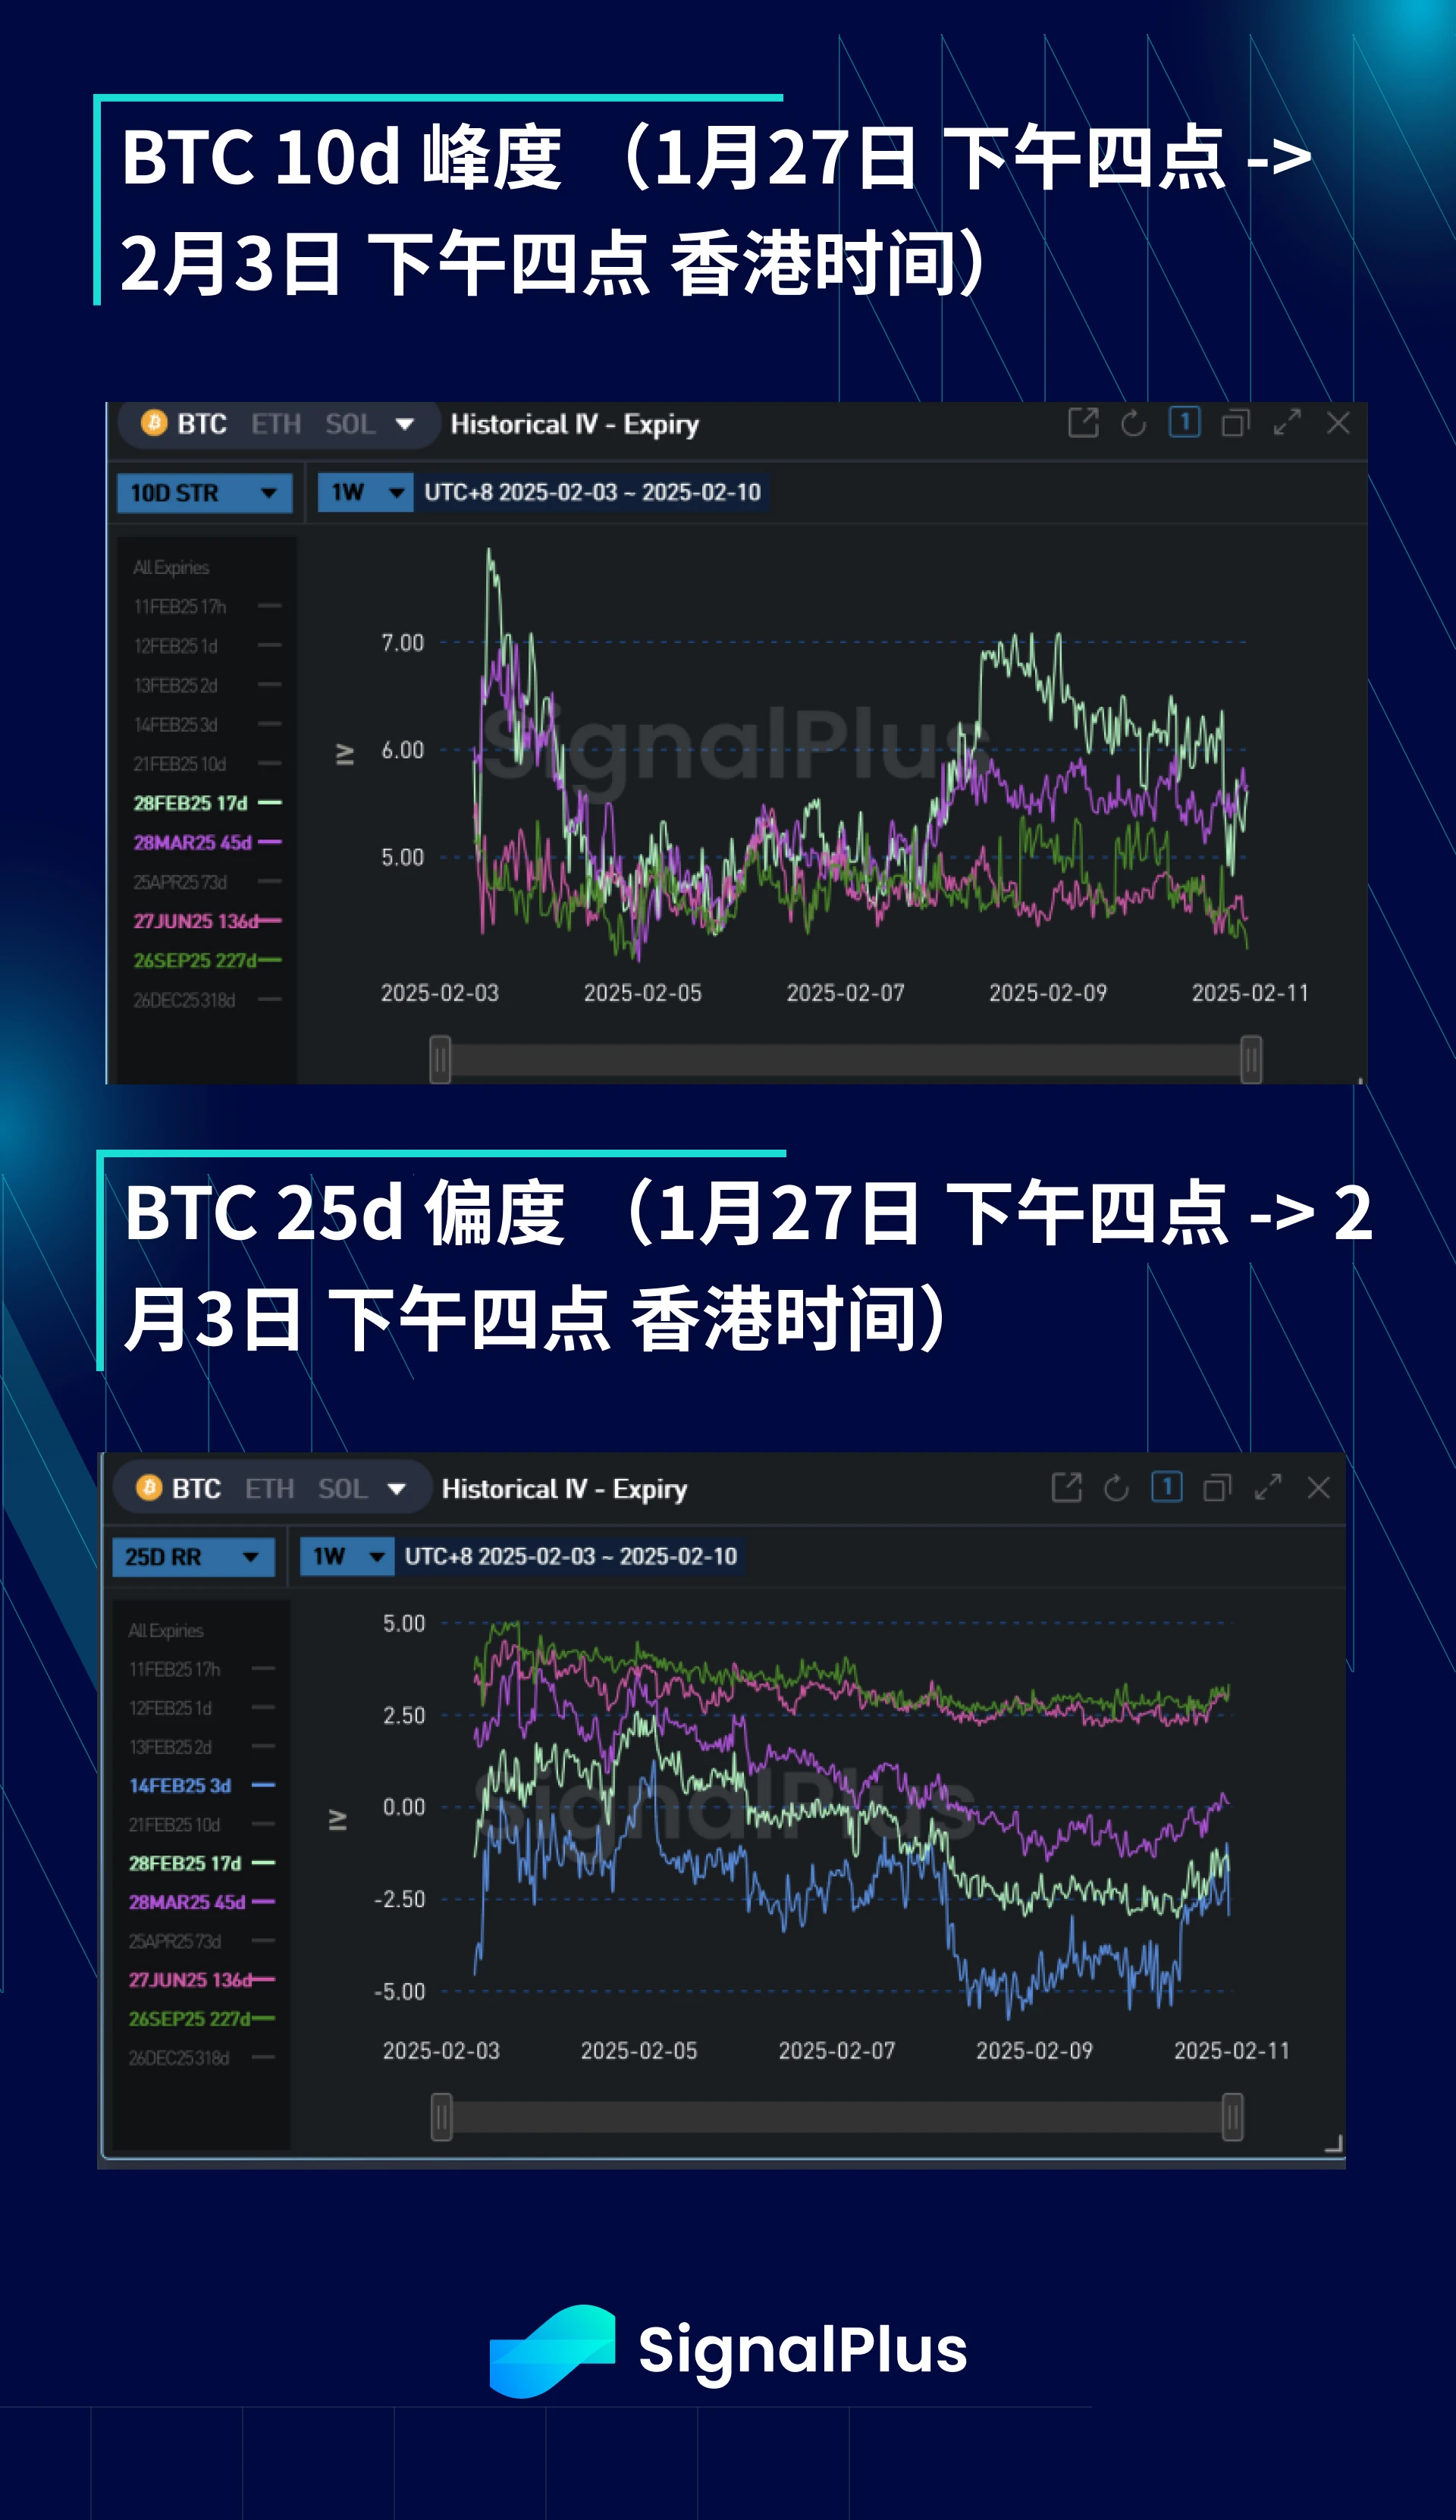
Skewness continues to decline in the short-term expiry as the market remains cautious about trade war/tariff-related risks to prevent crypto volatility from falling. On the other hand, the market does not seem to care about the tail risk on the upside in the short term, continuing to clear the upside call/call spread positions and further reduce the short-term skewness. Skewness remains high at June and later expiry dates as sentiment remains bullish in structure.
The kurtosis is quite flat except for the short-term expiration dates. The continued compression of the coin price volatility confirms that the market has no interest in the strike price within 95-100 thousand US dollars, and the market is very cautious about shorting the strike price outside this range, especially at the current relatively low implied volatility. The realized and implied volatility may rise rapidly due to the breakthrough of the coin price in any direction.
Good luck to everyone this week/month!

You can use the SignalPlus trading vane function at t.signalplus.com to get more real-time crypto information. If you want to receive our updates immediately, please follow our Twitter account @SignalPlusCN, or join our WeChat group (add the assistant WeChat, please delete the space between English and numbers: SignalPlus 123), Telegram group and Discord community to communicate and interact with more friends. SignalPlus Official Website: https://www.signalplus.com


