


Key indicators (March 17 at 4 pm -> March 24 at 4 pm Hong Kong time)
BTC/USD rose 4.1% (83,500 -> 86,900 thousand USD), ETH/USD rose 8.9% (1,900 -> 2,070)
BTC to USD spot technical indicators at a glance
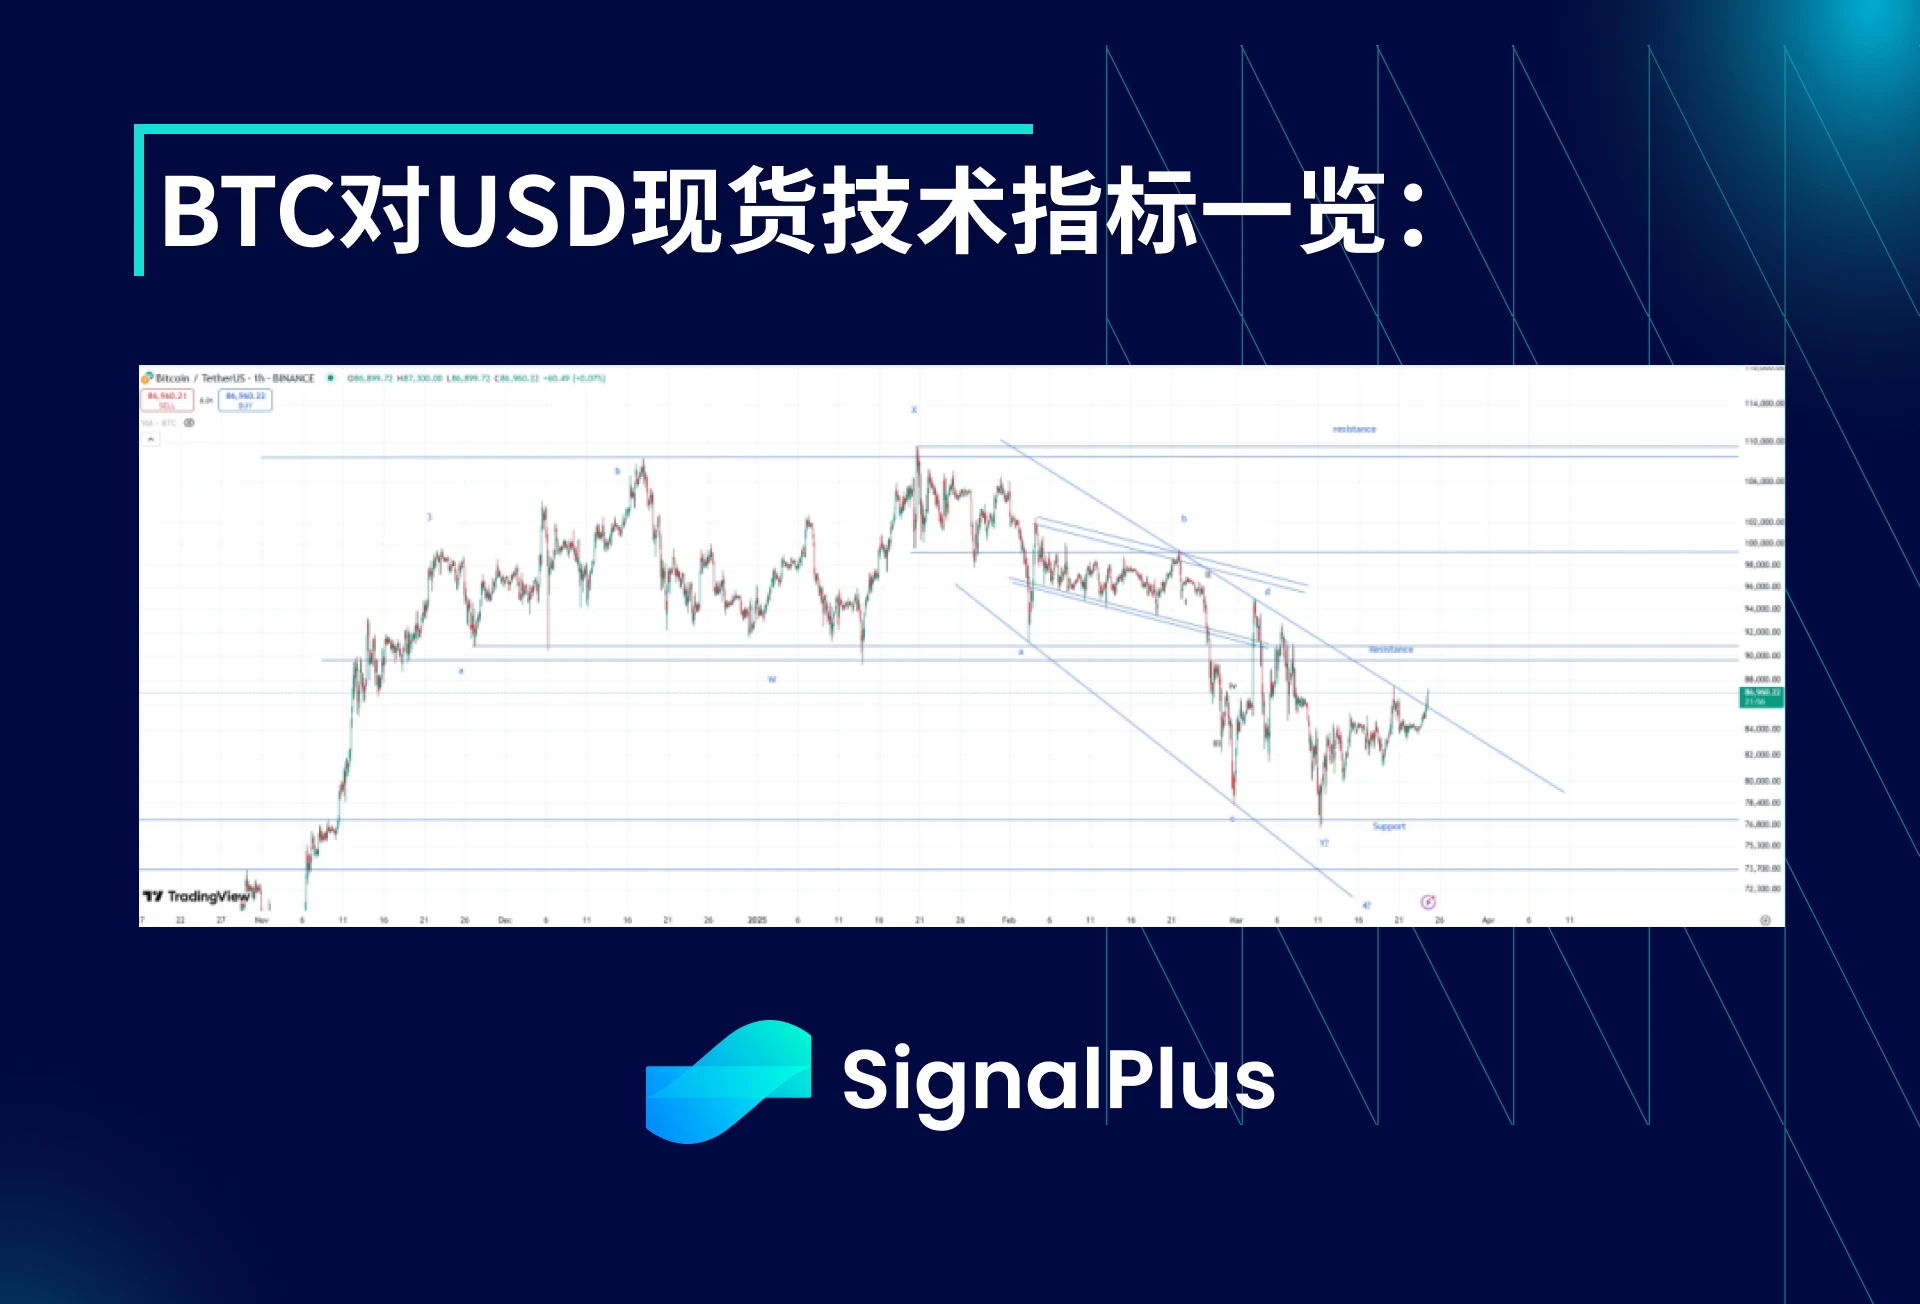
BTCs realized volatility finally started to decline last week as the price of the coin fluctuated fairly steadily between $81.5k and $87.5k. On March 24, the market looked to be testing the downtrend resistance line from the late February high. If it crosses $87.5k-88k, the price of the coin will re-test the resistance level of $91k, and $93k will be a resistance point above; if it continues to break through, the market will have enough momentum to test the more critical resistance level of $100k.
If the price of the currency falls in the opposite direction, the market will encounter strong support at $80,000, and then extend to $77,000, and be supported by small amounts of buying during the decline. After breaking through the key support of $73.5,000, we will face a larger correction space. After falling to $60-65,000, our current view is no longer valid, indicating that a more complex and long-term market turmoil is coming. In the medium term, we continue to be bullish on the price of the currency, and expect it to rise to $115-125,000 in the next few months or quarters.
Market Theme
Markets have been pretty quiet over the past week. Powell’s comments at Wednesday’s FOMC meeting removed the hawkish possibility, and the VIX finally fell back below the psychological 20 mark, ending the week at 19 (after a high of 29 two weeks ago), once again avoiding a government shutdown. Risk assets rallied further over the weekend as the April 2 tariff news revealed that more targeted measures may be taken. Although Trump’s behavior on this issue is very unpredictable, the current panic and pessimism about tariff policy has been priced into risk assets, so in the short term, the market’s reaction to the outcome of the tariff news will be asymmetric (i.e., the reaction to good news is greater than the continued bad news).
Back to cryptocurrencies, markets got excited again last Friday after learning that Trump would give an unscheduled speech at the New York Digital Asset Summit, but it turned out to be just a five-minute pre-recorded video. After briefly testing $87,000, the price of the currency pulled back to $83,000 over the weekend as risk assets showed signs of a decline, and then re-entered $87,000 on the positive tariff news. ETH also successfully broke through the short-term resistance and continued to show a more sustainable rise after breaking through $2,000 on Thursday.
BTC Implied Volatility
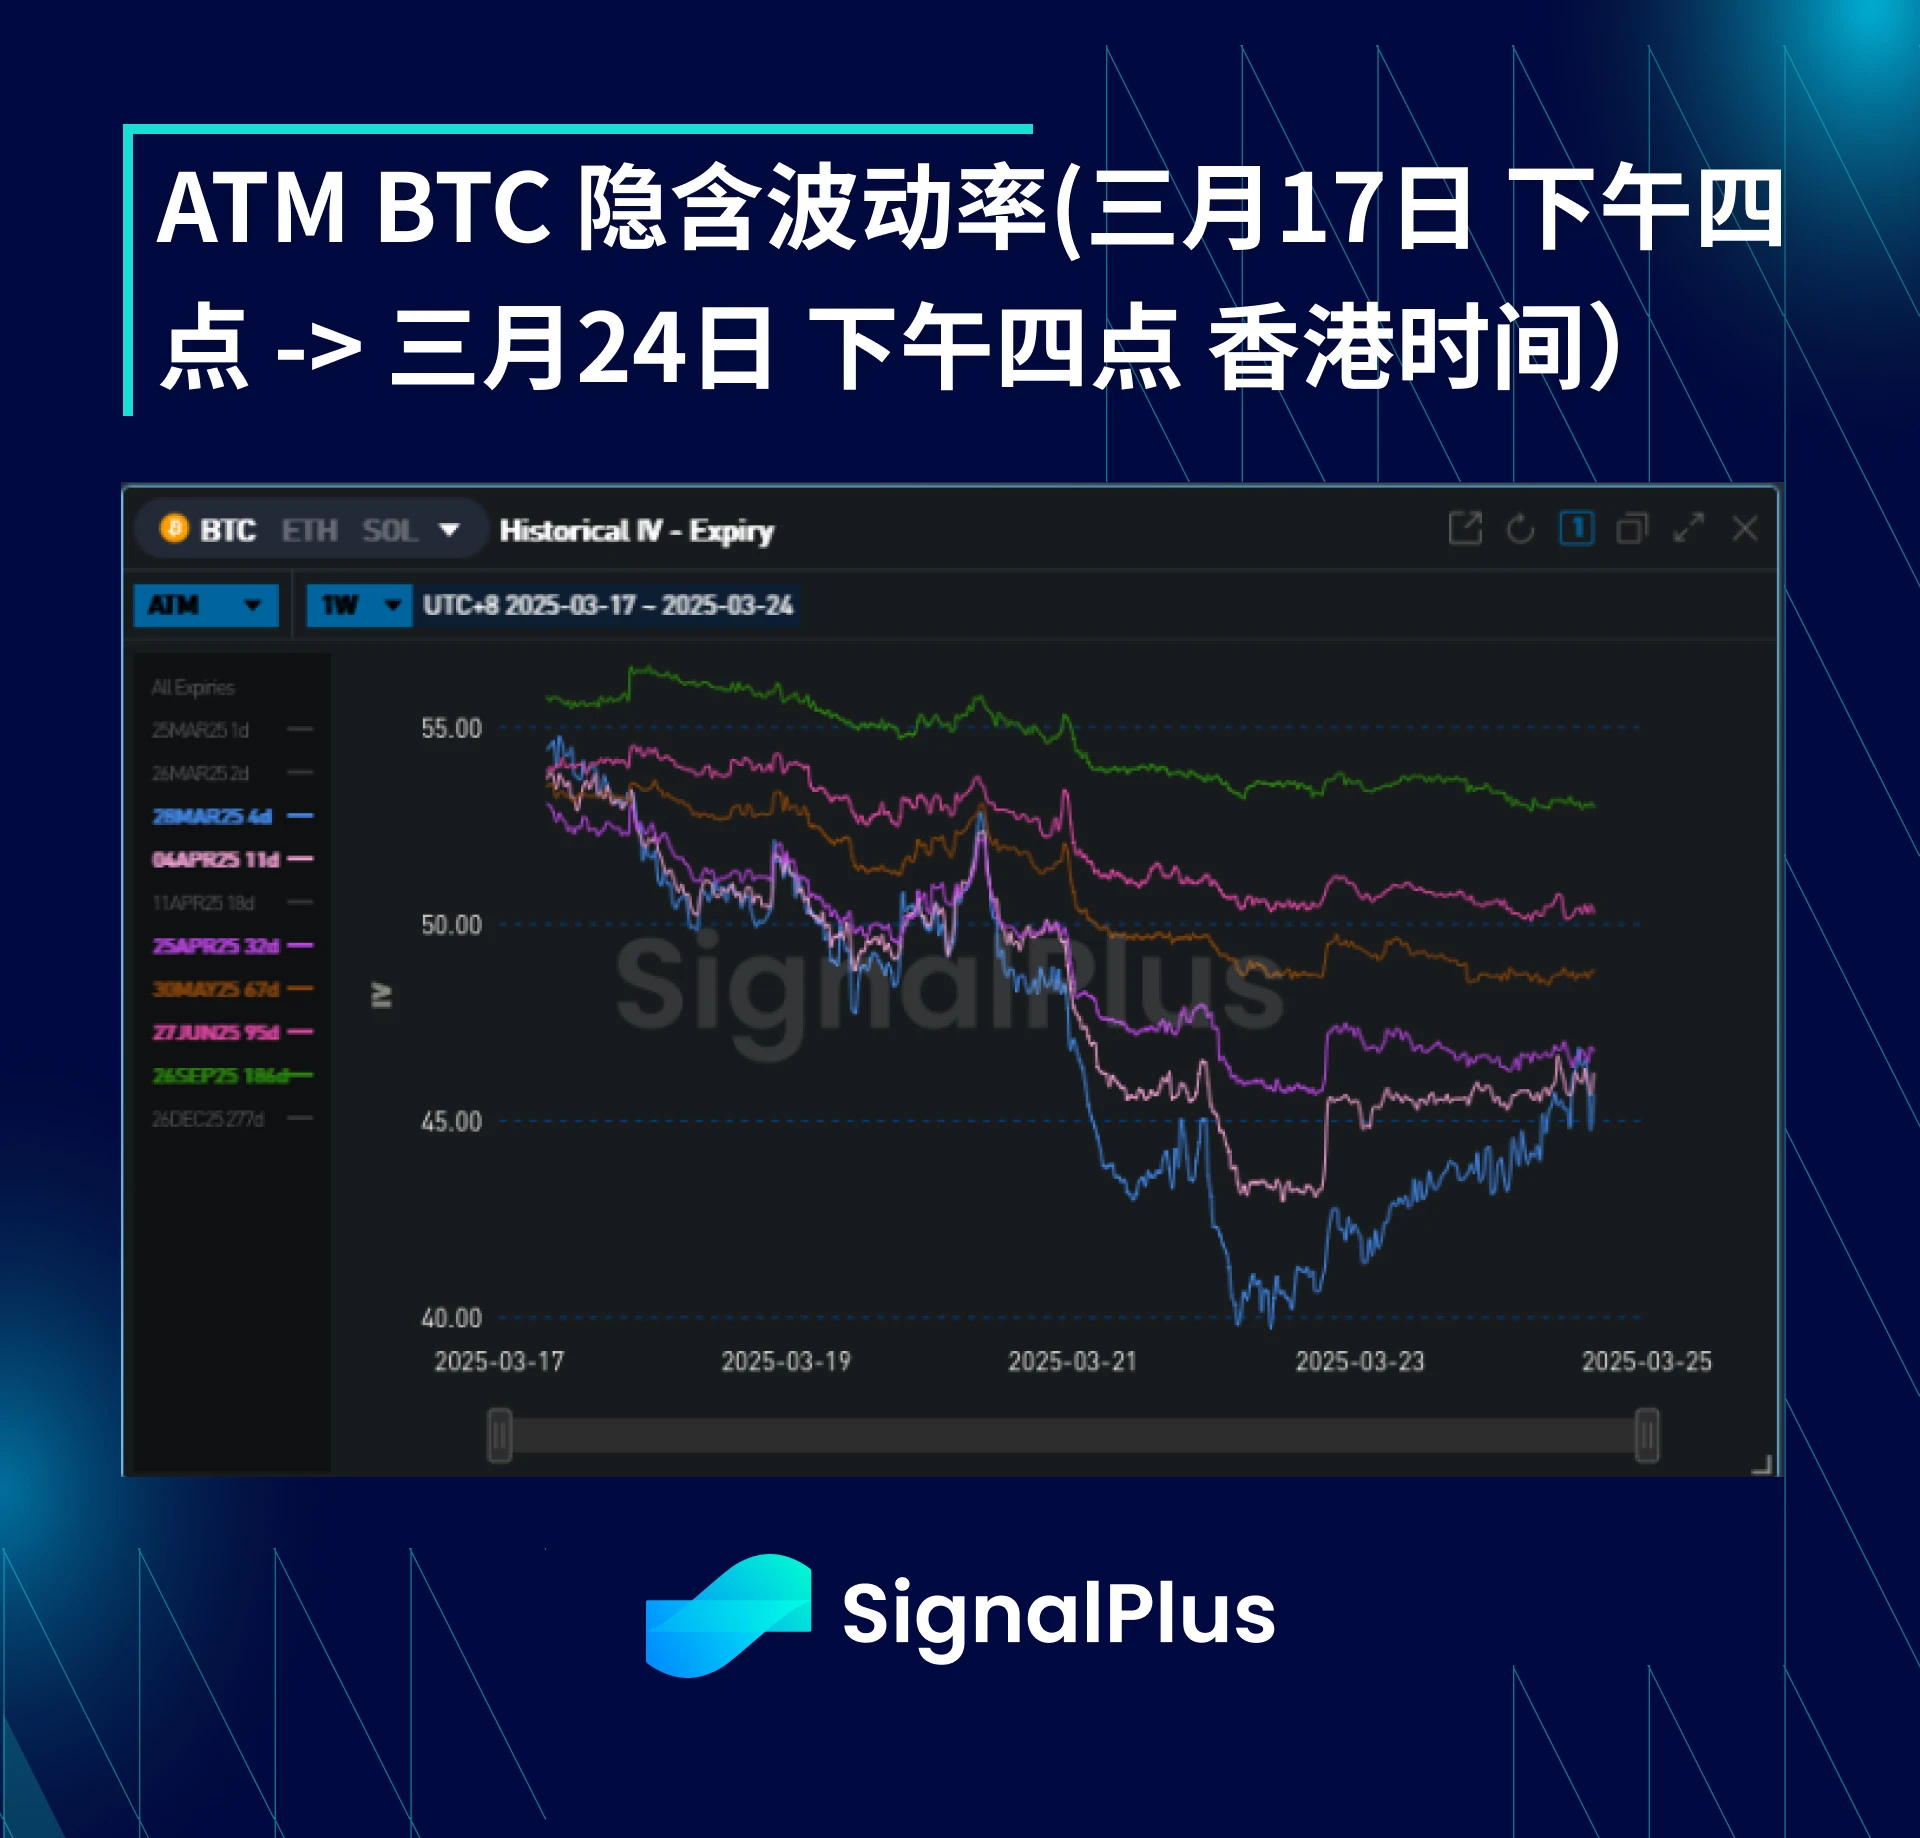
As the price of the currency finds balance in the range of 81.5-87.5 thousand dollars, the actual volatility enters a silent period and gradually pulls down the implied volatility in the past week. Even including the FOMC and Trumps speech at the DAS meeting, the weekly high-frequency actual volatility has dropped to 40 points, which is almost the lowest point since February. In general, our view is that the actual volatility of BTC will gradually decrease to the range of 30-40, but because the actual volatility of the currency price is still quite large, there is a possibility of occasional surges to 50-60 points.
The term structure of the implied volatility curve has steepened sharply due to the decline in the front end, which has also pulled down the implied volatility at the far end of the curve until the end of September. The market seems to be taking away the premium associated with policy volatility, as the short-term narrative gradually becomes stale and Trump shows no signs of paying special attention to the price of Bitcoin. In addition, as BTC has held the $80k mark despite the rather poor performance of the SP, the implied volatility market has gradually eliminated the consideration of US stock beta volatility, as the actual correlation between the two is gradually weakening and the VIX index has also fallen back below 20.
BTC Skewness/Kurtosis
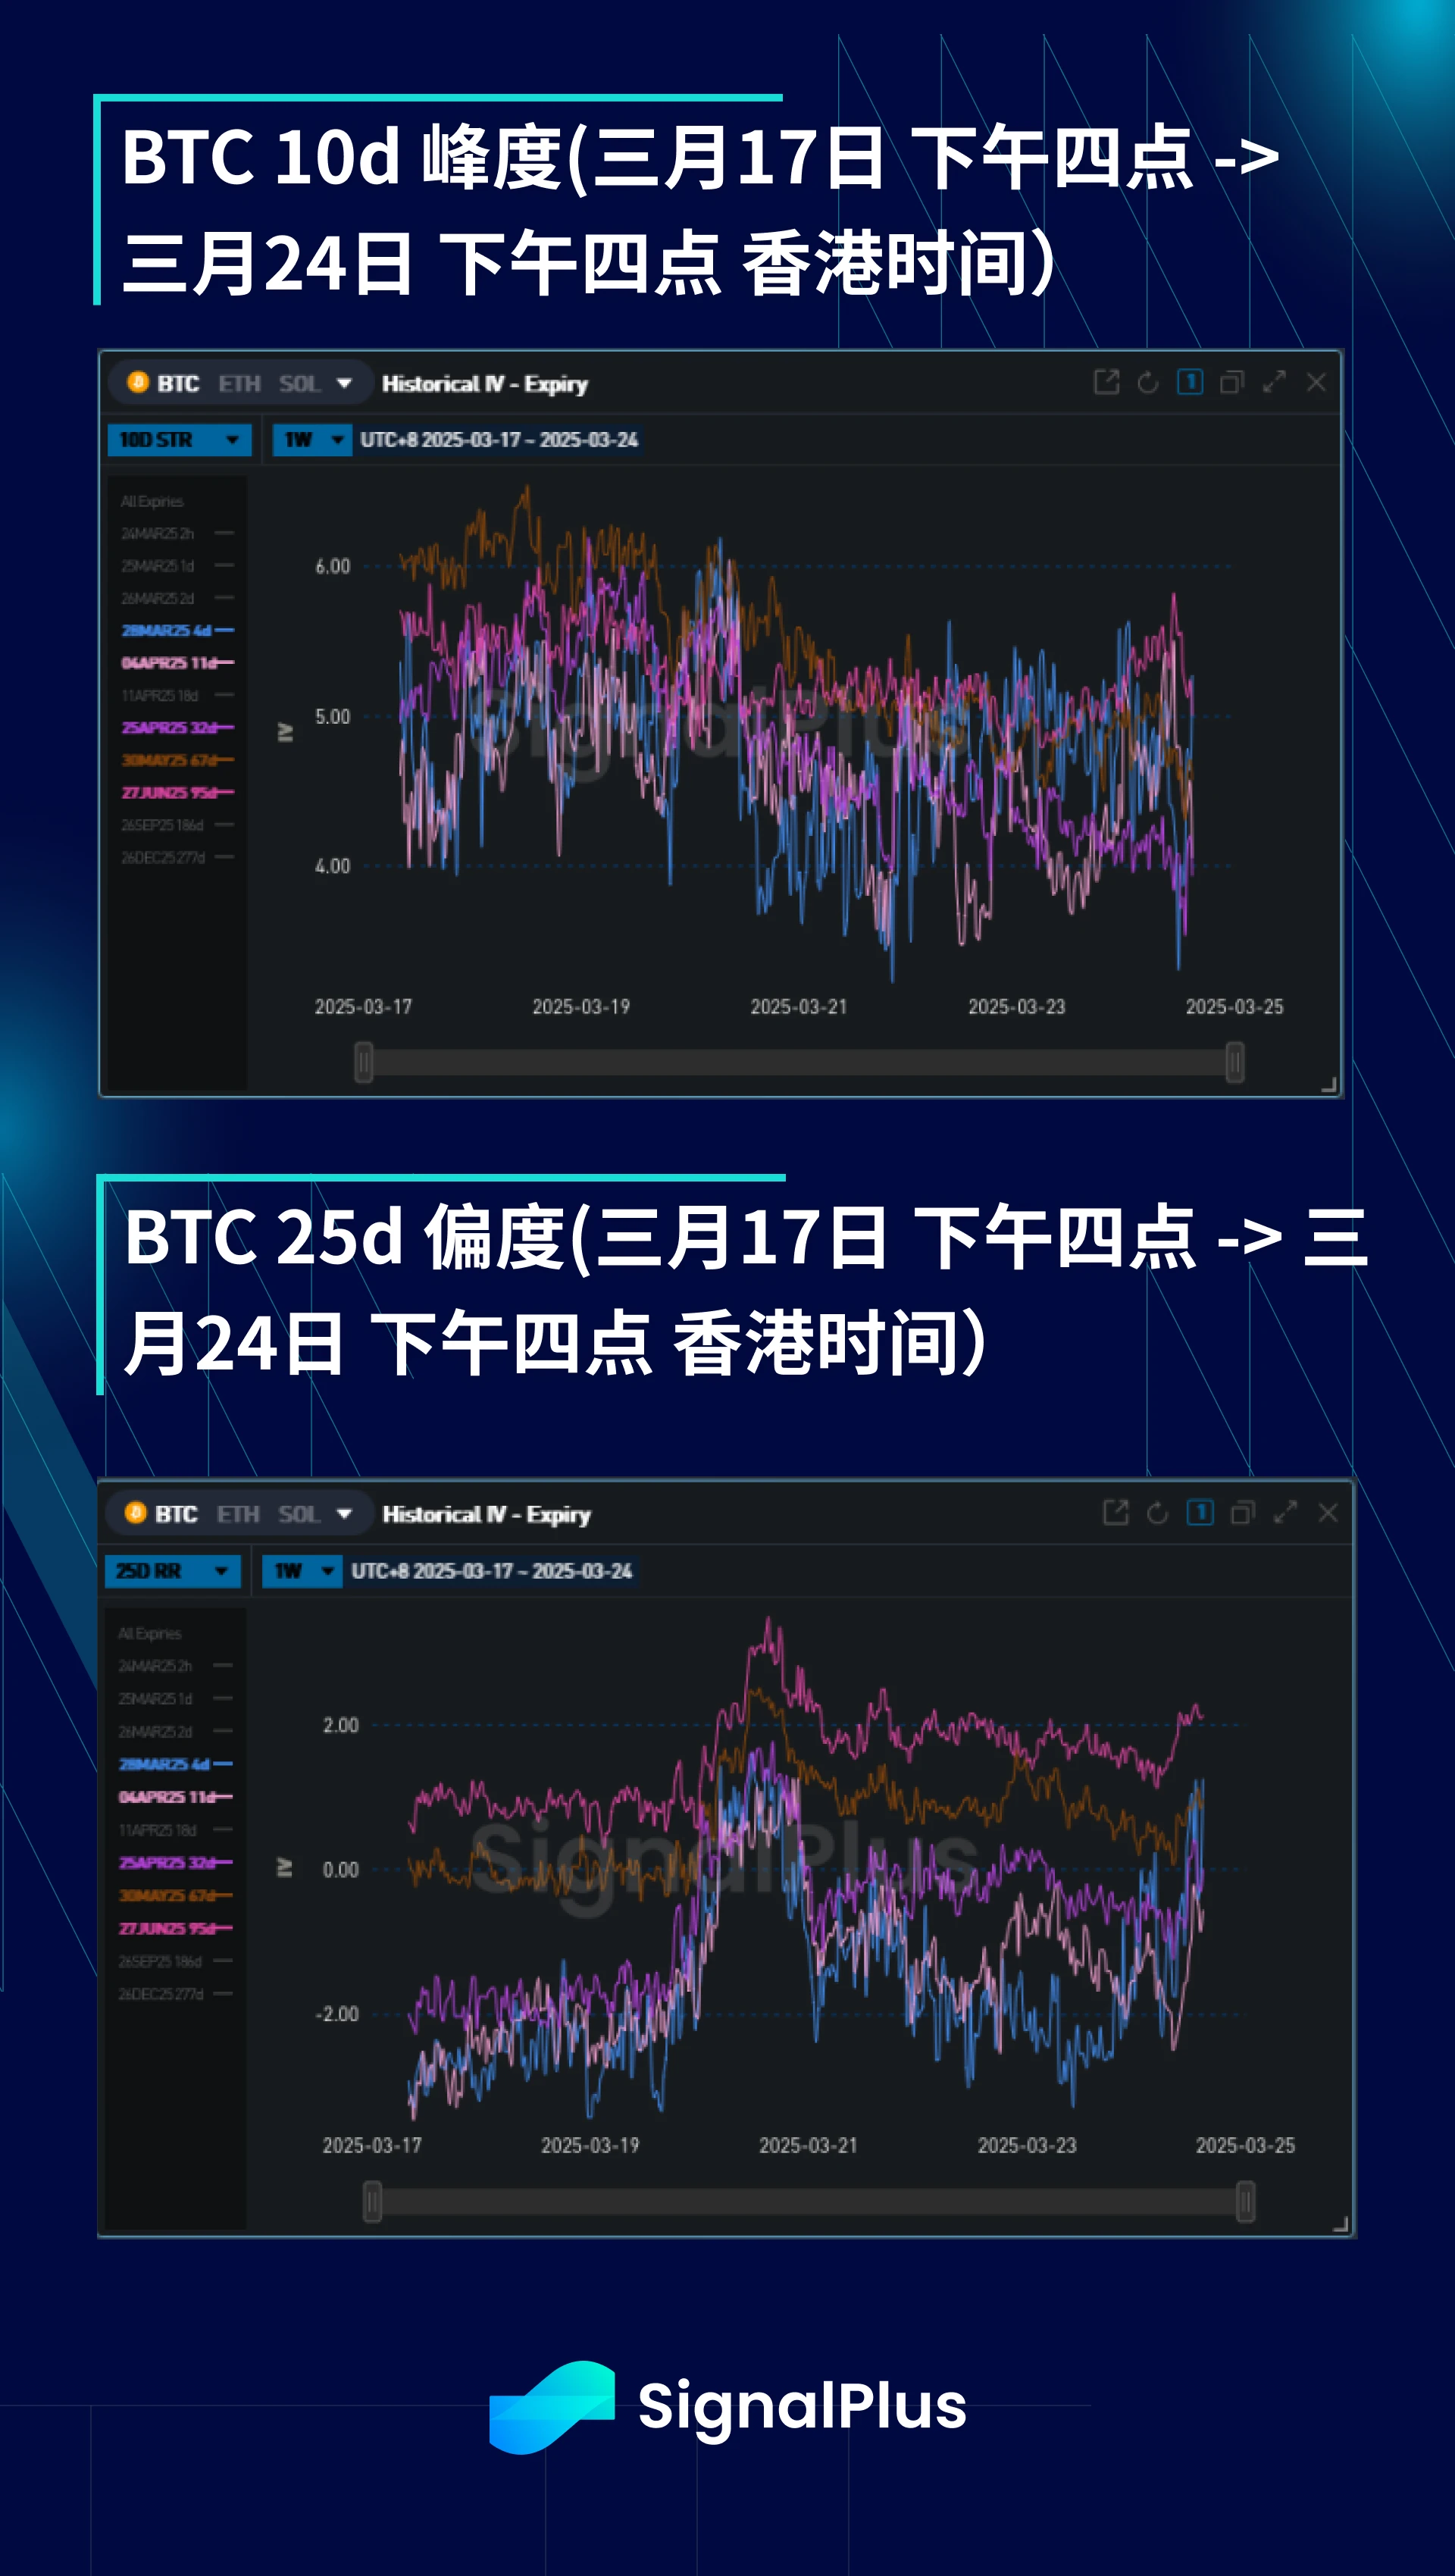
The short-term skewness price gradually recovered this week (from very skewed to the downside), as there were quite a few positions left below the price to liquidate, and the BTC price also held its ground when the SP index retreated. At the longer end of the term, the skewness adjusted slightly to the upside due to the markets selling below the price.
Kurtosis has been falling this week as implied volatility has compressed and realized volatility moves have decayed. The market has also seen some 1 x 2 ratio call spreads from directional traders, which sell both implied volatility and kurtosis, further depressing prices on the wings. We expect kurtosis to find a foothold here, and any breakout of the $80-90k range could lead to a lift in realized volatility.
Good luck to everyone this week!

You can use the SignalPlus trading vane function for free at t.signalplus.com/news , which integrates market information through AI and makes market sentiment clear at a glance. If you want to receive our updates in real time, please follow our Twitter account @SignalPlusCN, or join our WeChat group (add the assistant WeChat, please delete the space between English and numbers: SignalPlus 123), Telegram group and Discord community to communicate and interact with more friends.
SignalPlus Official Website: https://www.signalplus.com


