


Original author: Lord William (X: @LordWillia mUK )
Under Trumps extreme trade policy, Russell and Nasdaq have entered a bear market;
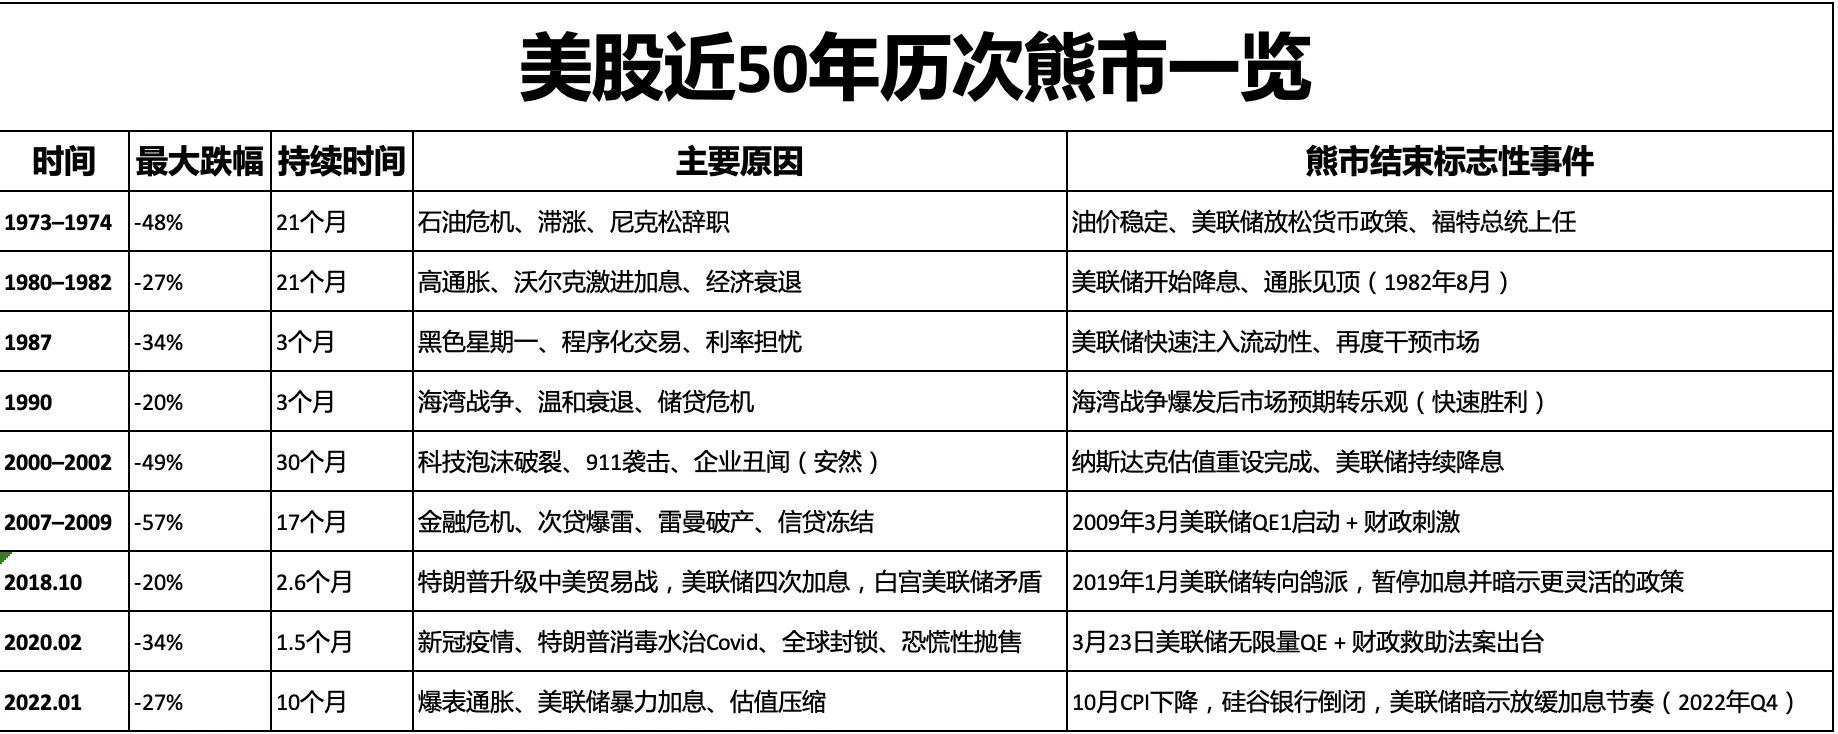
I have sorted out the reasons, declines and turning points of the bear markets (falls of more than 20% from the highs) that the U.S. stock market has experienced in the past 50 years.
1973-1974 Bear Market
Date: January 1973 – October 1974
Downside: Approximately -48% (SP 500)
reason:
Oil crisis (first oil crisis, OPEC embargo in 1973)
High Inflation + Stagflation
The Fed tightens monetary policy
Nixon Administration Scandal (Watergate)
Bear-bull turning point:
Oil prices stabilize, the Federal Reserve eases monetary policy, and President Ford takes office
1980-1982 Bear Market
Date: November 1980 – August 1982
Decline: about -27%
reason:
Chairman Paul Volcker raises rates aggressively to curb inflation, with the federal funds rate rising to 20%
The economy fell into a deep recession
High unemployment and falling corporate profits
Bear-bull turning point:
The Federal Reserve begins to cut interest rates and inflation peaks (August 1982)
Black Monday 1987
Date: August 1987 – December 1987
Downside: Approximately -34% (SP 500)
reason:
Technical sell-off caused by automated program trading (portfolio insurance)
Rising interest rates and trade deficit concerns
Dollar fluctuations and global market linkage
Bear-bull turning point:
The Federal Reserve quickly injected liquidity and intervened in the market again
1990 Recession Bear Market
Time: July 1990 – October 1990
Decline: about -20%
reason:
The first Gulf War caused a sharp rise in oil prices
The U.S. enters a mild recession
Commercial real estate crisis + bank credit tightening
Bear-bull turning point:
Market expectations turned optimistic after the Gulf War (quick victory)
2000-2002 The tech bubble bursts
Period: March 2000 – October 2002
Drop: about -49% (SP 500), Nasdaq over -78%
reason:
The valuation bubble of Internet technology stocks bursts
The 9/11 terrorist attacks in 2001 brought uncertainty
Corporate profits decline, confidence crisis
Bear-bull turning point:
Nasdaq valuation reset completed, Fed continues to cut interest rates
2007-2009 Global Financial Crisis
Date: October 2007 – March 2009
Downside: Approximately -57% (SP 500)
reason:
The housing bubble burst
Subprime mortgage crisis → Lehman Brothers bankruptcy
Global credit freeze, banking crisis, Fed forced to rescue markets
Bear-bull turning point:
March 2009 Fed QE 1 launched + fiscal stimulus
2018 Bear Market
Time: October 2018 – December 2018 (Trump’s first term)
Decline: about -34%
reason:
Trump escalates the Sino-US trade war, the Federal Reserve raises interest rates four times that year, and the White House and the Federal Reserve are in conflict
Bear-bull turning point:
In January 2019, the Fed turned dovish, pausing rate hikes and hinting at a more flexible policy
2020 Pandemic Bear Market
Time: February 2020 – March 2020 (fastest bear market in history)
Decline: about -34%
reason:
COVID-19 outbreak triggers global economic lockdown
Supply chain disruption + business shutdown
Panic selling + initial policy lag
Bear-bull turning point:
On March 23, 2020, the Federal Reserves unlimited QE + fiscal rescue bill was introduced
2022 Rate Hike Bear Market
Time: January 2022 – October 2022
Decline: SP -27%
reason:
High inflation (CPI as high as 9.1%)
The Federal Reserve raised interest rates significantly (the benchmark interest rate rose from 0 to over 4.5%)
Tech valuations compressed, bond yields soared
Bear-bull turning point:
CPI fell in October, the Fed hinted at slowing down the pace of interest rate hikes (Q4 2022), Silicon Valley Bank collapsed
Summarize
1. This bear market is similar to the two bear markets during Trumps term in office. Both are fast bear markets. After the last two bear markets ended, both were V-reversals.
2. The bear market bottoms out and a reversal of trend is needed.
response
1. Do not use leverage during the left-side decline;
2. Make sure that you will not get liquidated even if the SP falls by 57% (and the current point falls by another 40%);
3. Don’t go too far on the left side, buy in batches, and only buy index funds;
4. Prepare the funds that can be used and prepare to increase the position on the right side;
5. Buying on the right side requires patience in waiting for the turning events and technical patterns.
Important events or signals
1. Trump’s chance of delaying the implementation of additional reciprocal tariffs – within the next week, 30% probability;
2. The EU’s official response on reciprocal tariffs - within the next week, there is a 50% chance that it will follow the compromise between the UK and Southeast Asia;
3. Further escalation or easing of US-China tariffs - Between April 7 and 15, Trump was salivating over Tiktok, so there should be some discussion;
4. Buffett’s timing to enter the market: On May 3, the Omaha shareholders meeting should give a signal;
5. The Fed’s attitude towards rescuing the market: Impossible in the short term, but possible from May to June if the situation continues to deteriorate;
If a negative event occurs, continue to wait; if a positive event occurs, you can increase your position!
at last,
Trump has been destroying the foundation of American technology, military, and dollar hegemony in four years.
A big bear market breeds big opportunities. First, survive and wait patiently for the all-out attack!