


Since 2020, the entire cryptocurrency market has experienced a huge bull market. This wave of bull market has also caused a huge increase in the assets under many tracks and hotspots, and there is no shortage of thousand times or even ten thousand times coins.
secondary title
Data Acquisition and Preprocessing
The first step is to obtain data. We obtained the data of all the top 3,000 currencies by market capitalization from CoinMarketCap, totaling more than 5 million rows.
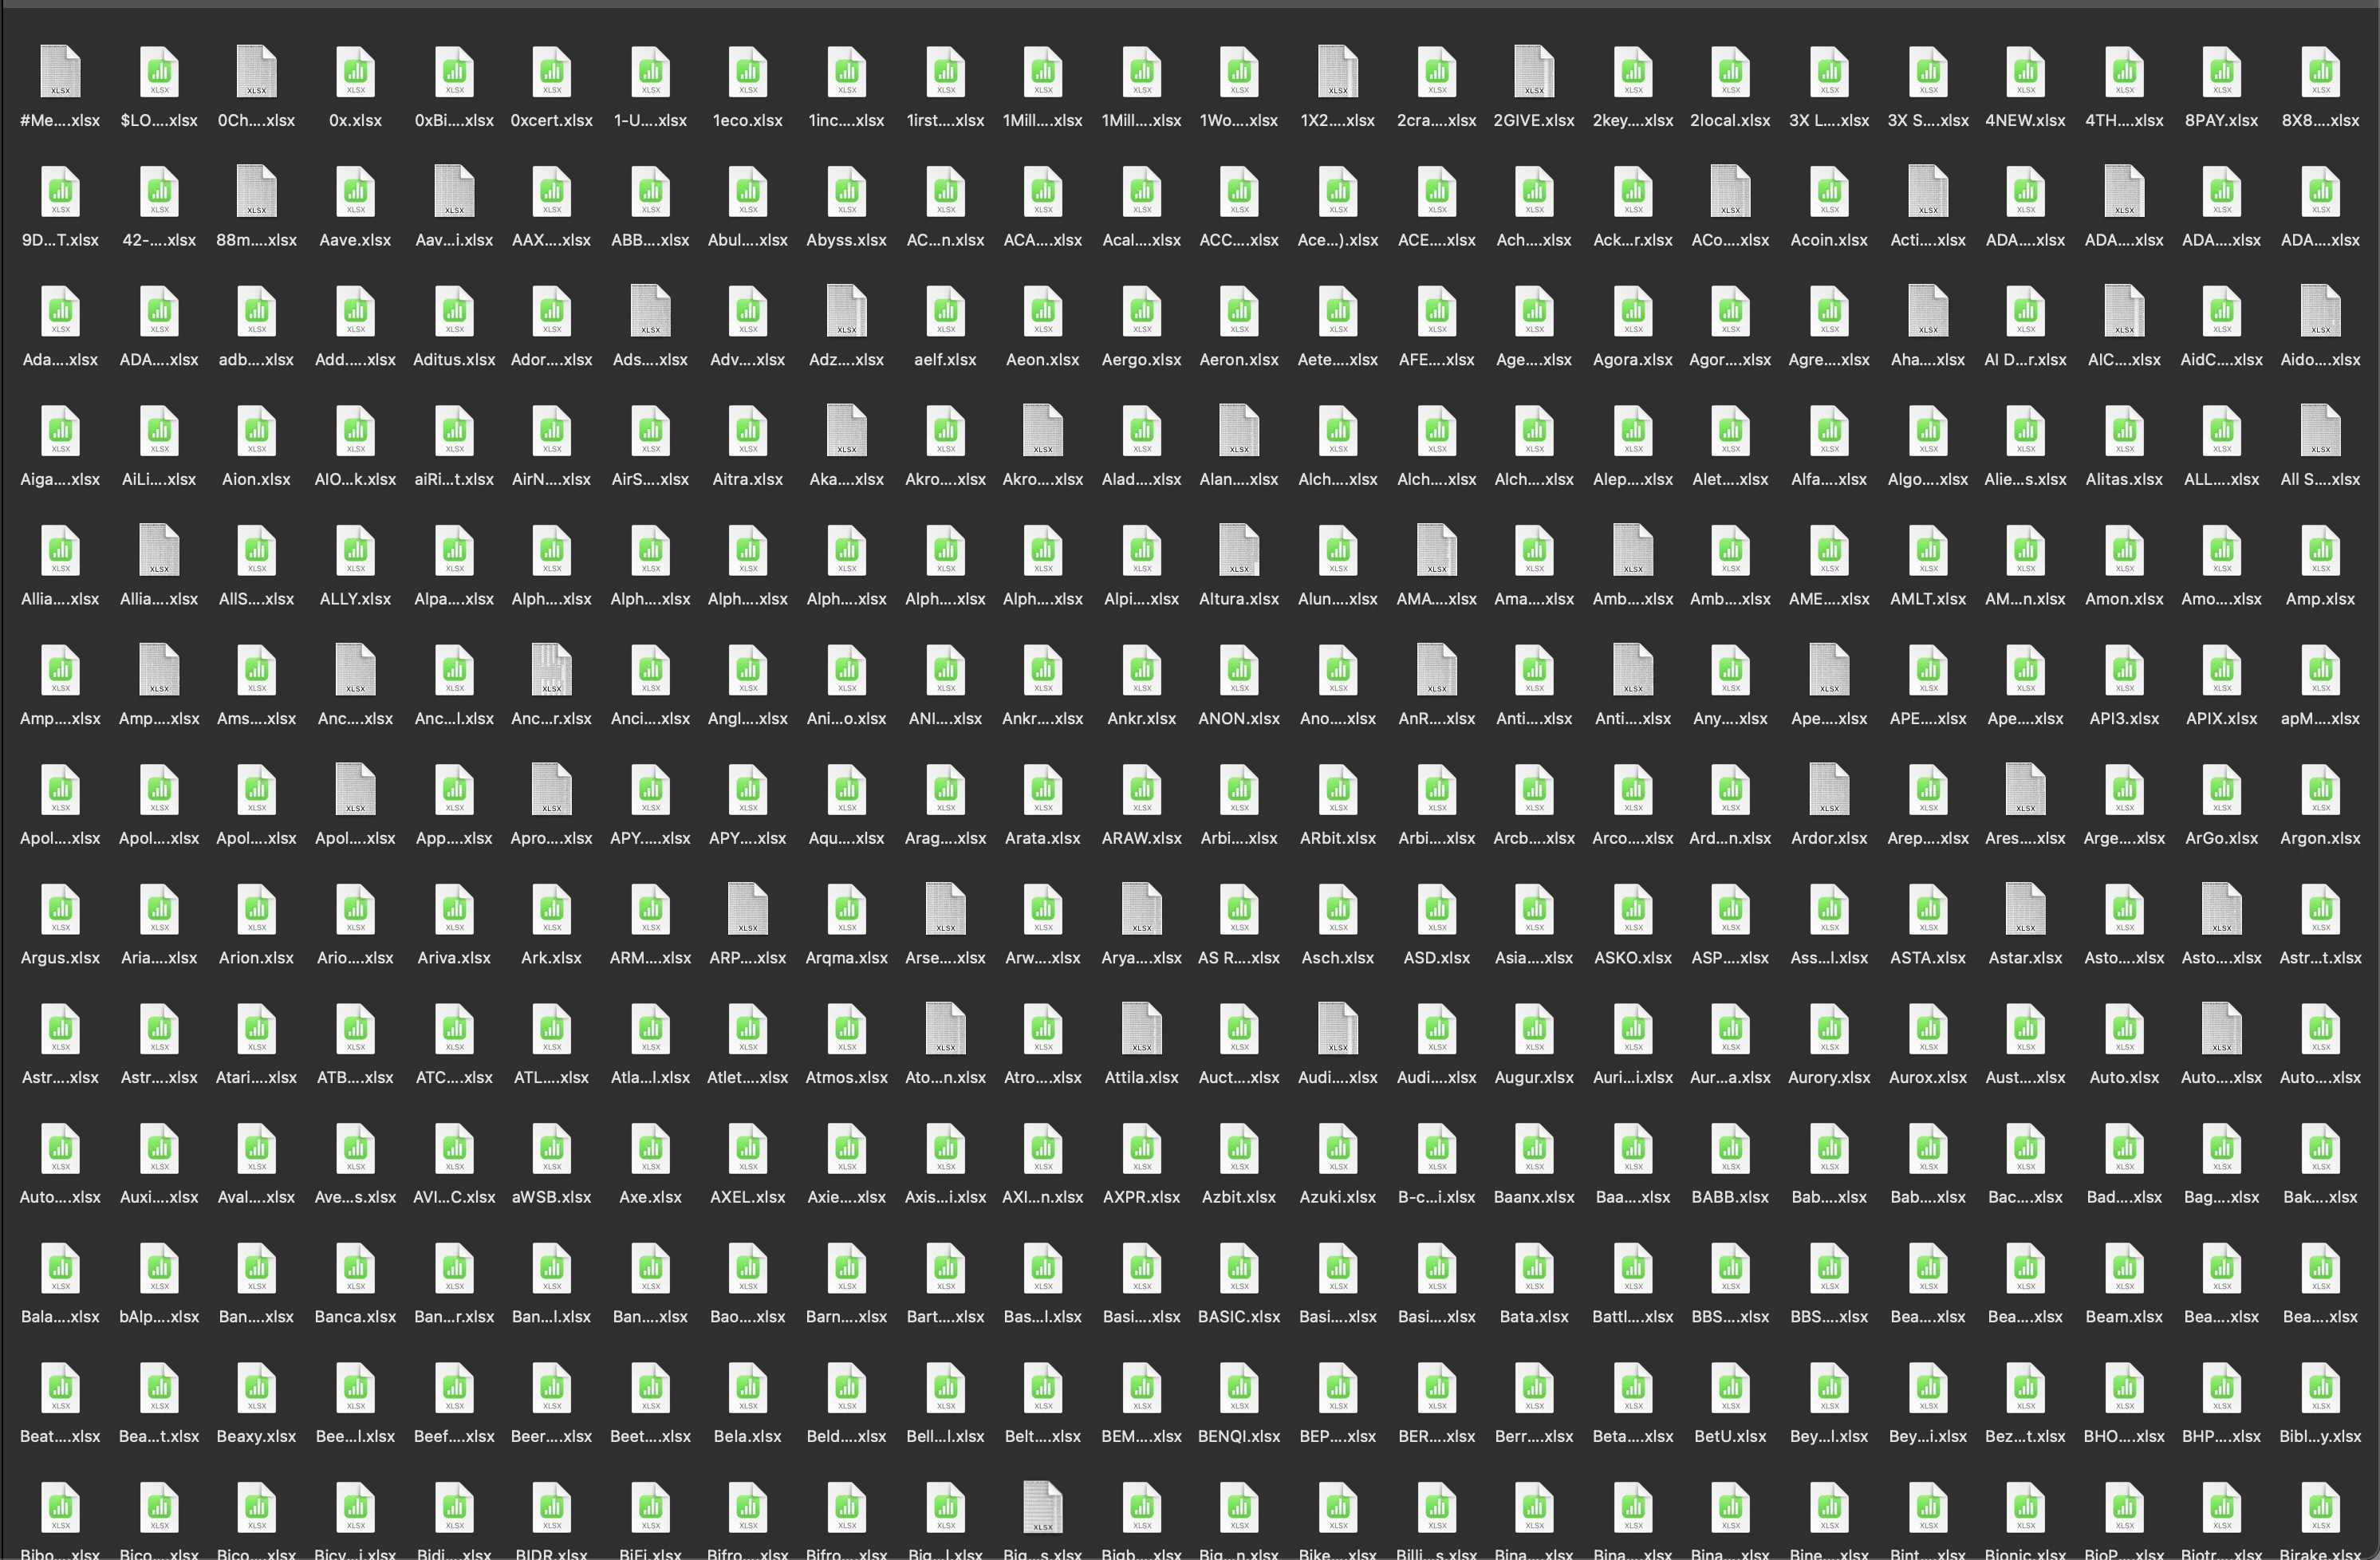
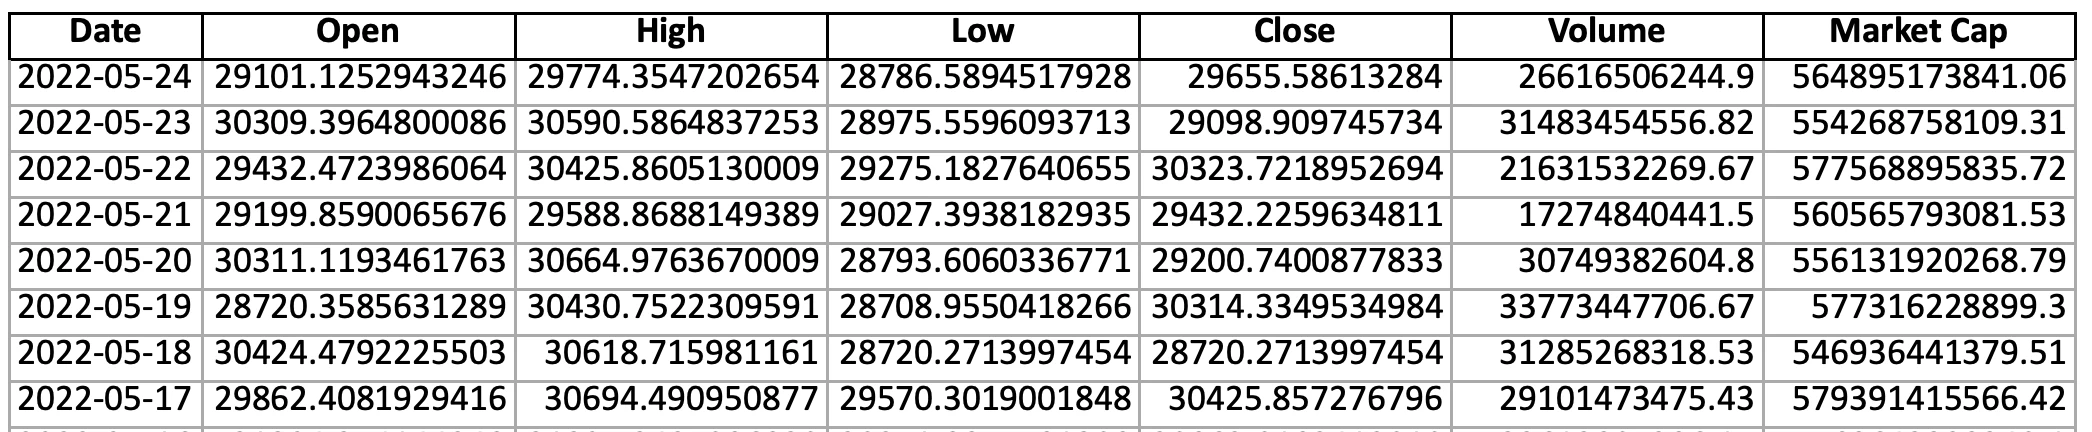
Each currency has seven Columns: Date (date), Open (opening price), High (highest price), Low (lowest price), Close (closing price), Volume (trading volume), MarketCap (market value).
For subsequent analysis, we preprocessed the data:
Modify outliers, fill in null values
Remove stablecoin assets
Remove anchor assets such as wBTC and renBTC
Remove assets that have been heavily pinned due to poor handicap depth
Remove currencies with too small market capitalization and poor liquidity (most of them are outside the market capitalization of 1,000)
NFT assets not counted
secondary title
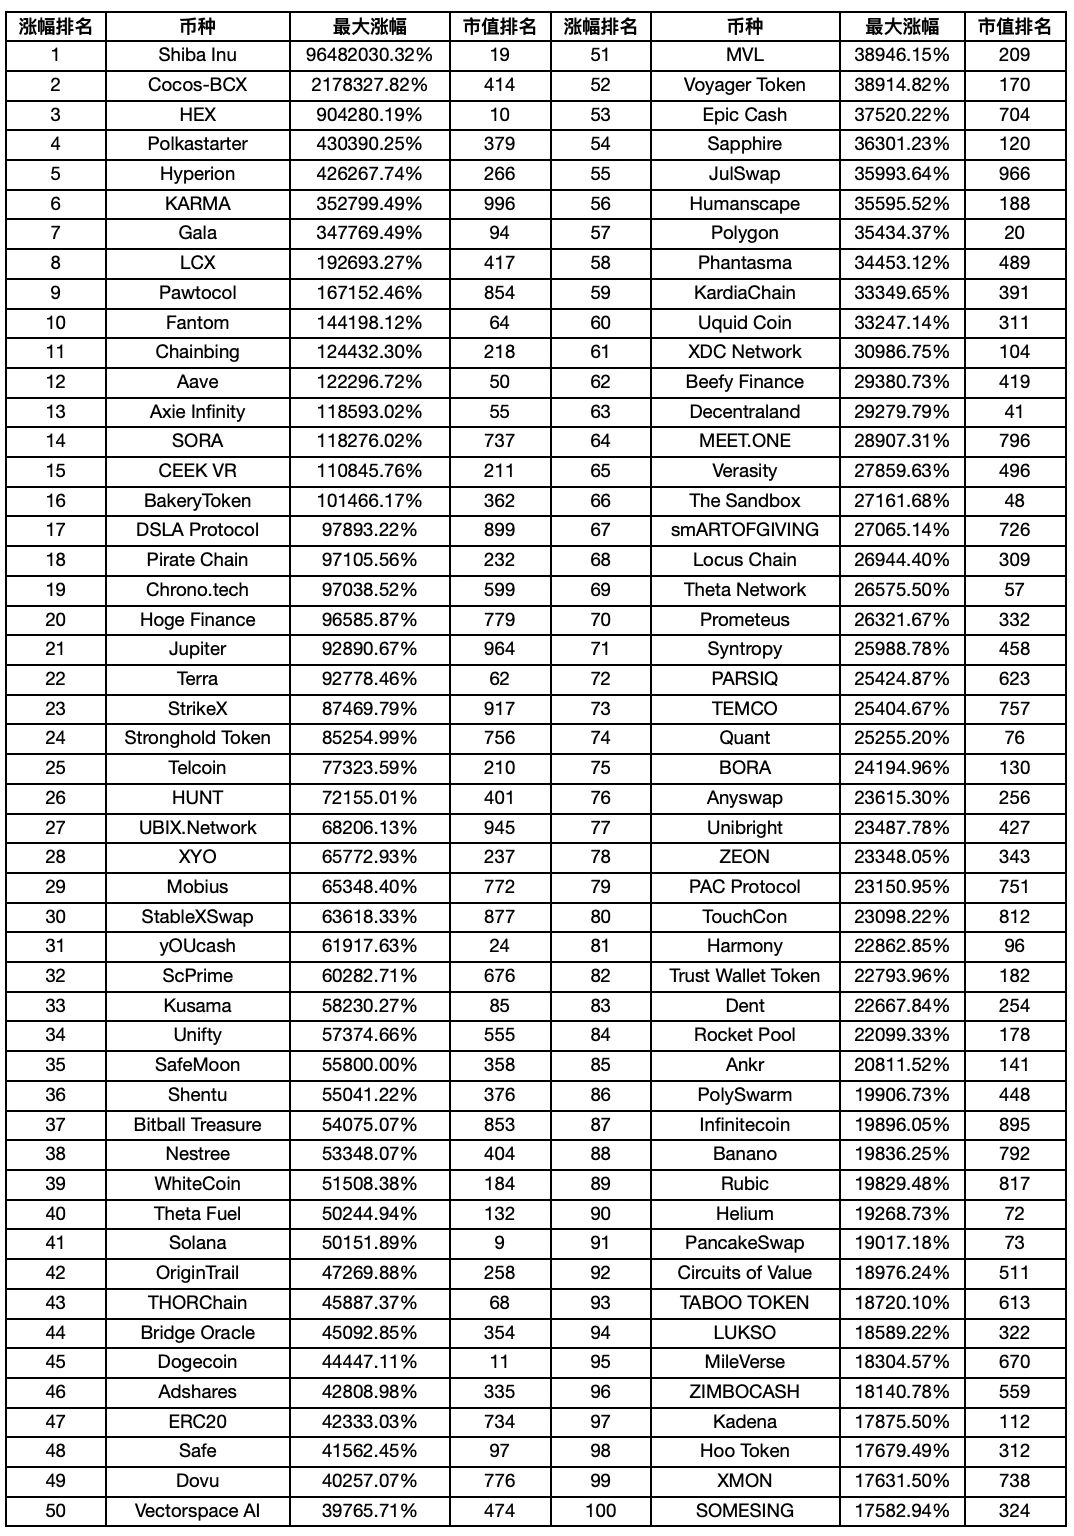
The highest increase is 960,000 times
We took January 1, 2020-May 24, 2022 as the statistical period, and found the TOP100 coins with the highest increase, as follows:
secondary title
A bull market doesn’t mean you can outperform the market by just buying
Lets calculate the median of the largest increase, which is 2002.23%.
If we take BTC as the index, then the β return is 1259.27%, compared with the median of 2002.23% of the α return, the β return does not underperform the α return by much.
secondary title
Dont choose the right time to buy small currencies? Then watch big cakes and buy small coins
Next, lets calculate the start time, end time and duration of the maximum increase of all currencies. This is essentially to discuss the timing of buying small currencies, When to buy the bottom?, When to escape the top?.
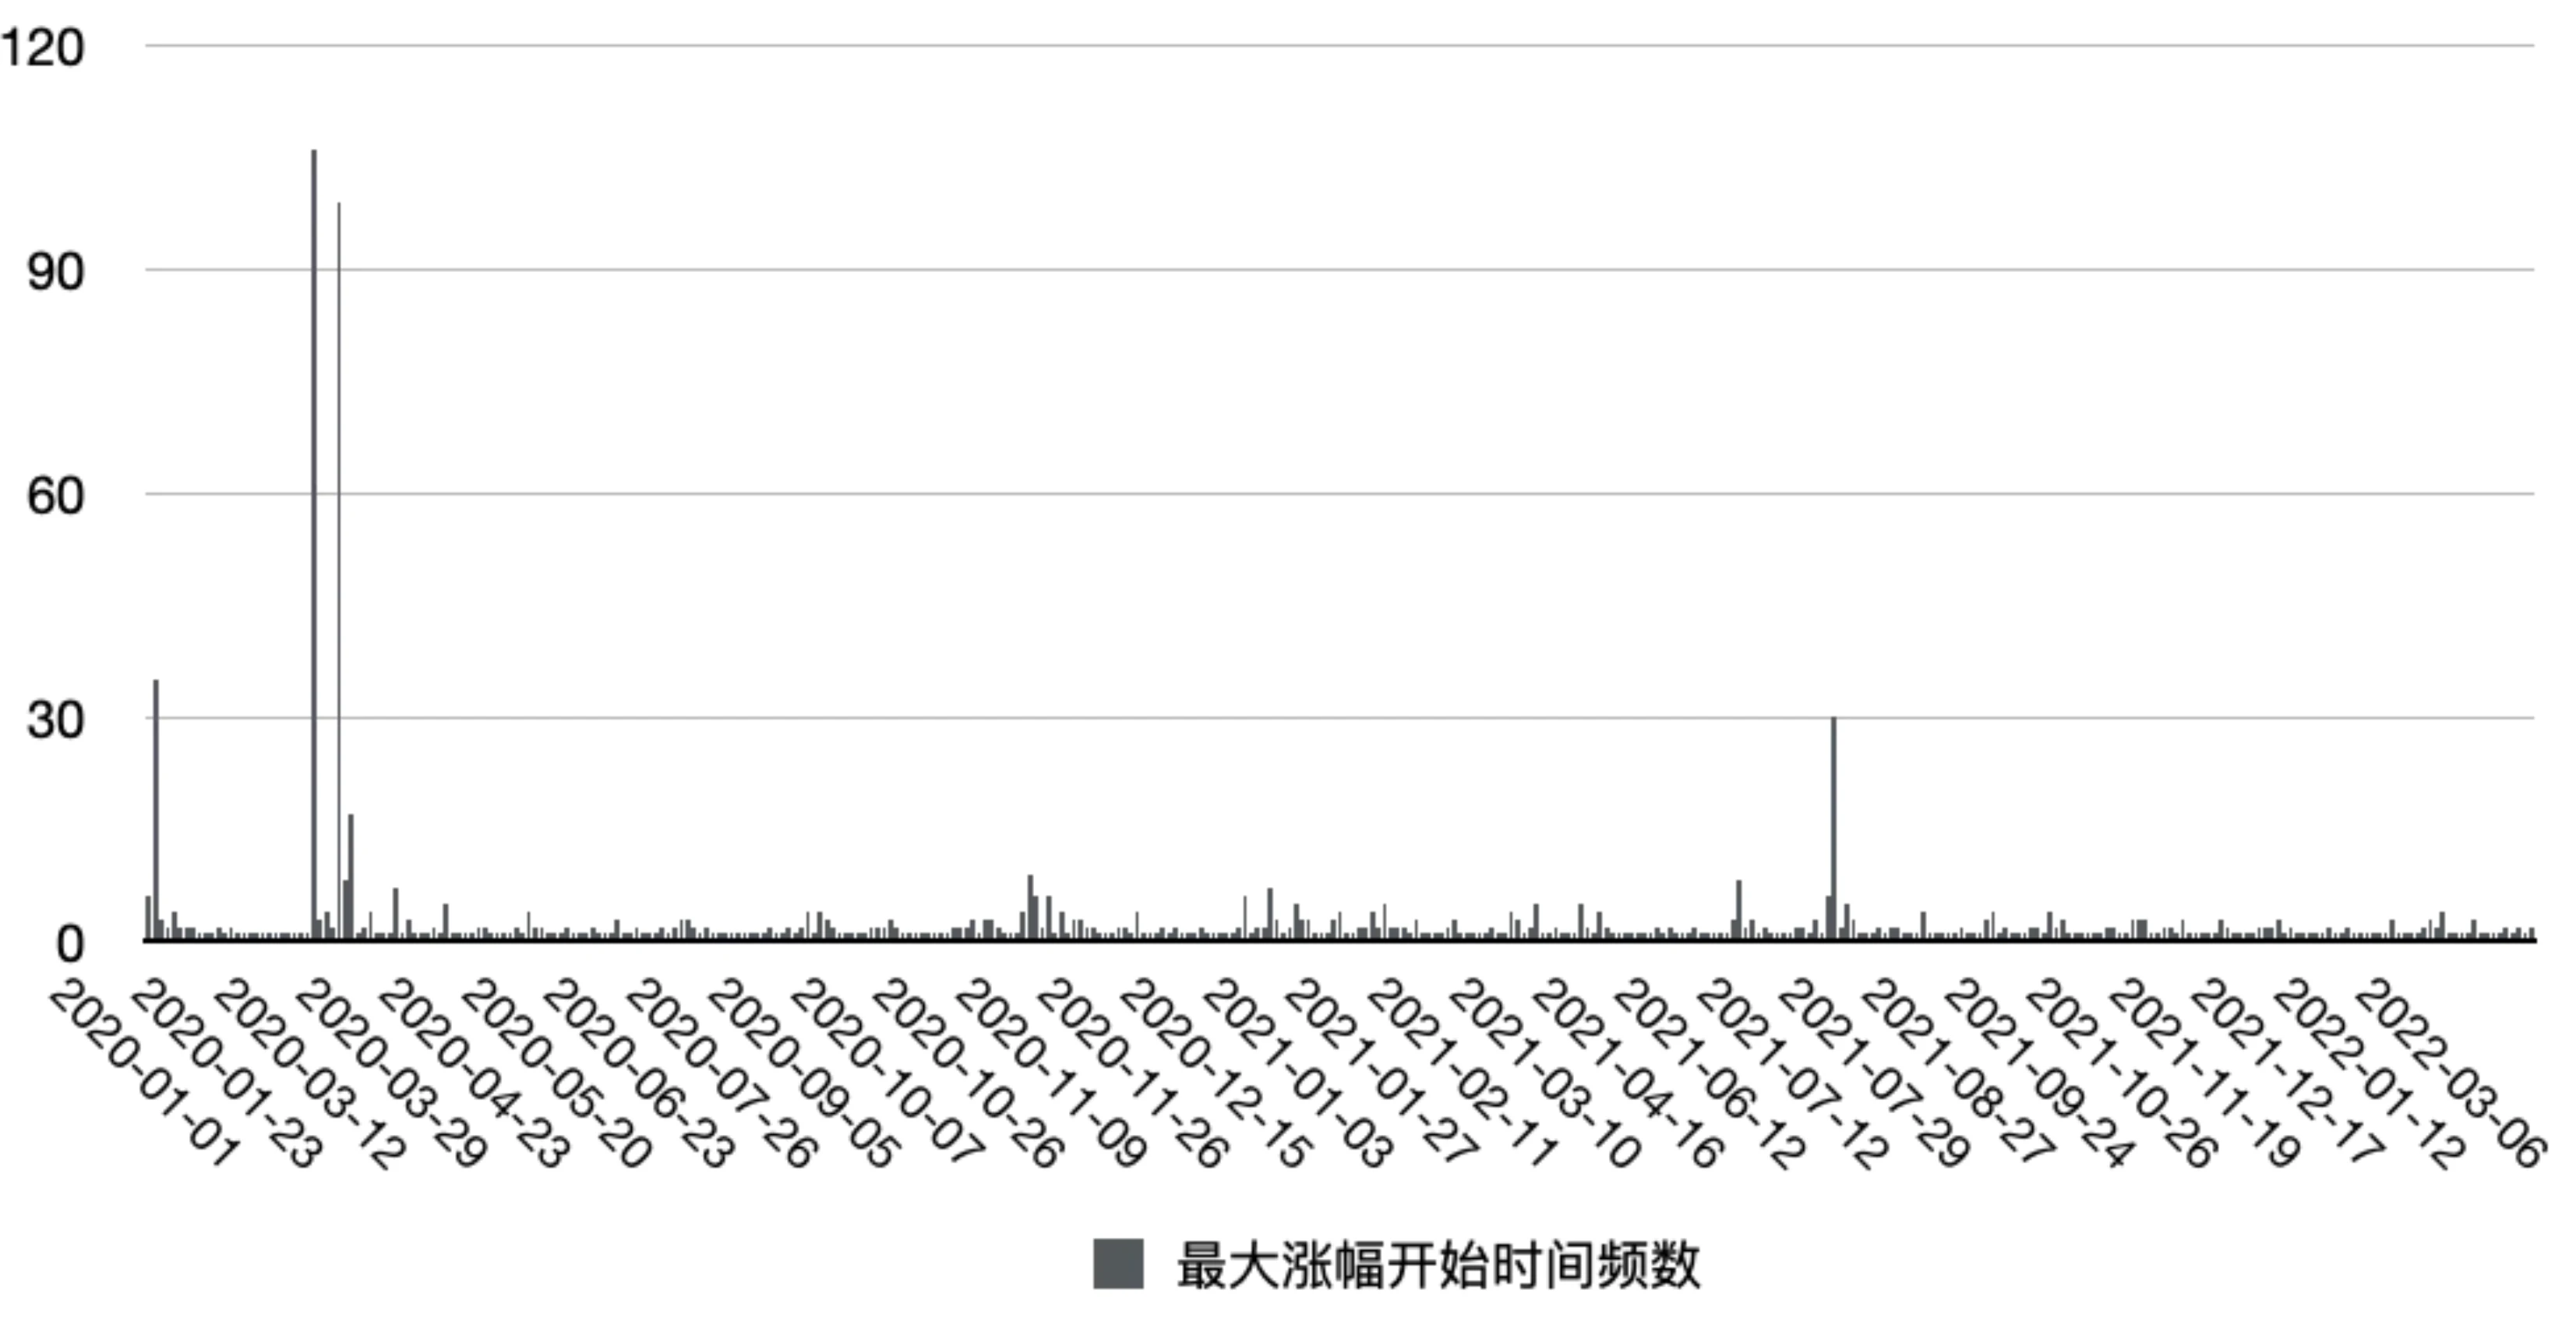
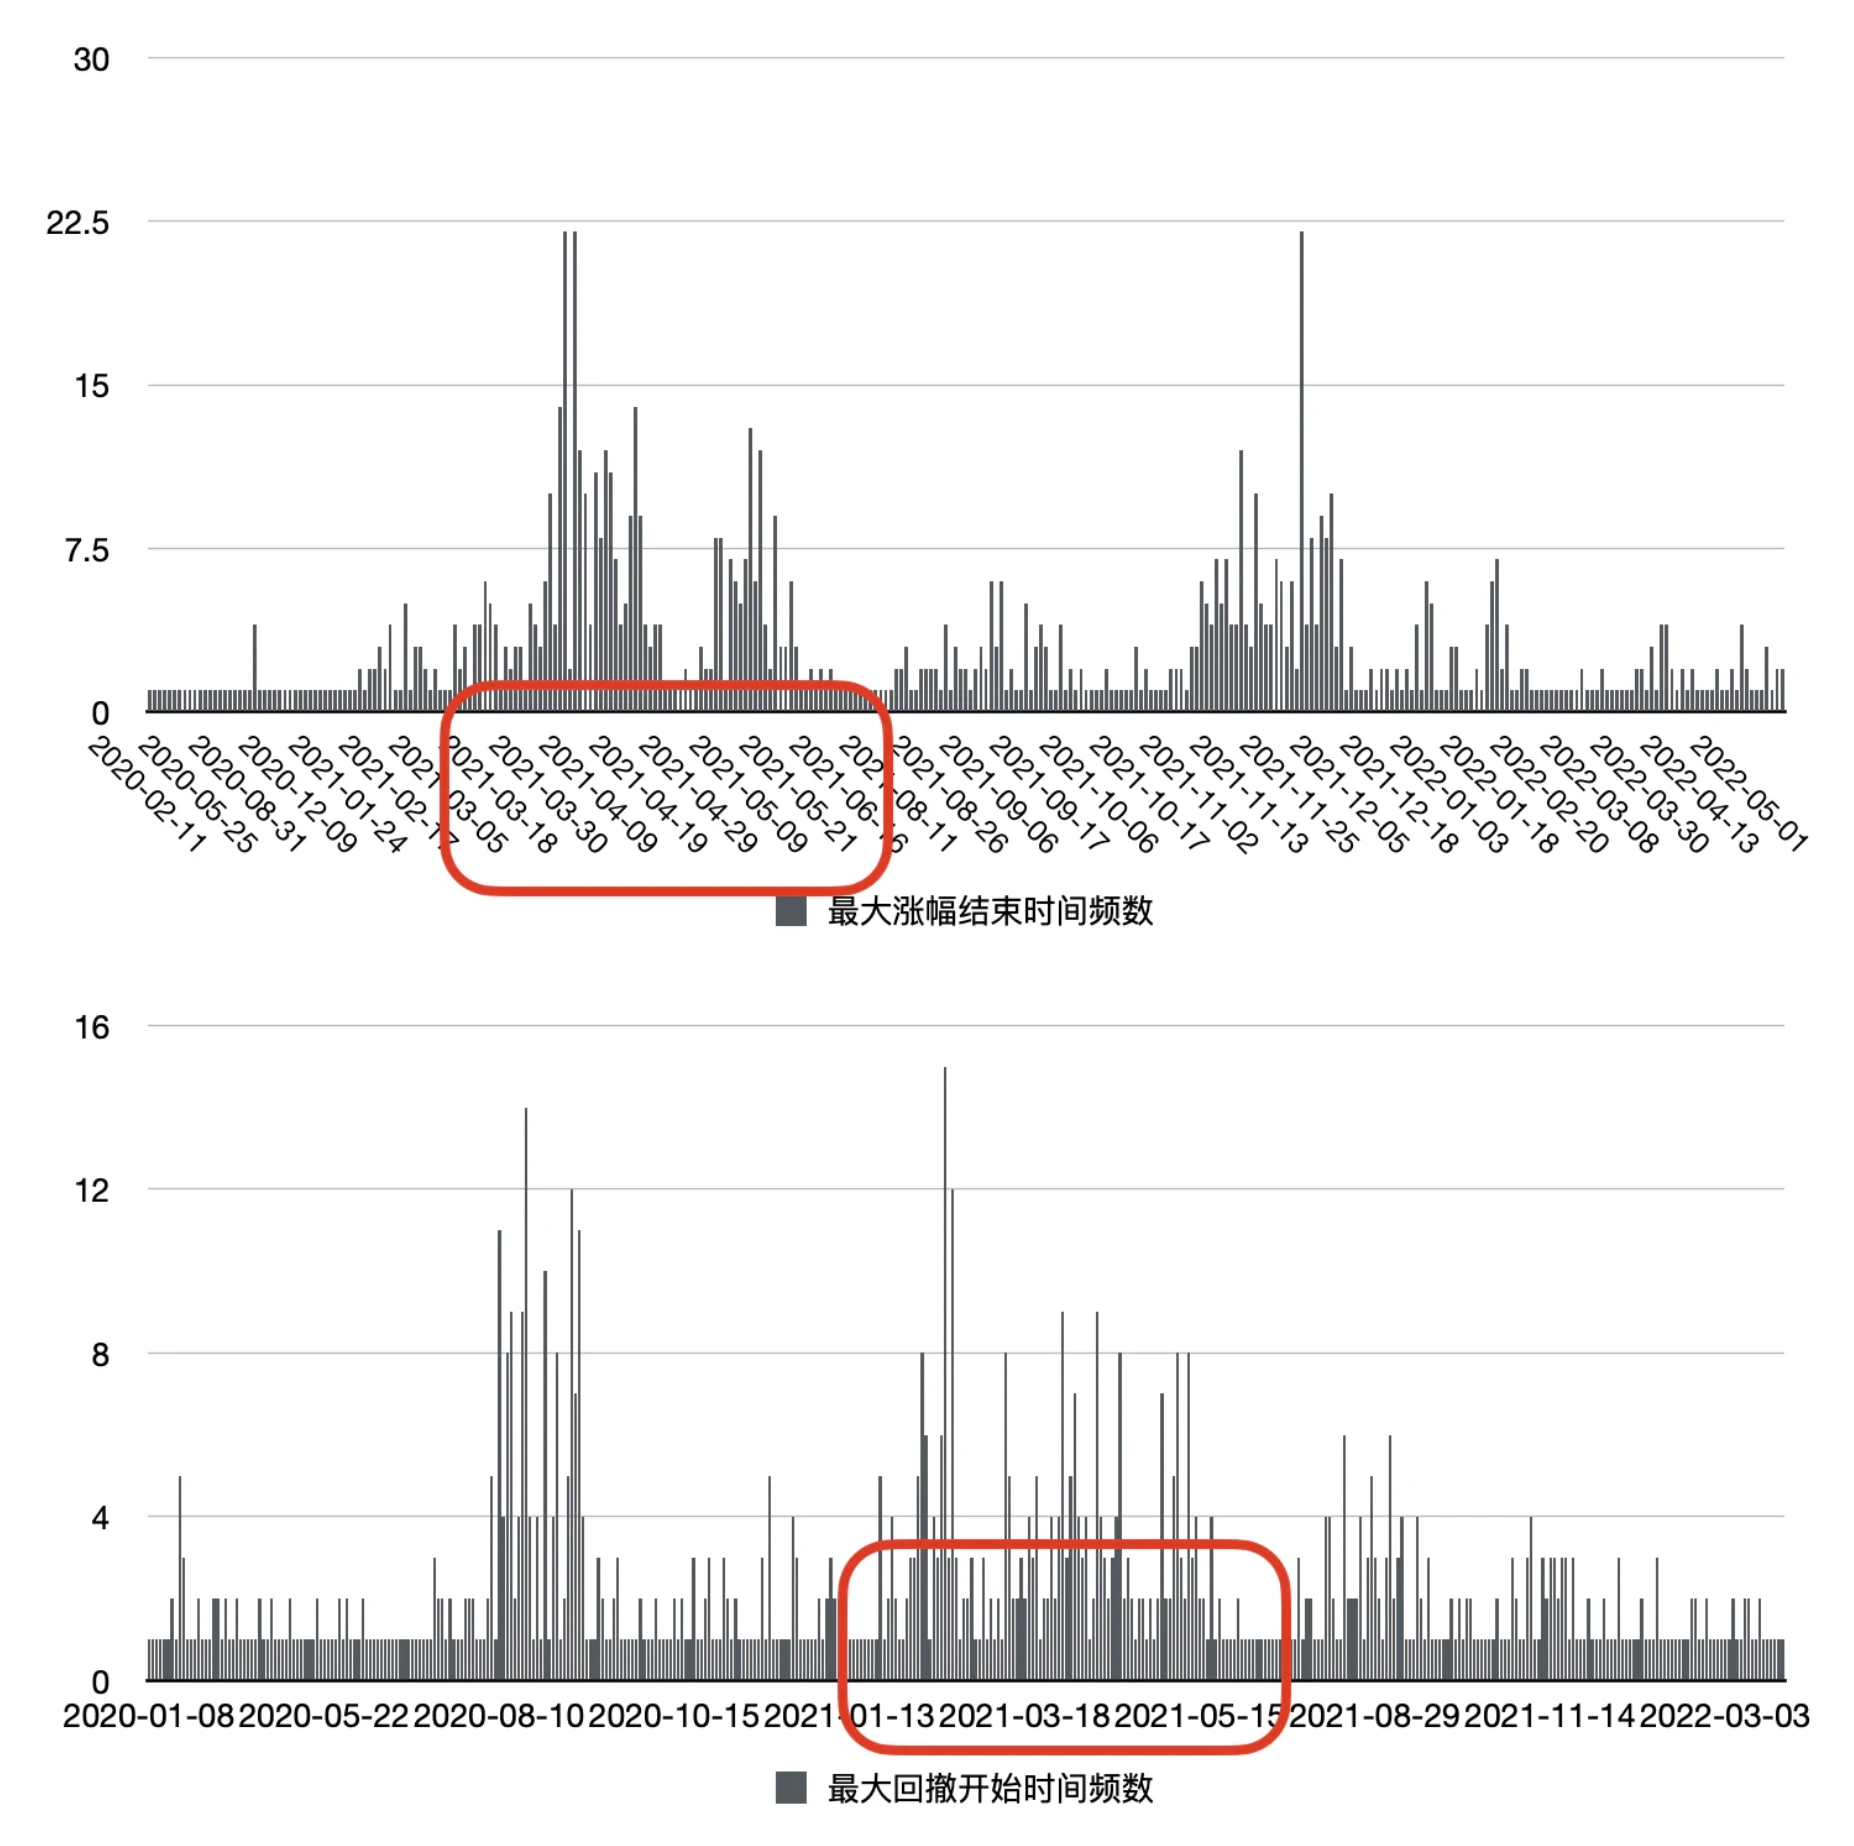
The figure above is the frequency of the start time of the largest increase, the x-axis is time, and the y-axis is frequency. The columns in the figure indicate: when did the currency bottom out. The bottoming time is concentrated in March 2020 and July 2021, that is, after the 312 and 519 tragedies bottomed out.
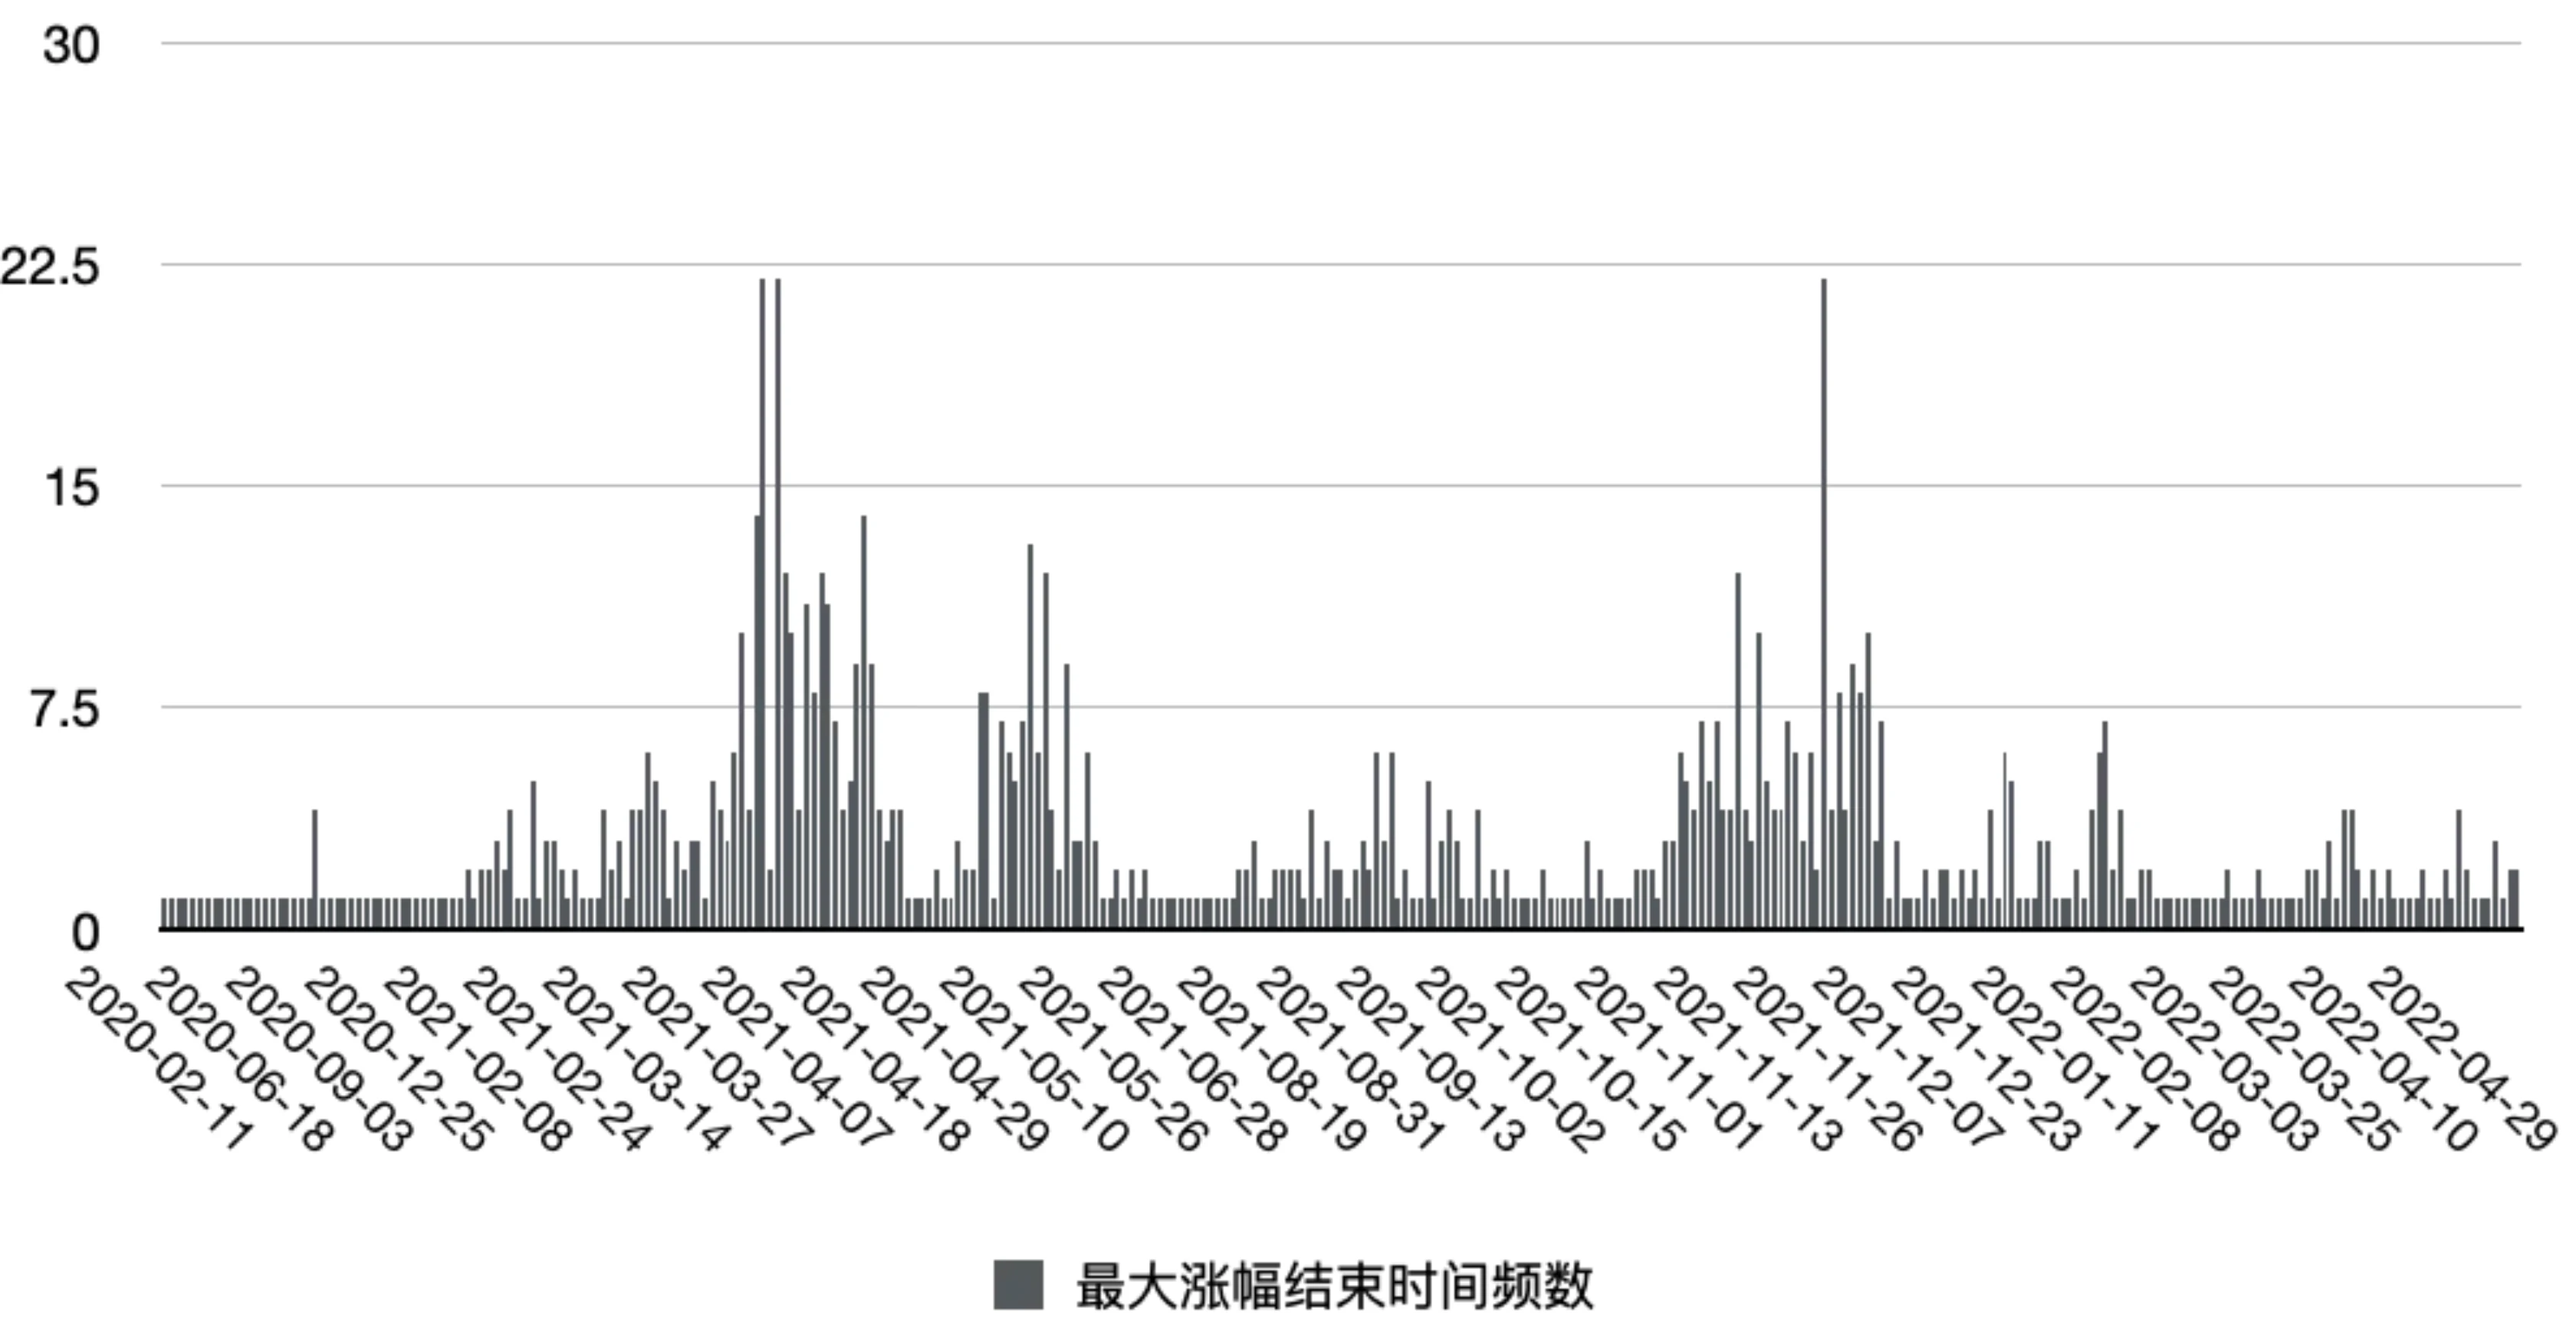
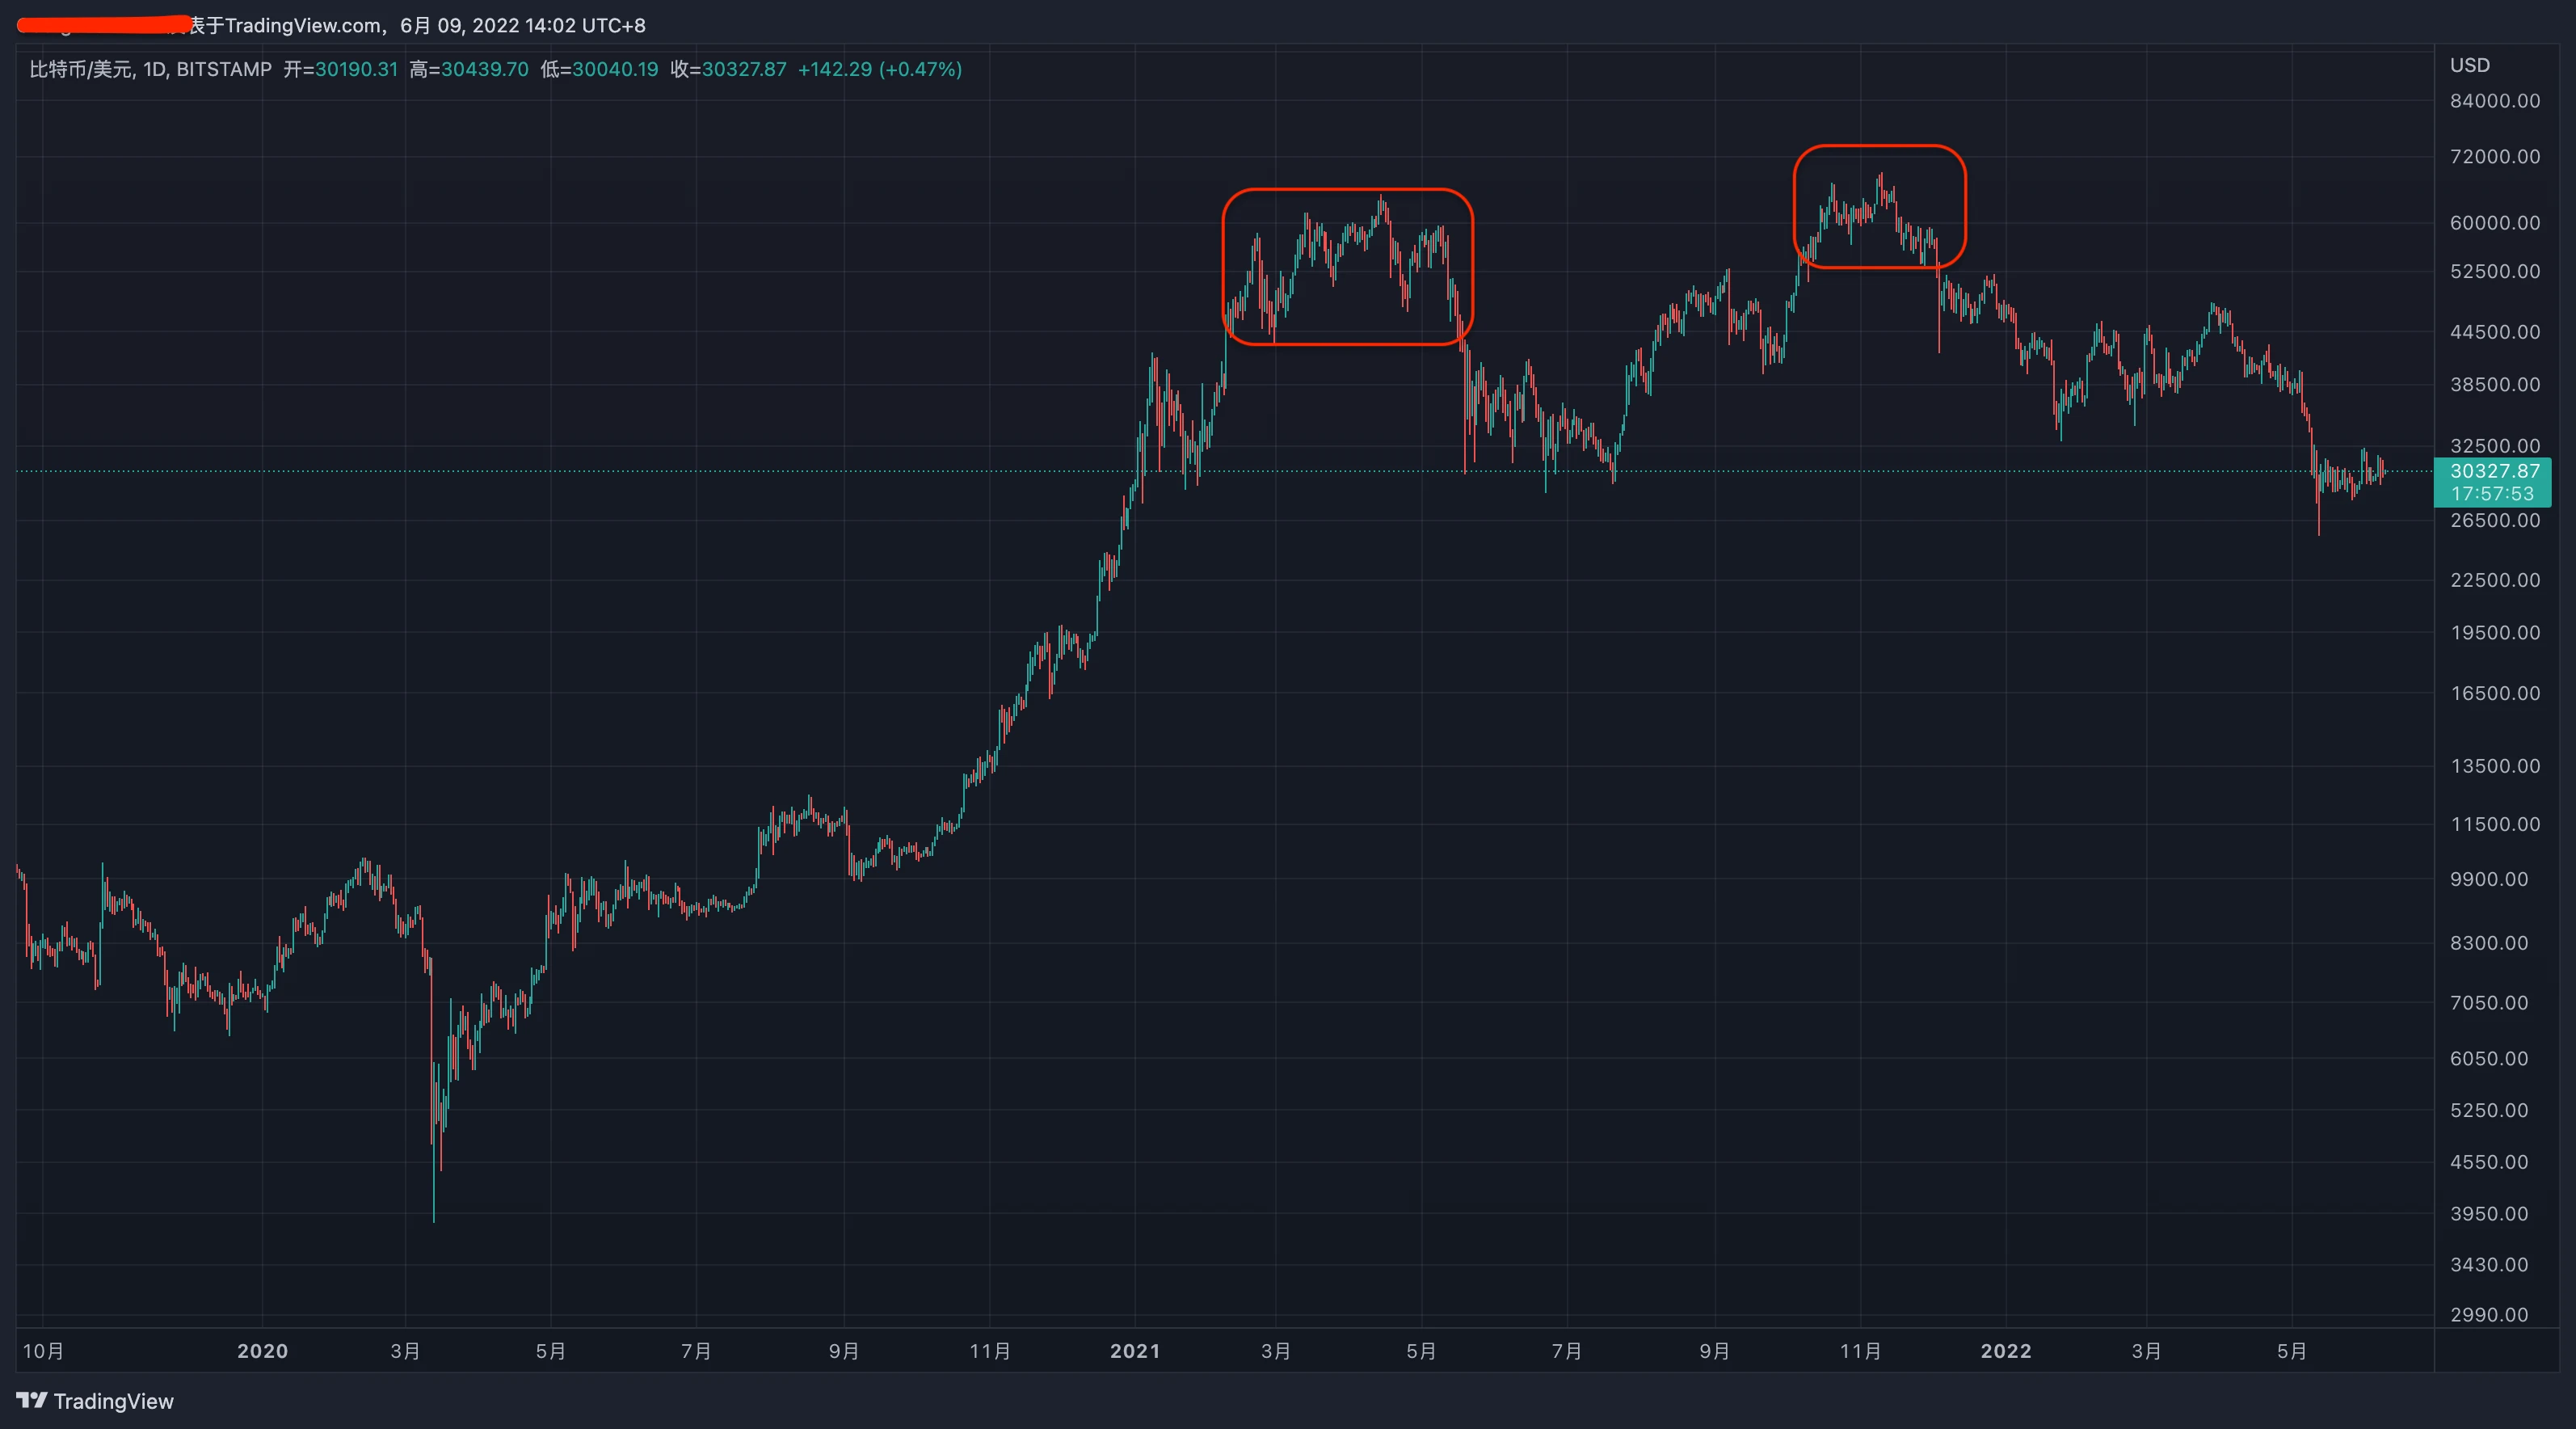
The second graph is Frequency of the end time of the largest increase, the x-axis is time, and the y-axis is frequency. The columns in the graph indicate when the currencies peaked. Most of the peak time is concentrated in April 2021 and November 2021, which is basically the same as the peak time of Bitcoin.
secondary title
Time is your friend with high returns
Next, count the frequency of the time interval. The time interval is based on the maximum increase, the time when the highest price appears - the time when the lowest price appears, and then count the frequency.
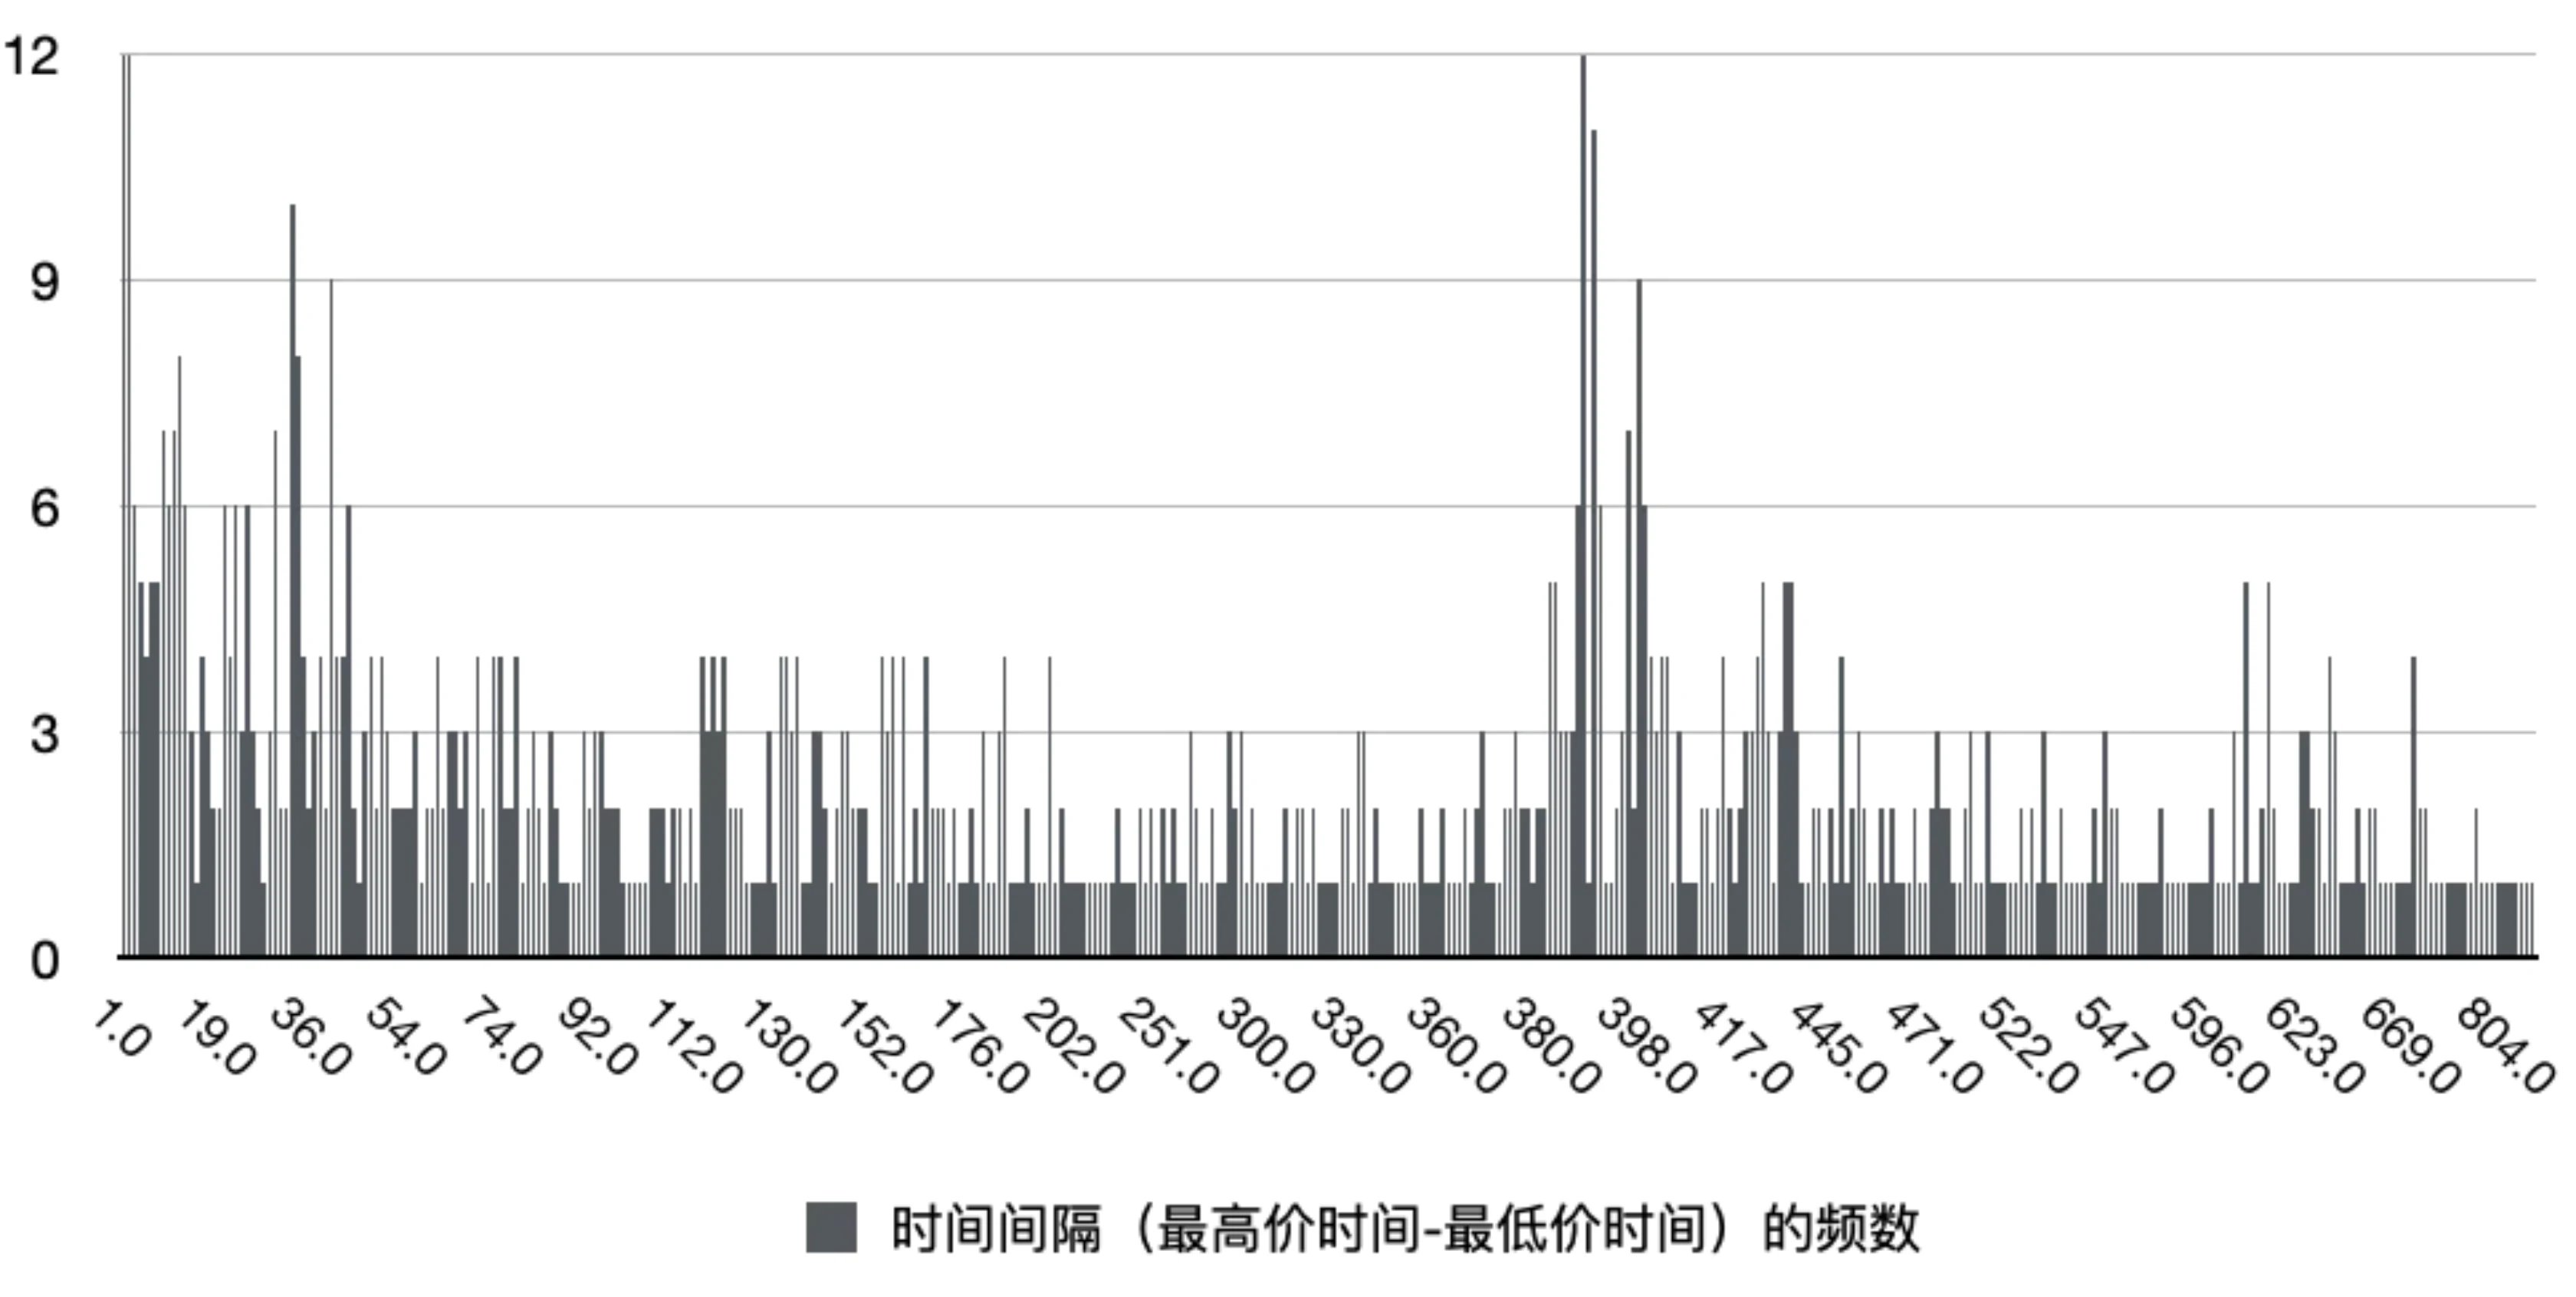
We found that the high points in the histogram are concentrated within 20 days and around 400 days, that is to say, the situation of the currency peaking can be roughly divided into two categories:
1. The opening is a high point
2. The highest point appears after one year
secondary title
Even in a big bull market, you have to be mentally prepared to be cut in half, and you may even be trapped for a year
After calculating the benefits, lets calculate the risks next.
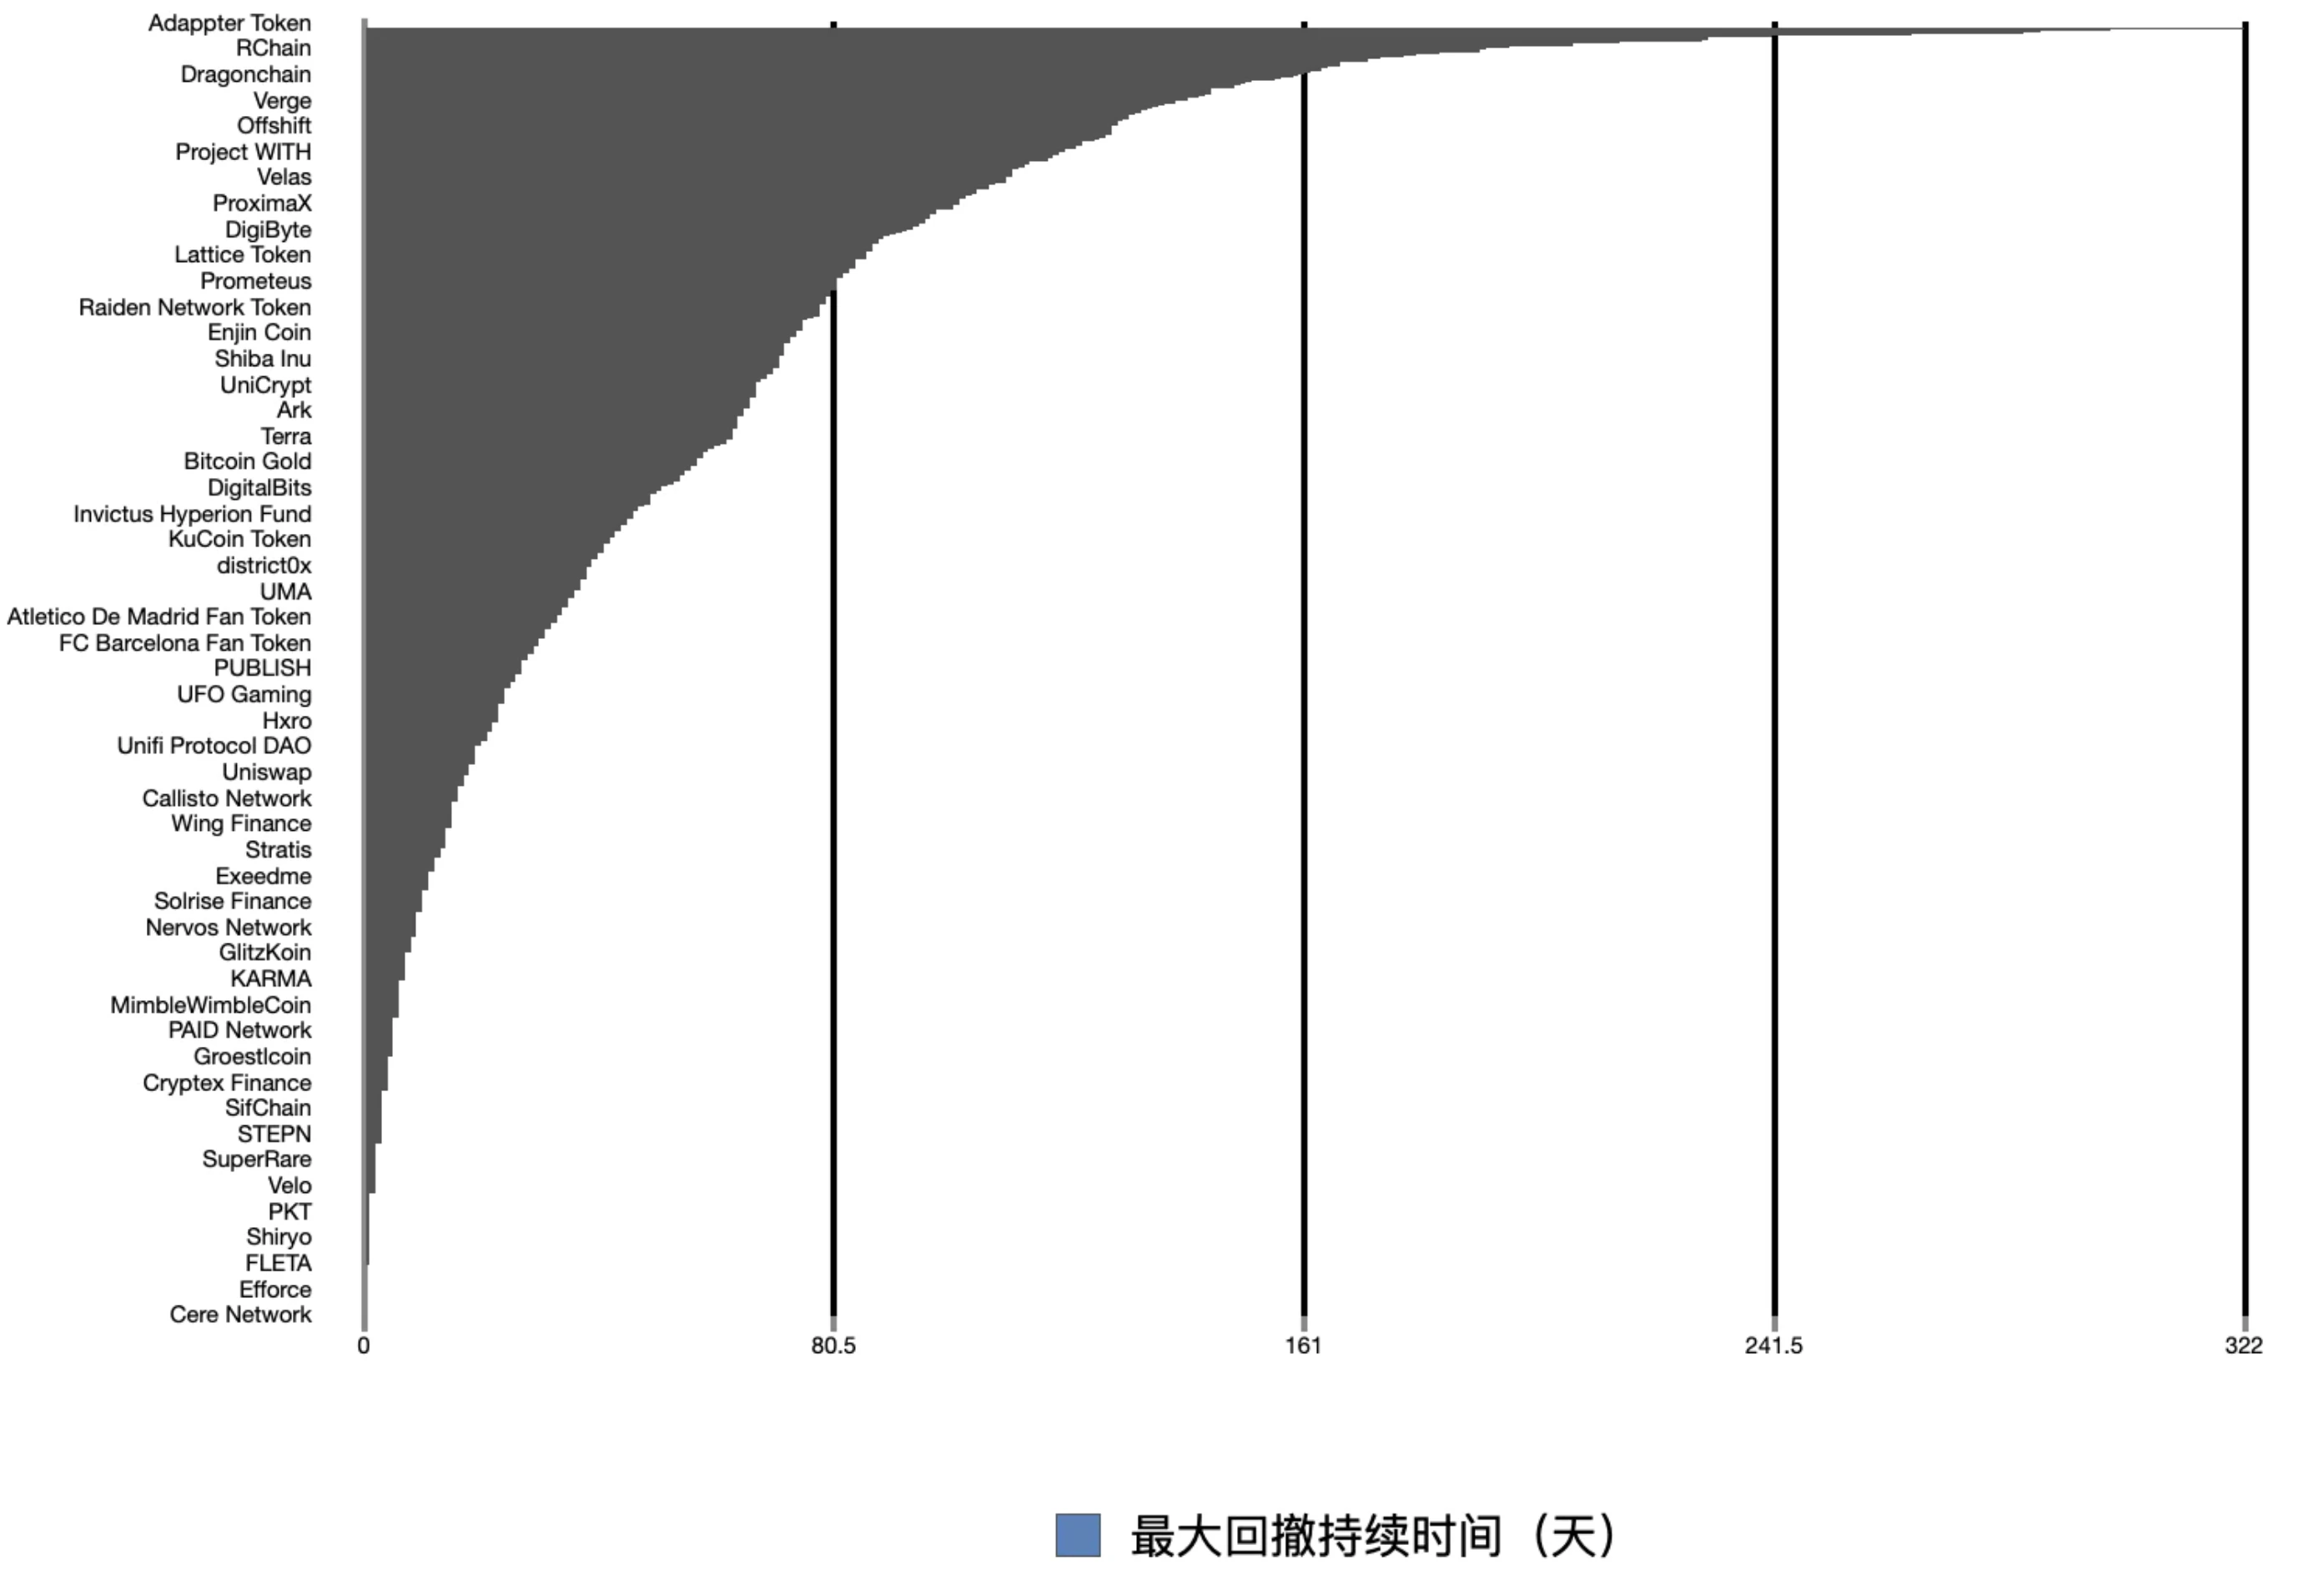
The first is to calculate the maximum retracement. The maximum retracement here refers to the maximum retracement that occurs during the maximum increase, or the maximum retracement during the bull market, not the maximum retracement in the bear market.
The average and median of the maximum retracement are 50.63% and 57.02% respectively. That is to say, even in a big bull market, you have to be mentally prepared to cut in half and withstand relatively large floating losses.
secondary title
When Bitcoin is sideways at a high level or stagflation at a high level, it is a good opportunity for small currencies to buy low and sell high or lighten their positions
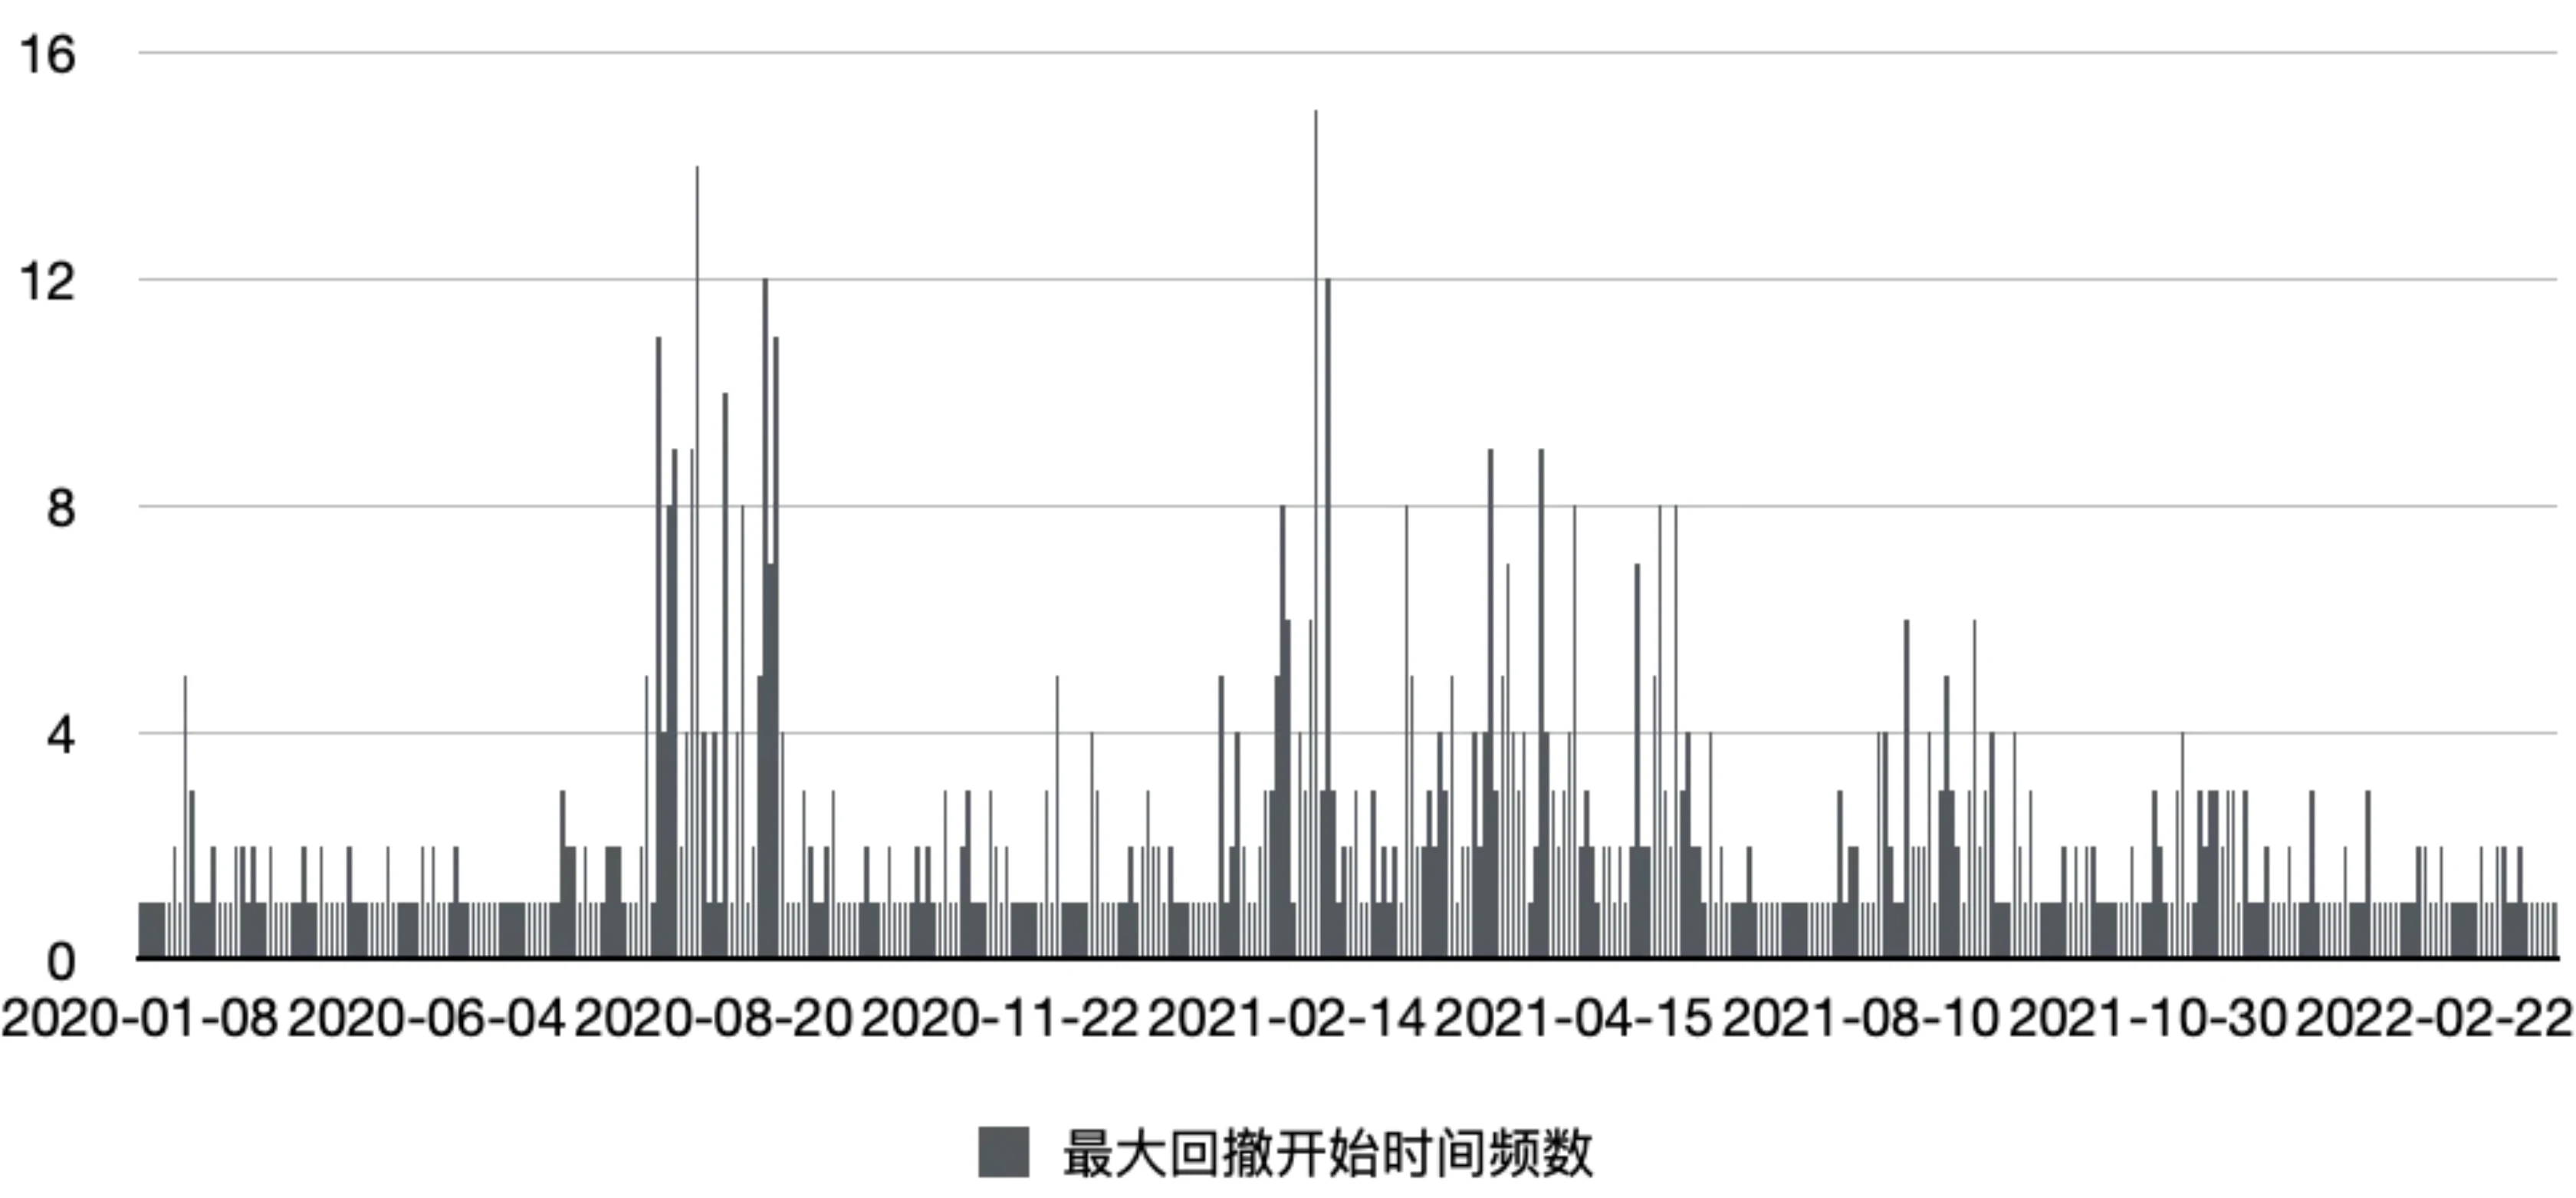
Next, lets count when the maximum retracement usually occurs.
The figure below shows the frequency of the maximum retracement start time. The two obvious peaks in the figure are concentrated in August 2020 and February-April 2021.
secondary title
The new high after the high shock, or the flashback before the market went bearish, run fast
The largest retracement does not mean the end of the bull market. As mentioned earlier, the first end of the bull market occurred in April 2021, which was two months later than the largest retracement that occurred in February 2021.
Summarize
Summarize
Through the data, we have analyzed the bull market in the past three years in a general way from the two parts of income and risk. From the data, we have extracted some viewpoints, some of which are in line with our old cognition, and some of which have subverted our cognition Or let us have a new understanding of the market, and the data will allow us to re-understand the market from a more objective and higher latitude perspective.
This article is relatively general. In addition to this article, we will write more investment research reports from the perspective of secondary market investment and data around this round of bull market, including but not limited to:
Analysis of different tracks (underlying infrastructure track, NFT track, DEFI track, SOCIALFI track, GAMEFI track, DAO track, and exploration of the rotation rules of the track)
Different ecological analysis (ETH ecology, POLKADOT ecology, SOLANA ecology, etc...)
Small currency strategy analysis (multi-factor currency selection, timing strategy, enhancement strategy, hedging strategy)
Performance Analysis of Investment Institutions

If you are interested in choosing a topic while reading the article at this time, and want to do research with us, please send an email tocontactus@lucida.onexmail.comLUCIDA is a quantitative hedge fund in the Crypto field. Its main body is located in the Cayman Islands. It entered the Crypto market in April 2018 and invested in the secondary market. It is mainly engaged in CTA, statistical arbitrage, options and other financial derivatives strategies. Provide asset management services and release in-depth investment research reports from time to time.
About Lucida
LUCIDA is a quantitative hedge fund in the Crypto field. Its main body is located in the Cayman Islands. It entered the Crypto market in April 2018 and invested in the secondary market. It is mainly engaged in CTA, statistical arbitrage, options and other financial derivatives strategies. Provide asset management services and release in-depth investment research reports from time to time.
Email: contactus@lucida.onexmail.com
Twitter:@ZnQ_626


