


The book is connected to the last time, in5 million lines of data inventory Crypto three-year bull market, LUCIDA analyzed the macro performance of the entire Crypto market in the past three years through data analysis.
introduction
introduction
The great success of Ethereum has made the smart contract public chain the holy grail that capital is chasing. At present, Ethereum is still the largest and most important platform in the smart contract public chain, but due to low performance and high cost, a large number of applications are not suitable for running on Ethereum.
first level title
1. 2020-2022 public chain market performance in the big bull market
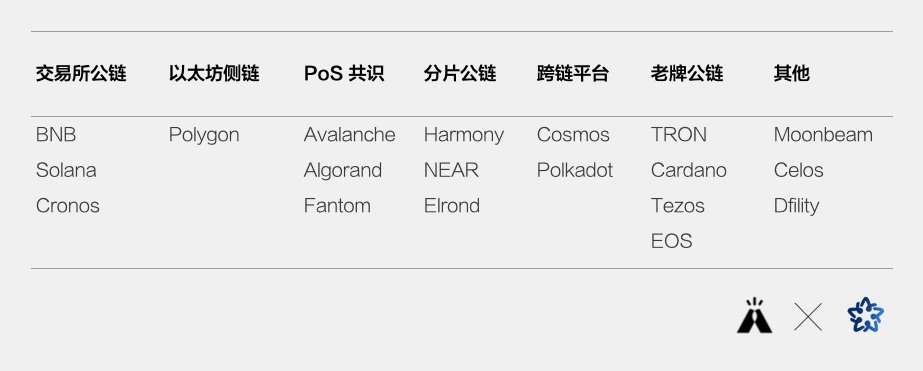
The public chain is the infrastructure and the most important part of the encryption market. The public chains discussed in this article include: smart contract platforms and cross-chain platforms, a total of 21. In addition to Ethereum, other selected samples and classifications are as follows. The standard for sample selection is the top 100 companies by market capitalization, which have established their own ecology and have a certain degree of attention.
For subsequent analysis, we also did data cleaning and preprocessing.
1.1 The formulation of public chain price index
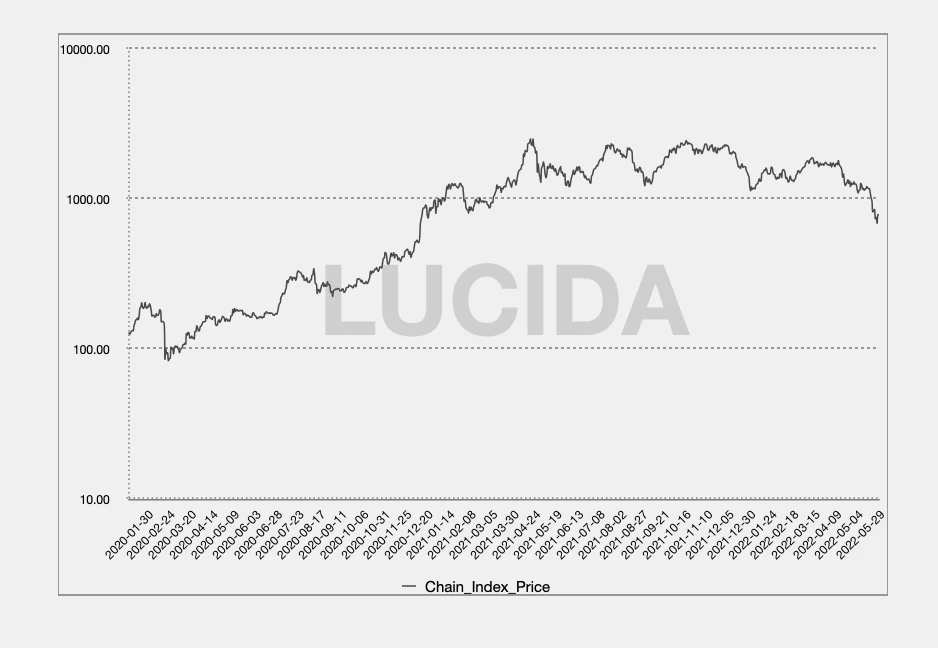
The prices of the 21 public chains are varied and varied. In order to make it easier for everyone to observe the overall performance of the track, we have made a public chain index (Chain_Index) using a weighted algorithm. The specific algorithm of the public chain index (Chain_Index) is as follows:
The public chain index price of the current day = ∑ the closing price of the underlying asset of the current day * the weight coefficient of the underlying asset of the current day
The weight coefficient of the current target = the average daily transaction amount of the underlying asset in the past 30 days / ∑ the average daily transaction amount of the target asset in the sample in the past 30 days
In order to observe the overall situation of the public chain track more conveniently, we made a chart of the public chain index price and changed the axis to a logarithmic axis.
1.2 The public chain track has a better excess return and return-to-risk ratio in the bull market
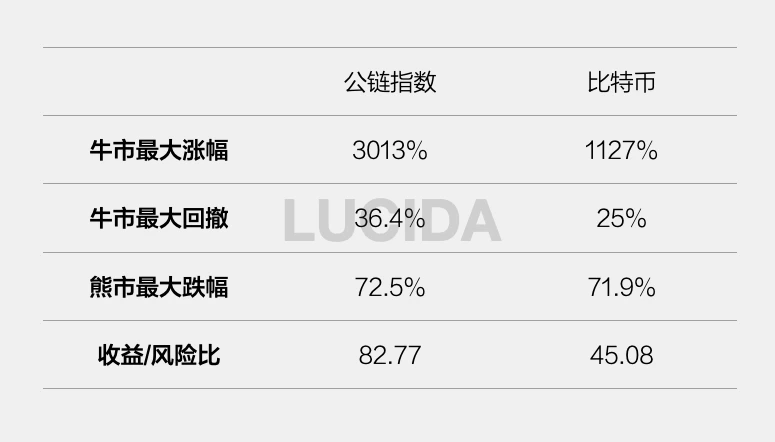
In this round of bull market, the maximum increase of the public chain index was 3013%, the lowest point appeared on March 16, 2020, which is after the 312 plunge, and the highest point appeared on May 11, 2021.
The maximum retracement of the public chain index is 36.4%, which occurred during the period from February 18, 2021 to February 28, 2021.
The largest bear market drop of the public chain index (as of June 20, 2022, when the data is obtained) is 72.5%.
If we compare the performance of Bitcoin in the same period with the largest increase, the largest retracement, and the largest decline in the bear market, we will find that the public chain track has a better profit-risk ratio than Bitcoin as a whole. Moreover, as of now, the public chain track has not shown an oversold situation in the bear market, so the defensive performance of the public chain in the bear market is not worse than that of Bitcoin. (However, assuming that the bear market continues, the possibility of the public chain compensating for the decline cannot be ruled out).
1.3 The biggest increase trend of each public chain is seriously differentiated: there are thousands of times increase, and there are also listing highs
Next, LUCIDA will conduct a separate data analysis on these 21 public chains.
Look at the income section first.
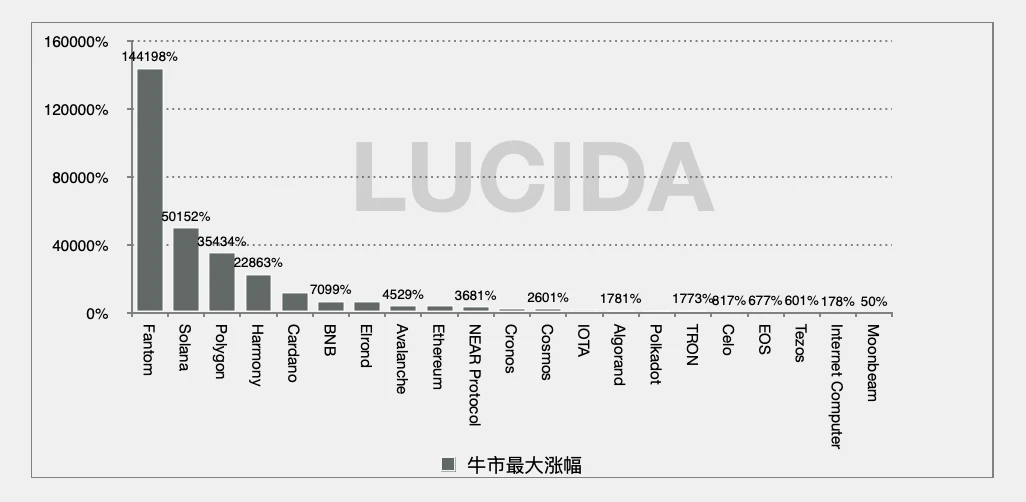
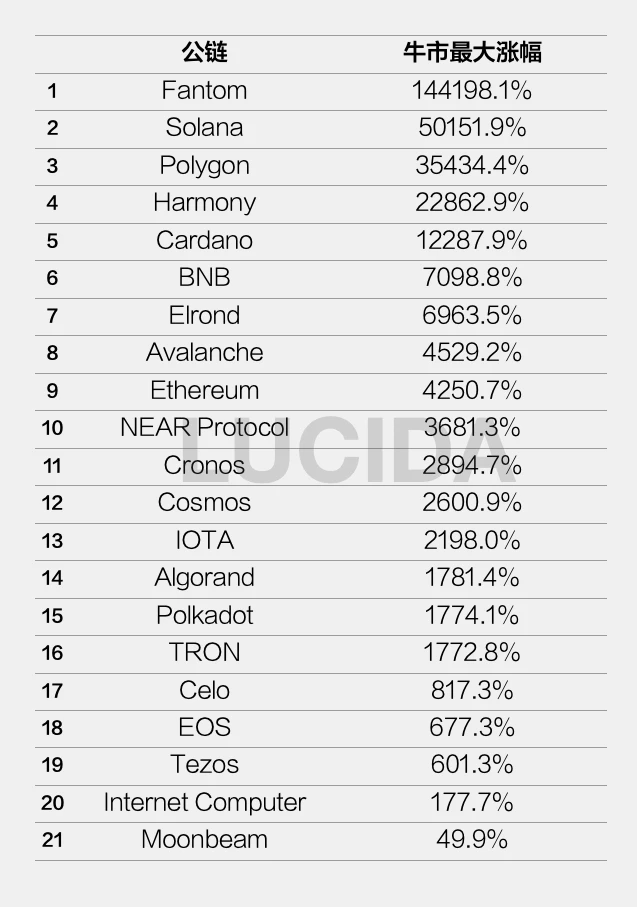
The picture above shows the largest increase of the 21 public chains under the background of the bull market. The first place is Fantom (FTM), which has reached 144198%, followed by Solana, which has the largest increase of 50152%.
LUCIDA also found that the distribution of the maximum increase in the public chain track is very scattered:
Hundred-fold increase in the first echelon: Fantom 144198%, Solana 50151%, Polygon 35434%, Harmony 22862%, Cardano 12287%
The second echelon: represented by Binance, Avalanche, and Ethereum, the maximum increase is within 100 times.
The third echelon: Represented by Internet Computer and Moonbeam, the listing is the high point.
Therefore, LUCIDA believes that investing in public chains needs to be carefully selected, otherwise it is likely to be deeply stuck.
1.4 The maximum retracement of each public chain is 60%, which lasts for 2 months, and BNB is the most resilient public chain
After talking about the income distribution, lets look at the risk part.
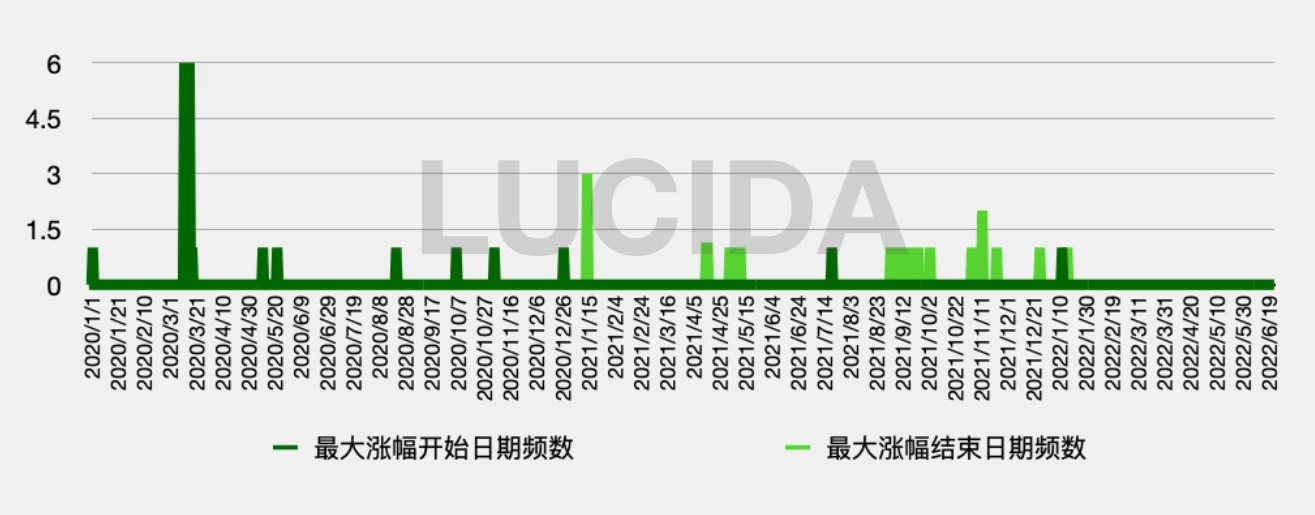
The green picture below shows the time distribution of the largest increase in the 21 public chains; most of the public chains began to rise from March to August 2020, and peaked in September to December 2021, with an average rise cycle of 467 sky.
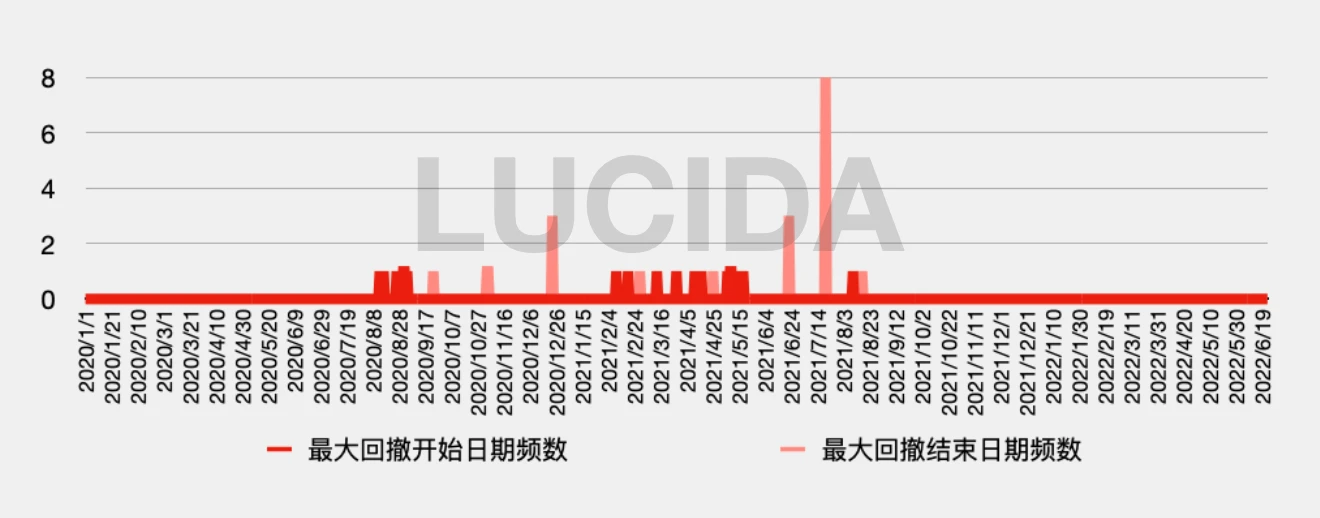
The red picture below shows the time distribution of the maximum retracement of the 21 public chains; most of the public chains experienced the maximum retracement from February to May 2021, and stabilized and rebounded from June to August 2021, with an average retracement The period is 69 days and the average retracement is 59.9%.
first level title
2. The development pattern of the public chain track in the bull market from 2020 to 2022
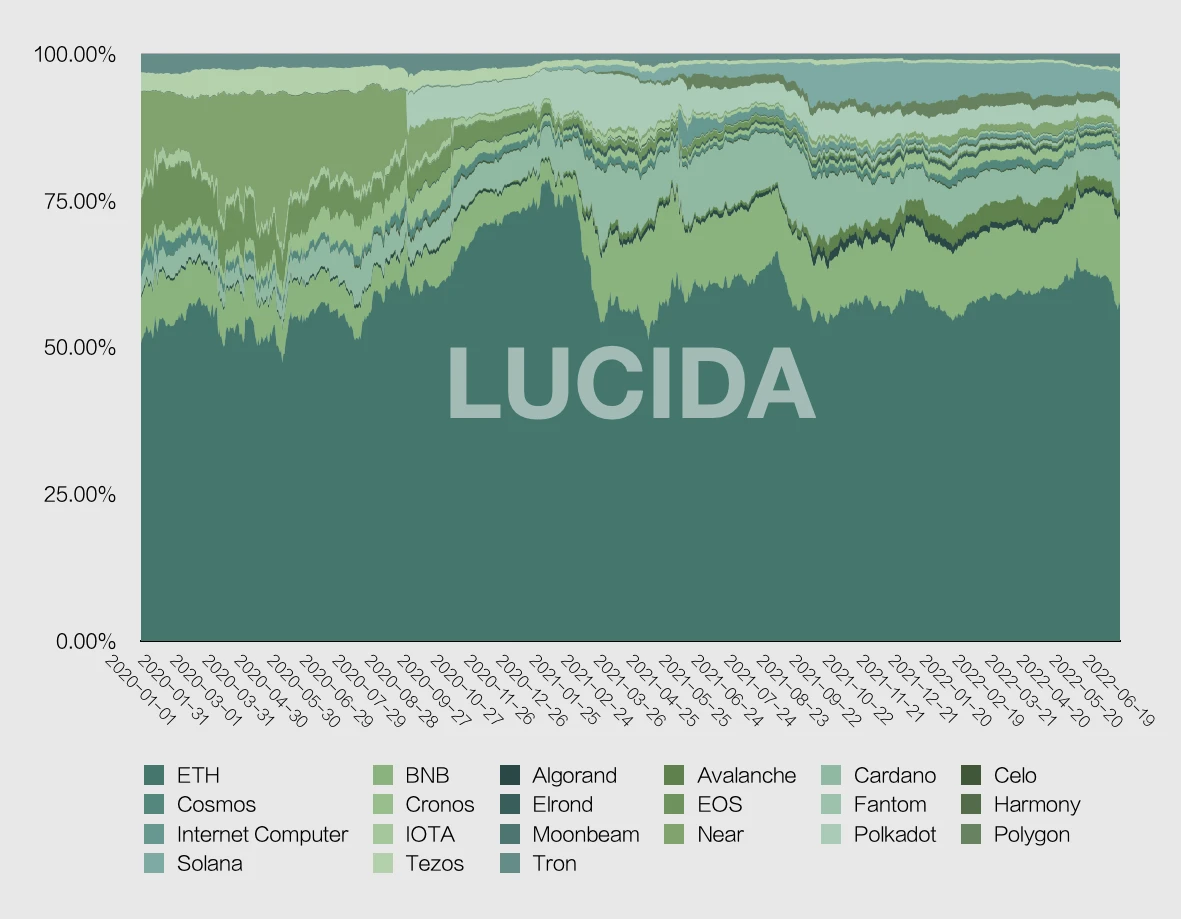
After talking about the overall performance of the track, LUCIDA will sort out the layout of the track again. In the public chain track, Ethereum is the well-deserved leader, and has always maintained a share of more than 50%. However, if we disassemble the public chain track based on the ratio of TVL and market value, we will find some interesting things.
Starting from February 2021, Ethereums TVL ratio suddenly decreased, and the BNB chain suddenly rose. Driven by the BNB chain, public chains such as Polygon, Solana, Tron, and Avalanche are squeezing Ethereums dominance.
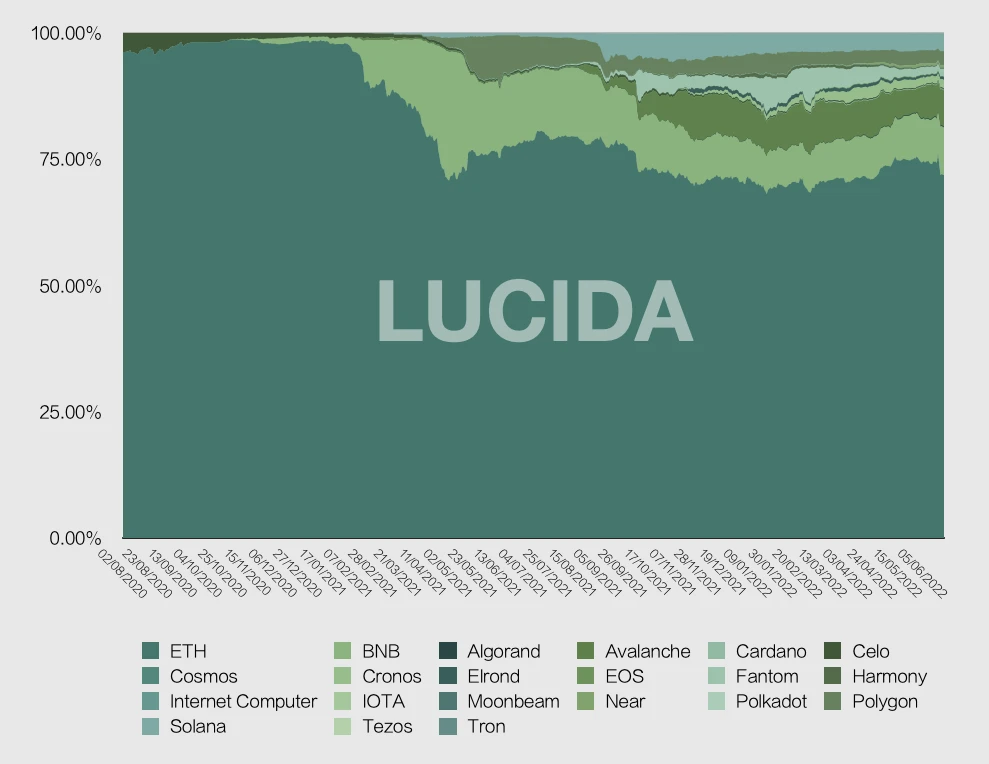
From the perspective of market value statistics, starting from February 2021, the market value of Ethereum will also drop significantly.
first level title
3. The logic of the outbreak of the public chain in the bull market in 2021
3.1 DeFi caused the overcrowding of Ethereum
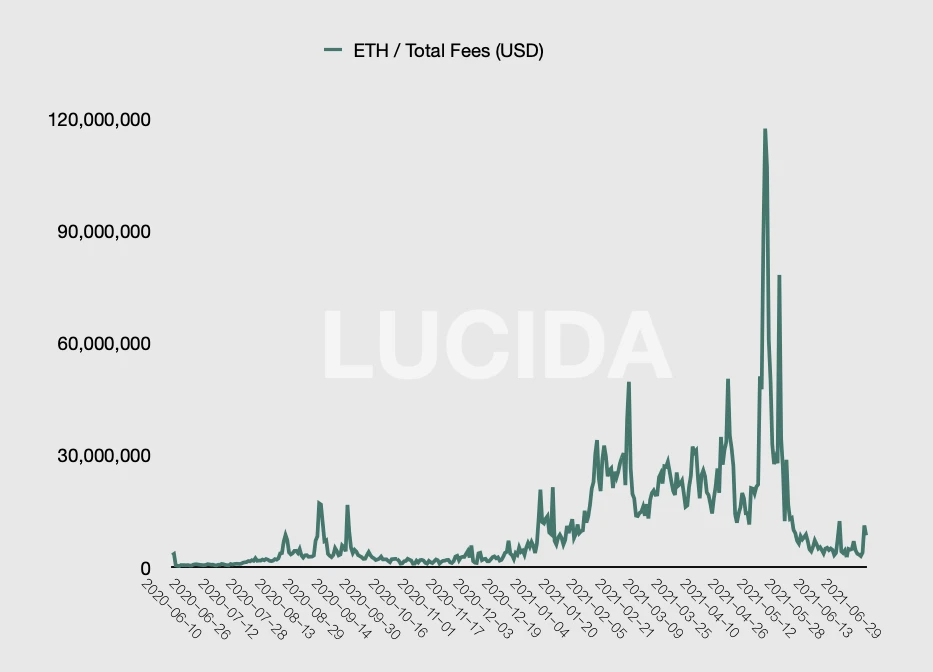
After the DeFi Summer in June 2020, the demand for Ethereum interaction has increased significantly, leading to a surge in Ethereum Gas. The liquidity mining launched by Compound detonated DeFi. In July, the mining of tokens named after food swept the entire encryption field, and the high returns completely ignited the passion of the entire encryption world. DeFi rose again in the fourth quarter. At the end of the year, not only a large number of new projects were launched, but the dynamics of the original top projects became more frequent.
With the prosperity of DeFi, the daily Gas fee of Ethereum has increased from US$447,000 to US$49.55 million, an increase of more than 100 times (June 2020-February 2021), of which the highest proportion and fastest growing transactions come from DeFi.
3.2 BSC is the first to seize the opportunity of the public chain track
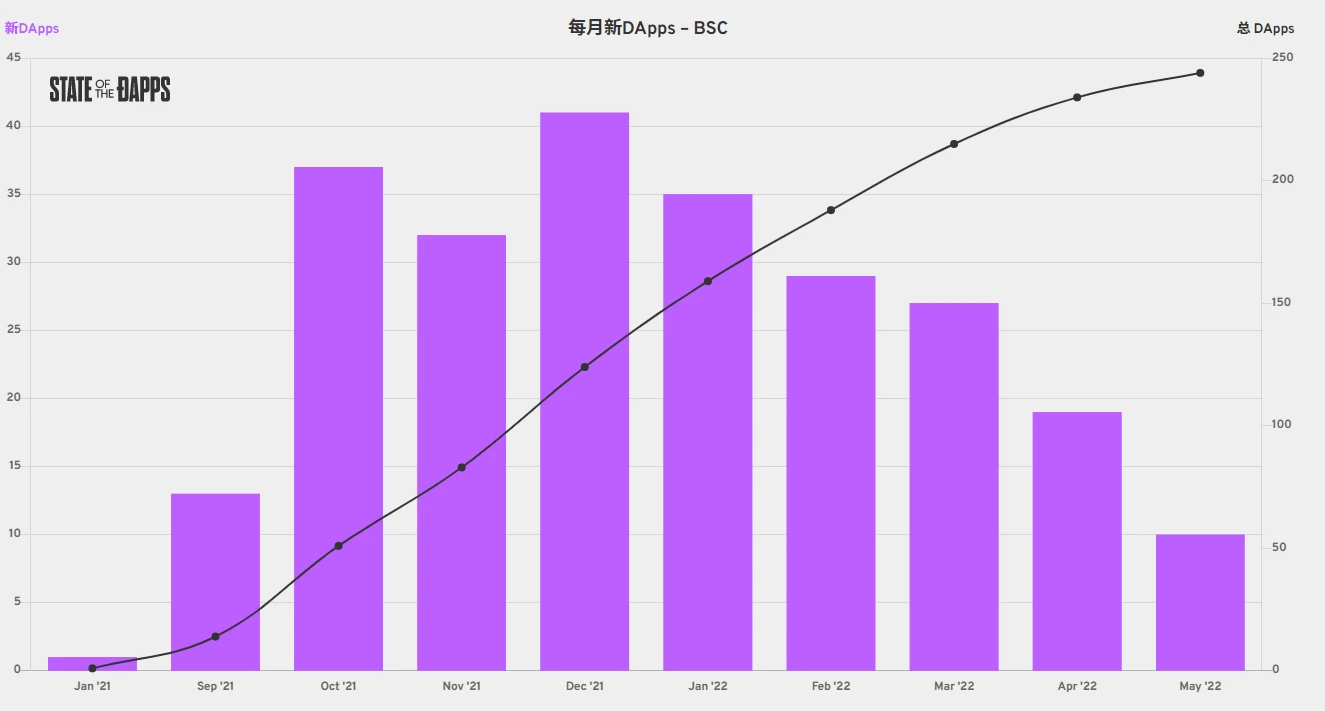
The Ethereum Gas remains high, and the DeFi wealth creation effect is in full swing. The huge demand has given the new public chain an opportunity to catch up. The first to seize this opportunity is BSC (later renamed BNB Chain), which was officially launched in September 2020. Then Binance announced the establishment of a US$100 million seed fund to support DeFi project parties and developers on the BNB chain, further supporting the ecological synergy between CeFi and DeFi. On February 2, 2021, the 5-month-old BNB chain ushered in a milestone - 1 million unique addresses. On February 9, the number of transfers on the BNB chain exceeded 1.6 million, exceeding the 1.32 million transfers on the Ethereum chain.
By being compatible with EVM, the BNB chain has undertaken the spillover needs of Ethereum, and by using BNB tokens to participate in new projects, it has empowered the BNB chain ecology. In February 2021, the explosion of the DeFi ecology of the BNB chain and the BNB market formed a mutually reinforcing echo.
3.3 Public chains such as Polygon, Fantom, Harmony, and Avalanche adopt incentive mechanisms to promote development
Polygon, which broke out in April and May, is also compatible with EVM. Unlike the way the BNB chain is empowered with BNB tokens, Polygon launched a $150 million incentive fund at the end of April, of which $40 million in liquidity mining incentive plans were directly introduced Aave, the leading DeFi protocol on Ethereum, has seen a 68-fold increase in TVL in two months.
Ecological incentives have become the standard for subsequent public chain development ecology. In September and October 2021, Fantom, Harmony, Avalanche ($180 million), Celo, and NEAR will successively launch incentive plans. Some public chains choose to be compatible with EVM, such as the BNB chain mentioned above, Polygon, and Fantom. Compatibility with EVM can better attract the Ethereum ecosystem.
3.4 Solanas strategy of light technology, heavy ecology realizes overtaking on curves
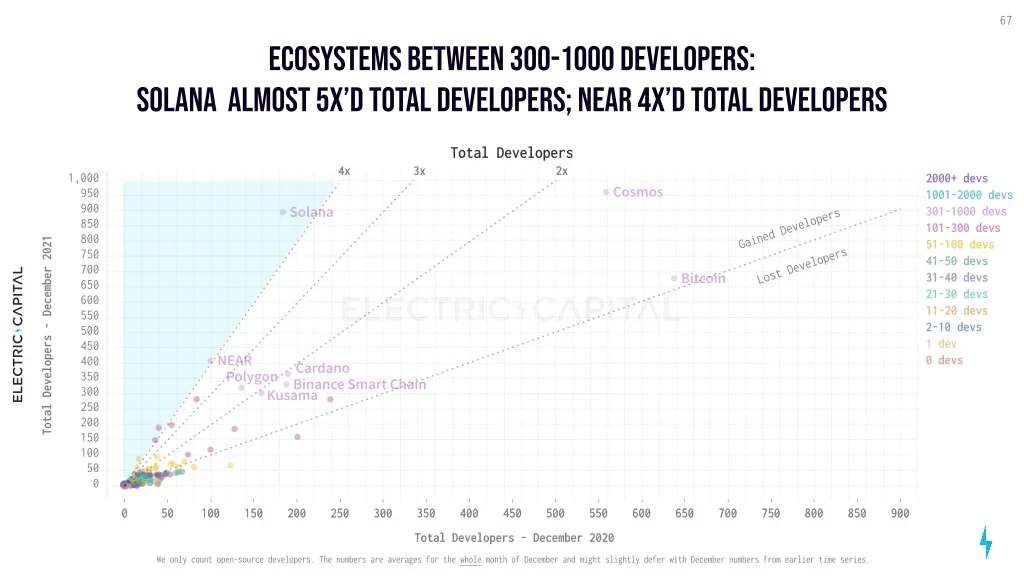
Solana is the first echelon of public chain tokens, and its rise is due to the strategy of light technology and heavy ecology. Compared with well-known PoS public chains such as Avalanche and Algorand, Solana has chosen a more centralized technical solution, which greatly reduces the difficulty of technical implementation and can be launched quickly to meet demand. In order to make the ecology prosperous, the Solana team and its investors have adopted a series of incentives to motivate users to experience their platform, such as introducing liquidity mining, providing subsidies for developers, holding hackathons, providing donation funds, etc.
As shown in the figure below, the Solana chain has attracted many developers. In 2021, the number and growth rate of developers in the Solana ecosystem will be at the forefront.
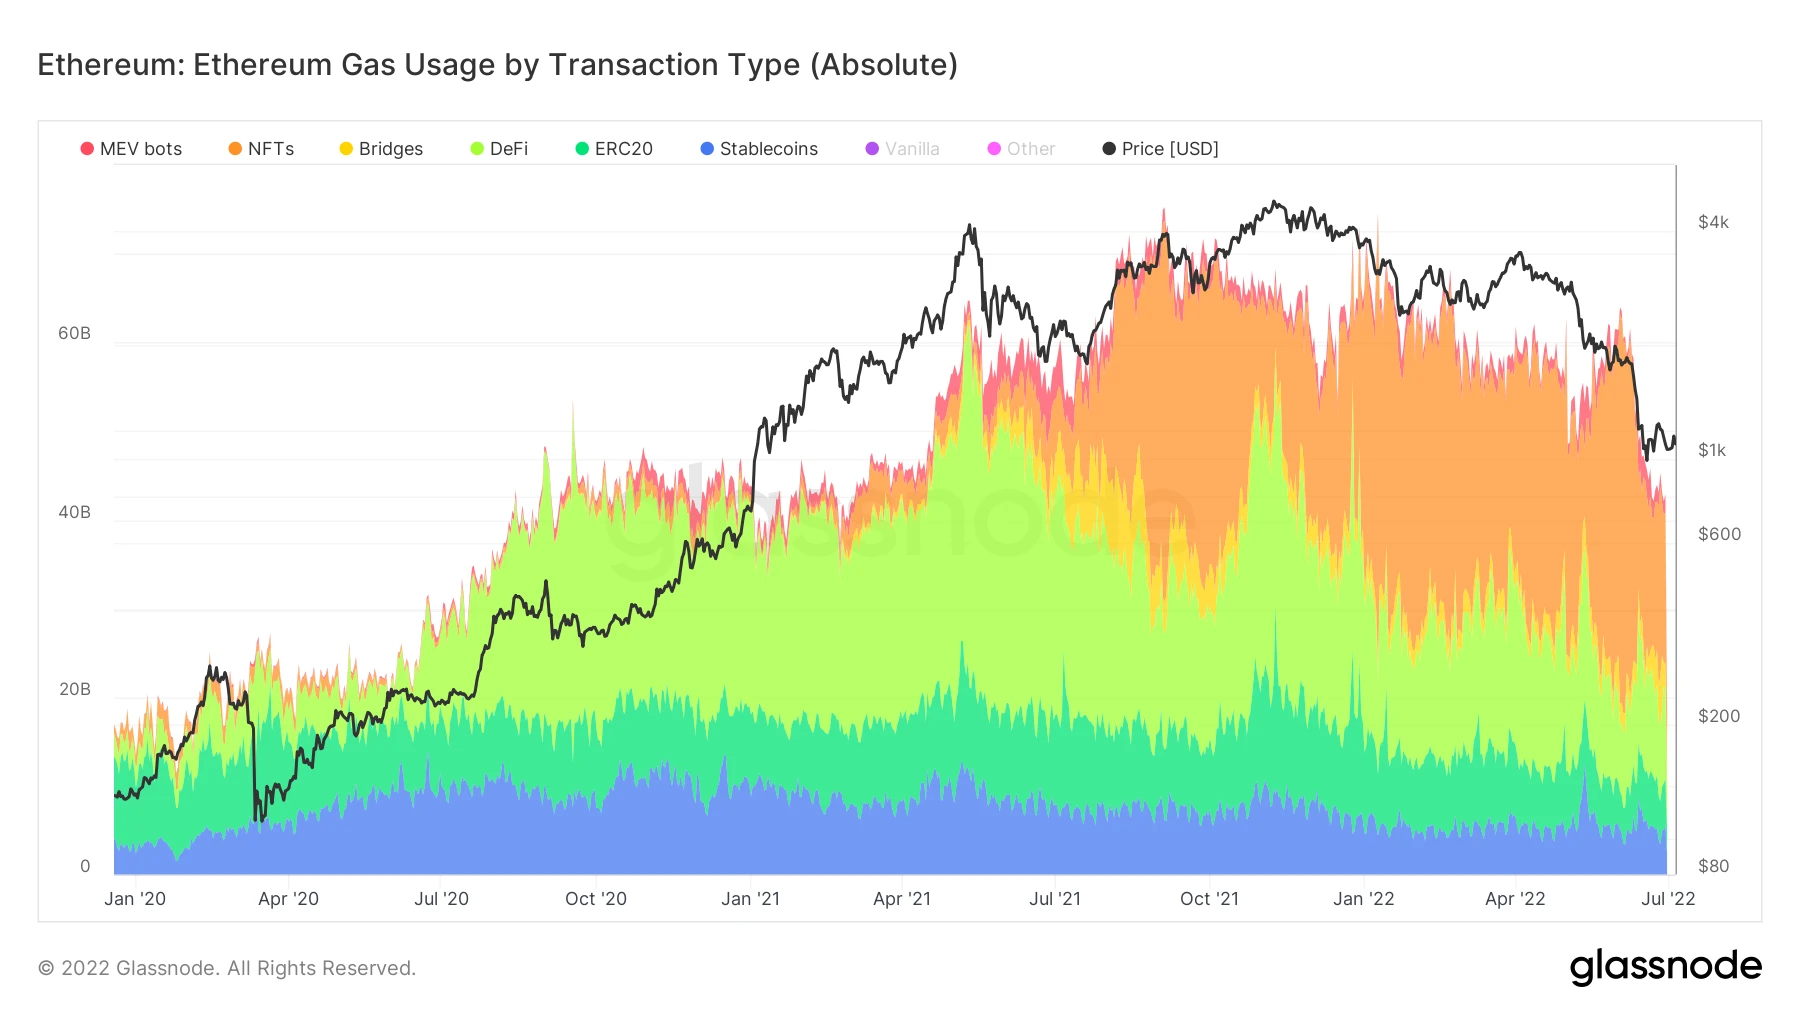
3.5 NFT detonates the demand for public chain again
From the second half of 2020 to the first quarter of 2021, NFT will be the largest source of public chain demand.
In the second quarter of 2021, NFT took over DeFi and became the second application field that brought a lot of transaction demand. With the joining of stars from all walks of life, NFT began to spread and go out of the circle, a large number of investors and projects emerged, and the scale of NFT transactions continued to expand. As the first public chain, Ethereum has absolute advantages in terms of capital, number of developers, and ecological scale, so it has the most NFT projects. At the same time, the NFT tracks of other public chains are also developing rapidly. For example, on the Solana chain, its NFT transaction volume even rose against the trend when the market was down in May 2021. At present, it has become the second largest NFT ecosystem after Ethereum.
3.6 Specific reasons for the logic of the public sprocket
Therefore, it can be said that the outbreak of the public chain in this round of bull market is caused by the prosperity of the application layer and the lack of scalability of Ethereum. The logic of public sprocket movement can be summed up for the following reasons:
The prosperity of DeFi has caused excessive gas fees and congestion on Ethereum. This situation will continue until 2021. The rotation and prosperity of NFT and GameFi will continue to put forward requirements for the scalability of the public chain.
During the bull market, the huge demand of various applications has enabled the public chain with fast technology implementation and strong capital to take the lead and attract various applications to join the ecology.
Different public chains have different resource endowments. Even if the general formula of compatible EVM/cross-chain bridge + ecological incentives is also used, the specific strategies are also different. The BNB chain and Solana use platform tokens to empower, and Polygon introduces the DeFi protocol at the head of Ethereum.
EVM compatibility can enjoy the achievements of Ethereum faster, including Fork protocol and developers.
3.7 Cosmos and Polkadots technical difficulties and slow implementation are one of the reasons affecting the increase
The counter-examples here are Cosmos and Polkadot. They have not enjoyed too many benefits brought by this bull market. First, the public chain technology is difficult and slow to implement, and then the compatibility with Ethereum is not good enough, so another cross-chain bridge needs to be built Go and connect with Ethereum.
first level title
4. The moat of the public chain
After a round of bull market baptism, the new public chain has attracted developers and users, and also established its own infrastructure and application ecology. As V God said, the future will be a multi-chain structure, so what kind of moats have been built by each public chain after this round of bull market.
4.1 Ethereum
Ethereum ranks second in the market value of the encryption market, accounting for 17% - 22% of the long-term market value, which is of great significance to the entire encryption market. The data in the Ethereum Ecosystem Report for the First Quarter of 2022 shows that the number of DApps running stably on Ethereum is 4,011, and there are more than 7,220 smart contracts.
Ethereum is the public chain with the highest moat, with a high degree of network decentralization and security, a large number of users, and a large number of developers. Complete infrastructure (wallet, oracle, developer tools), rich types of applications, has formed a network effect, has the soil for innovation, and has always led the trend of blockchain applications:
(2017-2018) At the end of 2015, Ethereum proposed the ERC20 standard, which eventually directly brought about the bull market caused by the issuance of ICO in 2017. In 2017, the issuance of smart contracts has expanded the boundaries of blockchain technology, and blockchain has entered the mainstream as an underlying technology. In this round of the market, Ethereum’s market value ranked second, which laid the foundation and drove the valuation of other smart contract platforms and infrastructure sectors; in the ETH ecosystem, the number of DAPPs exploded, and the NFT, chain games, and forked coin sectors rose significantly. ETH initially became the anchor target of the altcoin market.
(2020-2021) In this cycle, the total market capitalization of cryptocurrencies reaches a maximum of 3 trillion US dollars, and the transaction volume of the Ethereum network exceeds 3.6 trillion US dollars. The market value of Ethereum has risen from 11% in early 2021 to about 20%. In this round of market, the sector rotation in the Ethereum ecosystem includes DeFi (DEX, AMM, liquidity mining, mortgage lending), NFT, Meme, GameFi, Metaverse, etc.
(2021 - 2022Q1) In the small cycle of the encryption market, in addition to the continuation of NFT and DeFi hotspots, the markets reconstruction of the valuation logic of the public chain has pushed up the market for the public chain.
In the above process, the projects that appear in each cycle of the Ethereum ecosystem will undergo a reshuffle in the bear market. Only 10%-20% of the projects survive and grow stronger, becoming important blue-chip projects and common infrastructure in the next cycle.
Despite the multi-chain trend, the share of the total locked value (TVL) on the Ethereum network has been diluted, and the second-tier expansion plan has been implemented. As the new public chain continues to divert the developers, users, and applications of Ethereum, Ethereum itself has reduced the fluctuation of GAS and the speed of ETH issuance through the upgrade of EIP-1559, and has provided multiple L2 blockchains including Optimism, Arbitrum, and dYdX. The agreement opened the curtain on the stage.
4.2 Binance Smart Chain
BSC will be officially launched in September 2020. Shortly after BSC’s TVL crossed the $15 billion mark in Q2 2021, its TVL more than doubled to $35 billion in ten days as the price of BNB and its derivatives such as CAKE and XVS surged .
After the sharp drop in the encryption market on 5.19, BSC became the most active attack platform for hackers, with 6 consecutive attack incidents, and flash loans were the most important attack method. The amount of loss was generally large, and the currency price was greatly affected in a short time. The euphoria of hitting new all-time highs quickly faded as a series of negative catalysts hit the market, including the $200 million Venus liquidation and the $45 million PancakeBunny flash loan attack. The rise in exploits drained user confidence and caused token prices and TVL to plummet. From March to September 2021, the average TVL market share remains around 15%.
The advantage of the BNB chain is that it has a huge user base, as well as the support of Binances capital, technology, human resources and other resources. The disadvantage is that the network is highly centralized, and the ecology relies heavily on the Ethereum developer community.
4.3 Solana
Solana Protocol mainnet beta launched in March 2020. As of now, there are nearly 2,700 projects on the Solana chain, covering 8 major fields such as DeFi, wallets, NFT, infrastructure, and decentralized games, as well as 15 subdivisions such as stablecoins, DEX, and derivatives.
Solana has developed a relatively complete NFT ecological foundation, such as project tools and trading markets. Magic Eden is a Solana-based NFT marketplace. It chose the non-EVM Solana for construction in the early stage of development, because it valued its high-performance advantages and concentrated its efforts on the vertical field of games. At present, the transaction volume accounts for more than 97% of the entire Solana ecosystem. It is worth noting that Opensea only supported Ethereum before, and began to support Solana in April this year, but most of the transactions of its head project Okay Bears are still completed in Magic Eden.
V. Conclusion
V. Conclusion
The market performance of public chain tokens is both explosive and highly resistant to risks. It is a very important sector in asset allocation. Judging from the outbreak of the public chain in this round of bull market, although Ethereum has a first-mover advantage, the pattern of the public chain has not yet been determined. Whether it is through ecological incentives, better connection to Ethereum, or the introduction of popular applications, the public chain can quickly occupy market share. Before the official launch of the public chain or the ecological outbreak, the performance of the expected public chain market is slightly worse. It can be seen that the public chain is a field driven by demand.
This round of bull market public chain has benefited from the explosion of DeFi, NFT applications and the insufficient processing capacity of Ethereum. Whoever can provide the performance support and financial support required by new applications will be able to develop rapidly. This logic is expected to be slightly different in the next cycle. The reason is that after market precipitation, high-quality applications that go through bulls and bears will occupy more markets, and the public chains where these applications are located will benefit accordingly.
Authors and References
Lisa Yao@SnapFiners DAO, Aoao @SnapFingers DAO, LiHui@LUCIDA, George@LUCIDA, ZnQ_626@LUCIDA
Horizontal comparison of 6 public chains from 6 angles、Review of the 2021 public chain track、2021-2022 Blockchain Trend Report、2020-2021 ReportLUCIDA is a quantitative hedge fund in the Crypto field. Its main body is located in the Cayman Islands. It entered the Crypto market in April 2018 and invested in the secondary market. It is mainly engaged in CTA, statistical arbitrage, options and other financial derivatives strategies. Provide asset management services and release in-depth investment research reports from time to time.
About Lucida
LUCIDA is a quantitative hedge fund in the Crypto field. Its main body is located in the Cayman Islands. It entered the Crypto market in April 2018 and invested in the secondary market. It is mainly engaged in CTA, statistical arbitrage, options and other financial derivatives strategies. Provide asset management services and release in-depth investment research reports from time to time.
About SnapFinger DAO
LUCIDA Past Articles
LUCIDA CONTACT
Twitter:@ZnQ_626 / @lucidafund
website:https://www.lucida.fund


