


introduction
first level title
introduction
text
Since the crypto market has shrunk by nearly $2 trillion, the overall rise some time ago has triggered speculation among some market observers about the bottom. Given that there have been many collective surges in encrypted assets in history, which later proved to be nothing more than bear market rallies, there are still many differences in the market as to whether the panic selling is over.
Considering that encrypted assets are almost in sync with U.S. stocks, coupled with the background of inflation explosion and the Federal Reserve’s interest rate hike and shrinking balance sheet, the investment decision of encrypted assets seems to have become more difficult. But is everything really untraceable?
One of the core laws of the financial market is mean reversion. As long as the market does not disappear, there must be cycle changes and bull-bear cycles. Although the history will not be the same, it will be similar.
For a long time, we have been looking for ways to correctly evaluate the value of encrypted assets. Since most assets are circulated on the chain, the open and transparent nature of the blockchain means that there are abundant data and indicators for mining, analysis and reference .
In this article, we try to trace back the entire development cycle of this round of bull market (gaining momentum - skyrocketing - breaking through $64,000 - crashing - adjusting - skyrocketing again - hitting a new high of $69,000 - second crash), with on-chain data and Indicators, hoping to extract data worthy of collection and attention from it, to help everyone clear the fog and gain a more comprehensive and in-depth understanding of the encrypted world.
1. How to steadily obtain the β income of the encryption circle
In the traditional market, there are α income and β income. Among them, β income refers to the average return of the market, such as SP 500, Shanghai Composite Index, and α income refers to the part of the investment that is higher or lower than the market average. It is usually used to Investigate the ability to actively invest.
secondary title
1. What is the current stage of the market?
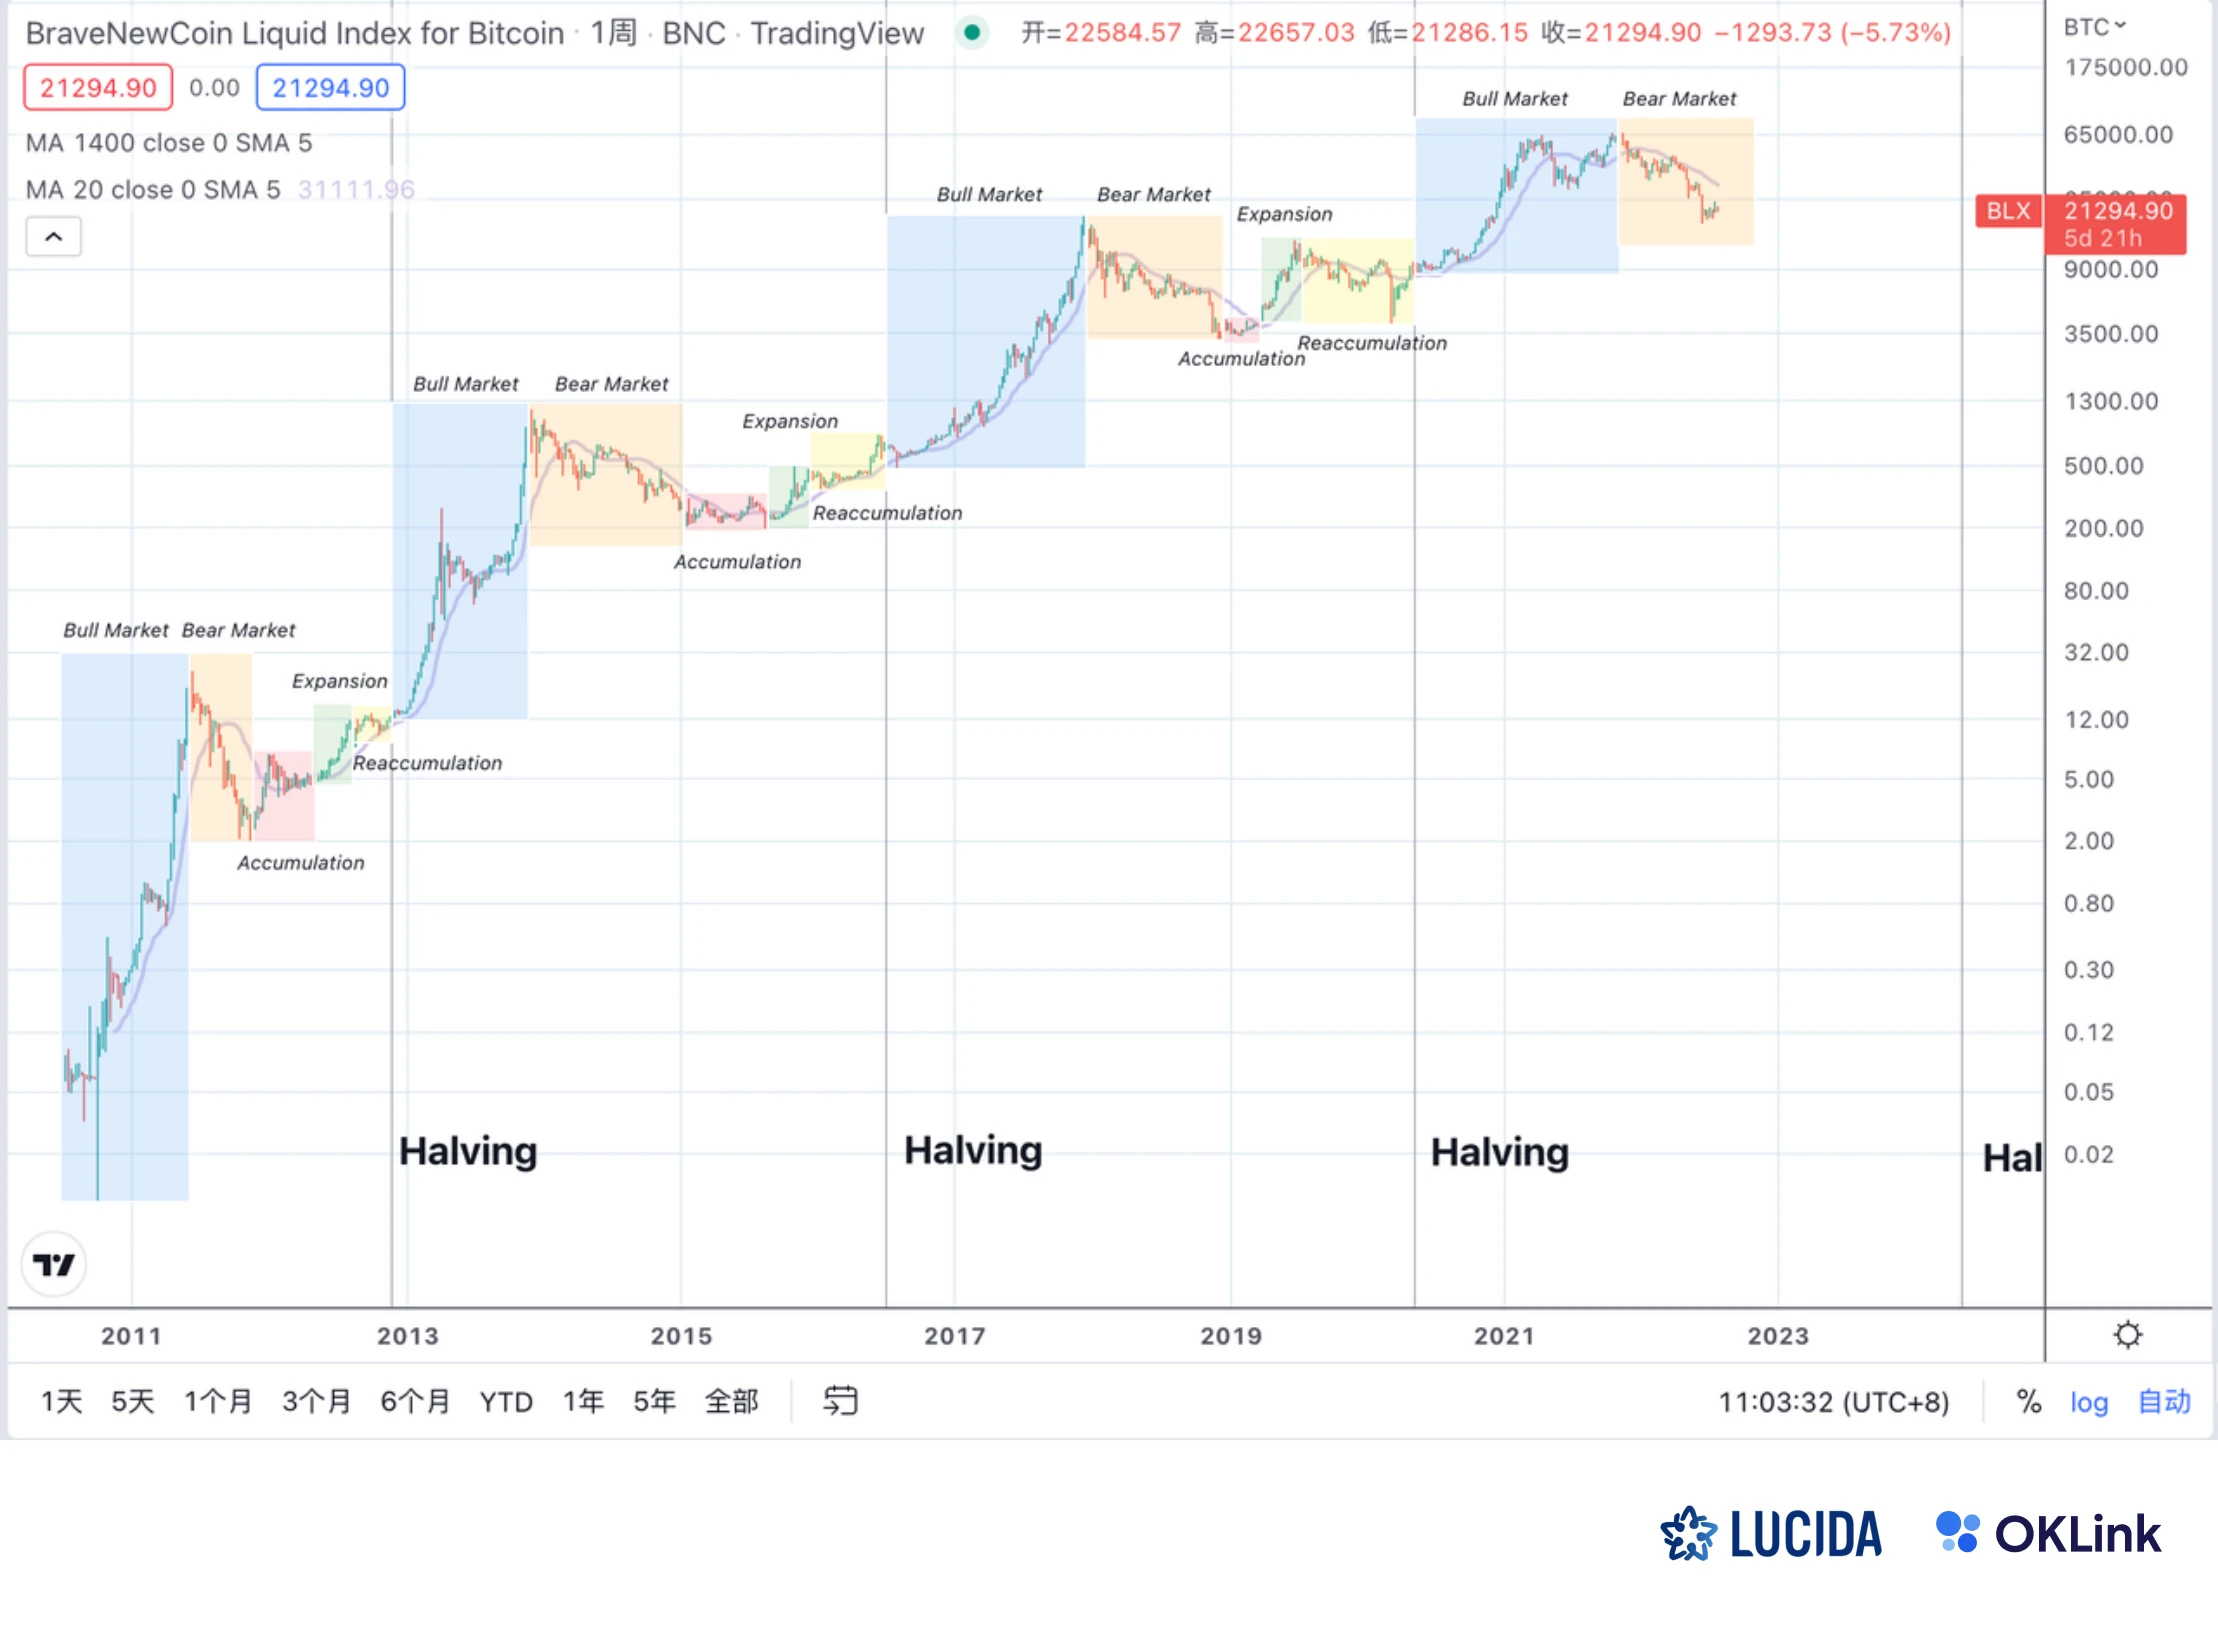
We use the three halving days of BTC (2012-11-28, 2016-07-04 and 2020-05-12) as reference points, and each round of BTCs new high and new low as the dividing point to draw the following figure.
image description
BTC cycle chart, Tradingview data
As can be seen:
1) Each round of halving cycle is divided into 5 stages, namely bull market, bear market, accumulation, expansion and re-accumulation;
2) There is almost a year or a year and a half between the bottom of the bear market and the halving day;
3) A bear market is a good opportunity to open a position;
5) It is currently in the middle and late stages of the bear market. If there is no accident, it will usher in accumulation in Q4;
6) During the three halving cycles, the maximum drawdown of BTC was 94%, 86% and 84% respectively, and the maximum decline of BTC in this round was 74%. The length of the bear market in the seeking the sword style (there is still a deviation of 2-4 months in the current time dimension), so the price still has a certain room for decline.
7) Each round of a big bull market will greatly exceed the highest point of the previous round of bull market, and investors who have poor buying costs in the previous round of bull market will be released. Therefore, there is an old saying in the industry: Bitcoin never traps people.
secondary title
2. How to buy the bottom and escape the top?
In a bear market, the bubble has been largely cleared. Building a position here means that the cost will not be too high, and it is also a source of safety cushion and high returns. All we need to do is wait for the arrival of the bull market.
In fact, it is difficult for most people to do this. After all, building positions in a bear market is anti-human. But if you still believe in the encryption market and can withstand the suffering and desolation, the bear market will be a very cost-effective opportunity to participate.
Now that it is clear that we are in a bear market, where is the absolute bottom of BTC? And when to sell is considered selling at a high point?
1) ahr999 hoarding indicator
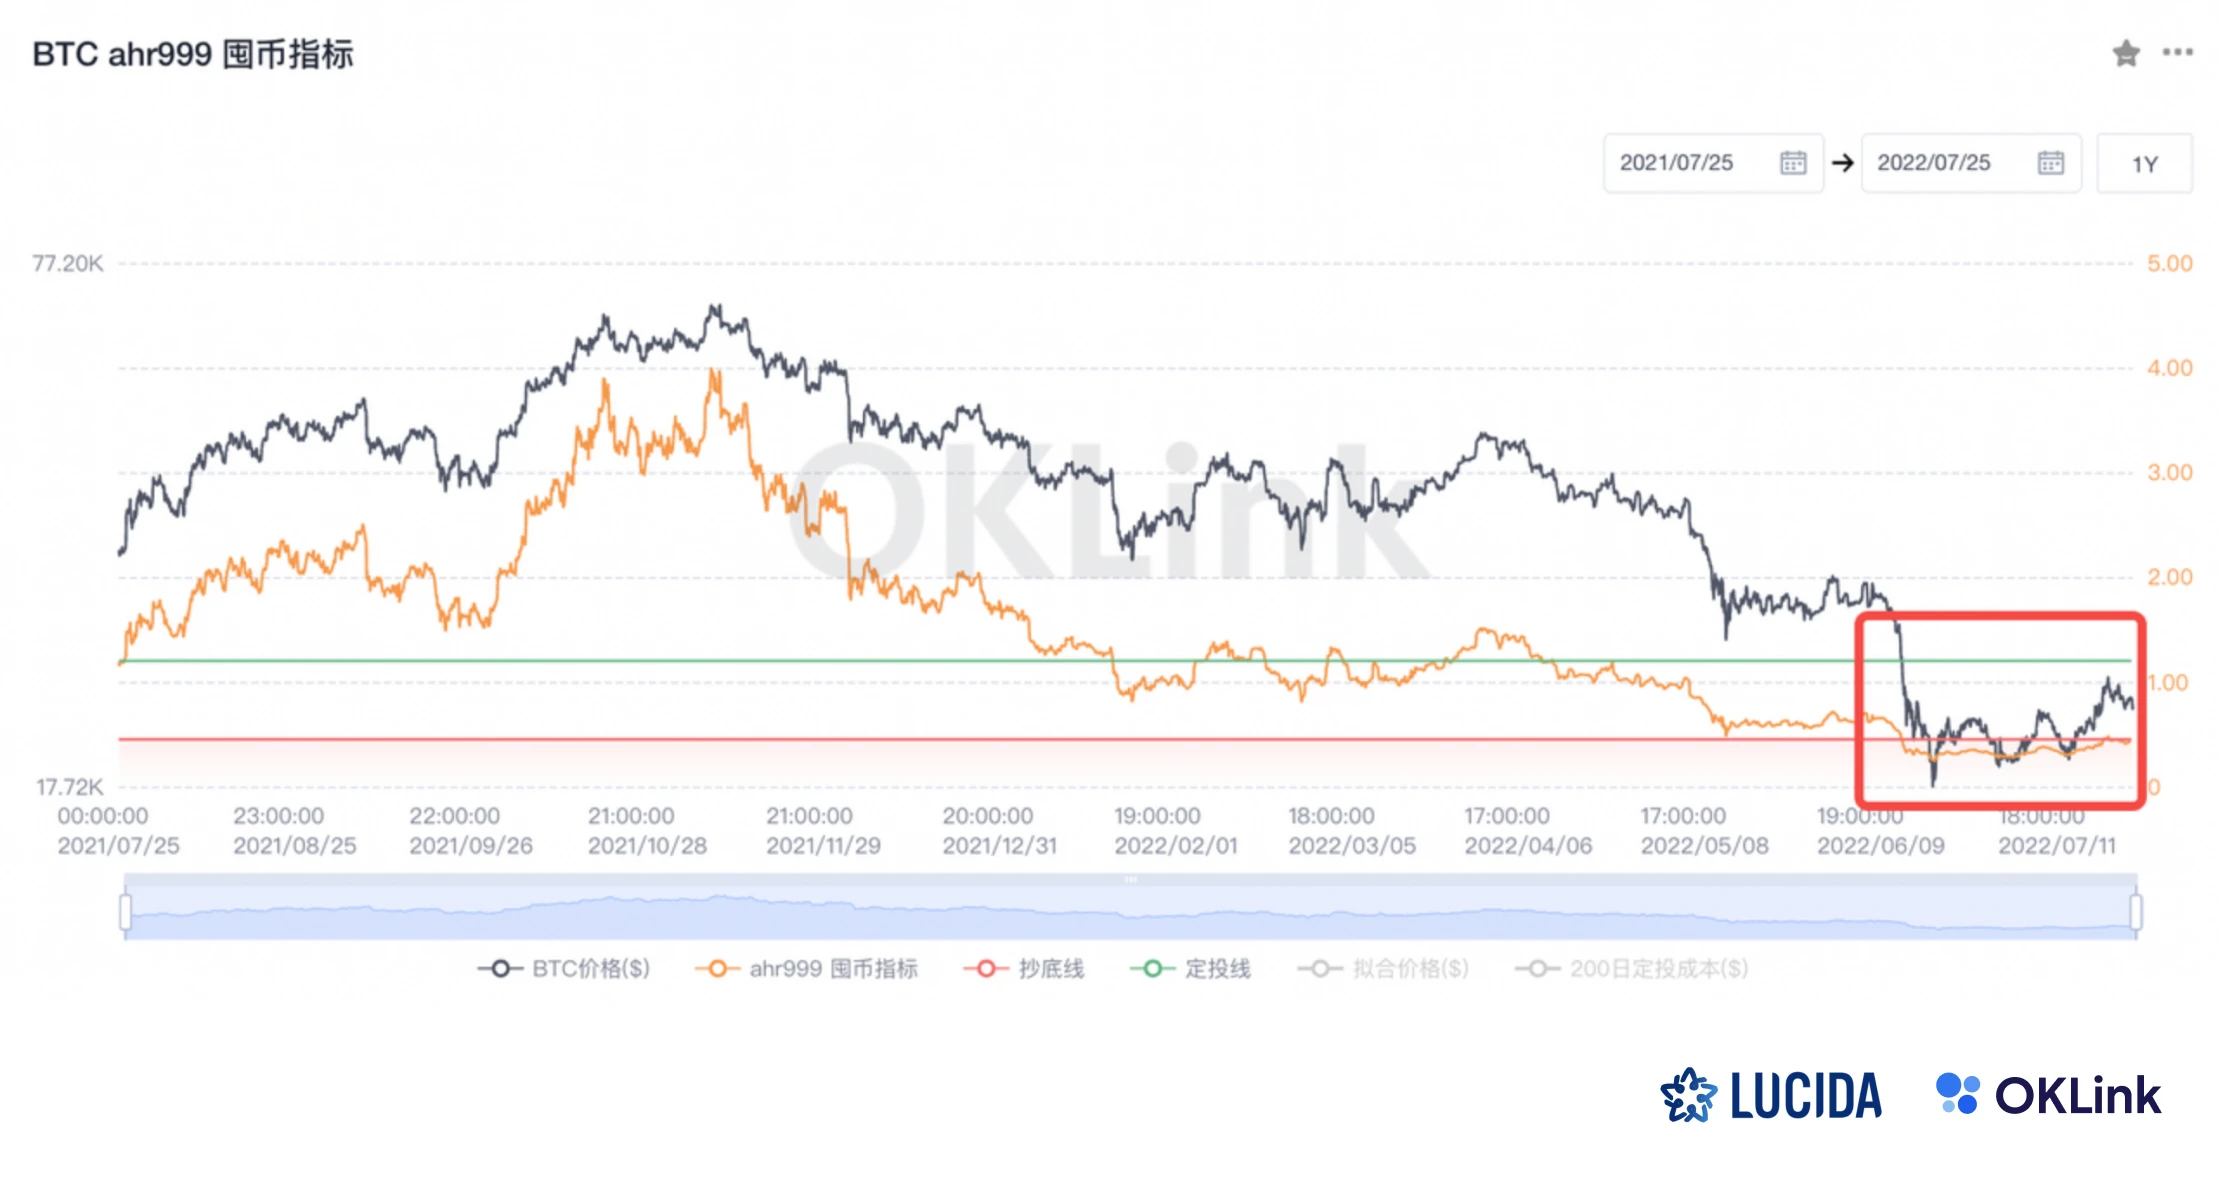
The hoarding indicator measures the relative price by comparing the current price with the 200-day scheduled investment cost and fitting price. The value represents the degree of price deviation, and the smaller the value, the lower the price, and vice versa.
2)MVRV Ratio
When the index is 0.45-1.2, it is suitable for regular investment; when it is lower than 0.45, it is suitable for bottom-hunting. As of writing, the regular betting line is $37,700, and the bottom line is $23,100.
image description
BTC ahr999 currency hoard indicator
The MVRV ratio (Market Value to Realized Value Ratio) is another indicator that is more accurate in predicting the bottom range. It mainly uses the realized market value of BTC (Realized Value) to assist in judging the degree of current price deviation.
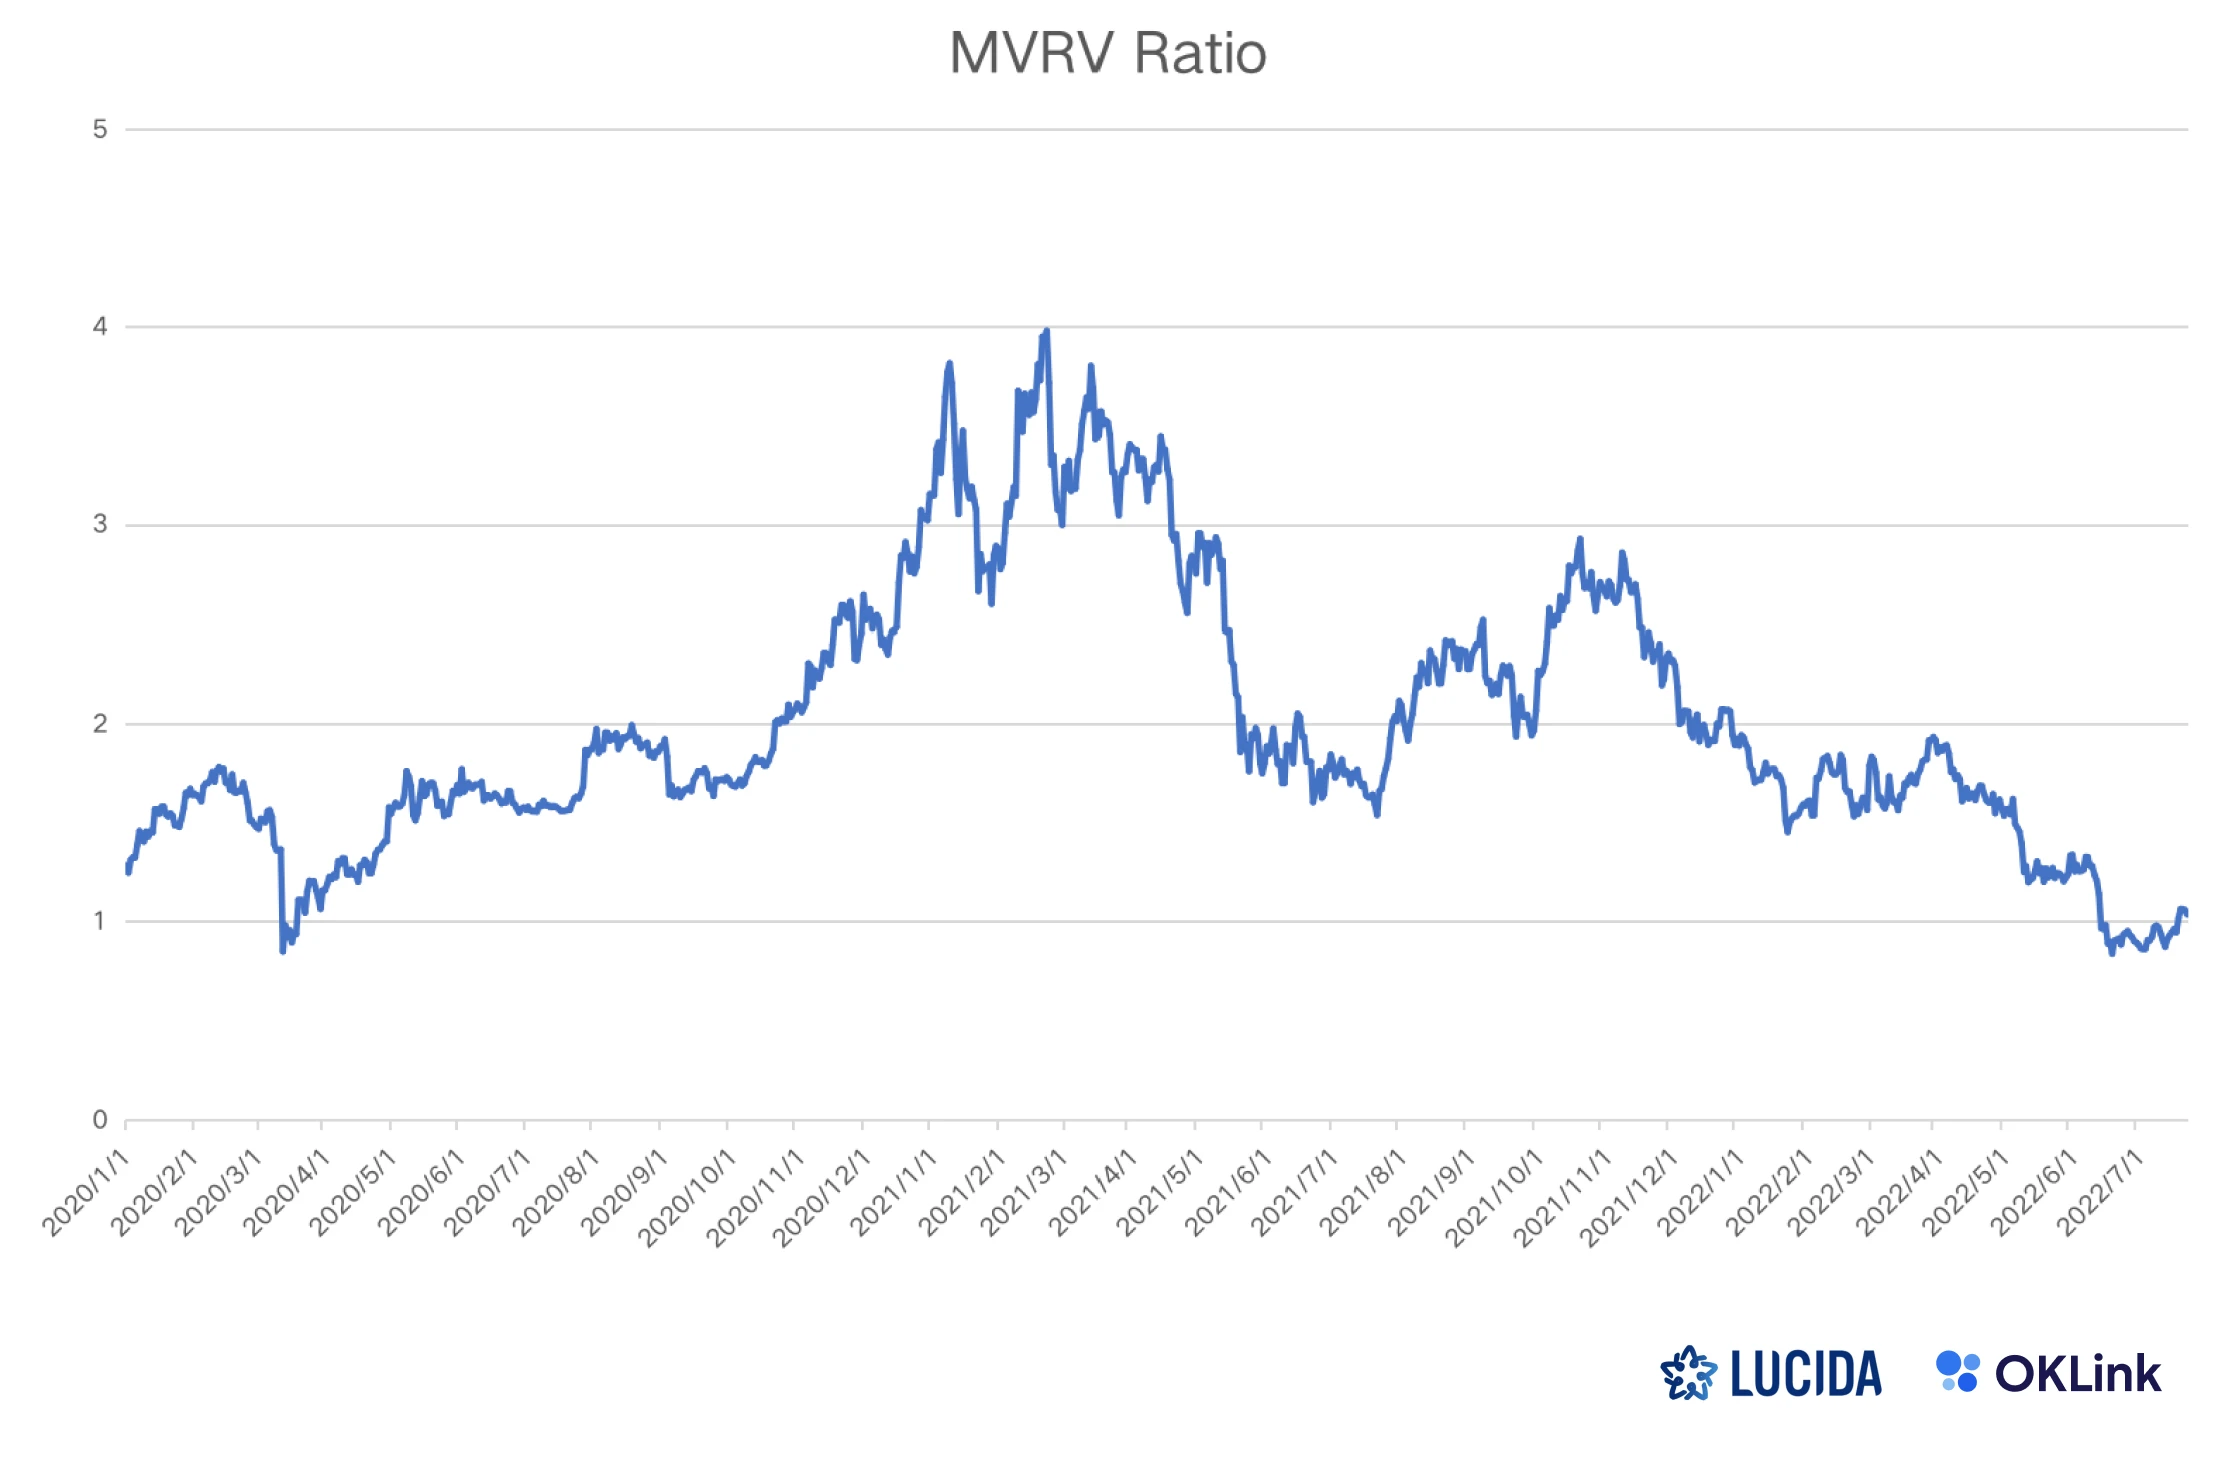
The realized market value is calculated by summarizing UTXOs and based on the market price of BTC when each UTXO last moved, which can approximately measure the long-term cost of all BTC holders in the market.
In the context of the continuous increase in market demand for BTC, usually RV will be lower than MV, so the ratio of MVRV indirectly reflects the degree of imbalance in the secondary market, which in turn can reflect the degree to which the market price is undervalued or overvalued. When MVRV is less than 1, it means the market is undervalued.
3) 200-week moving average
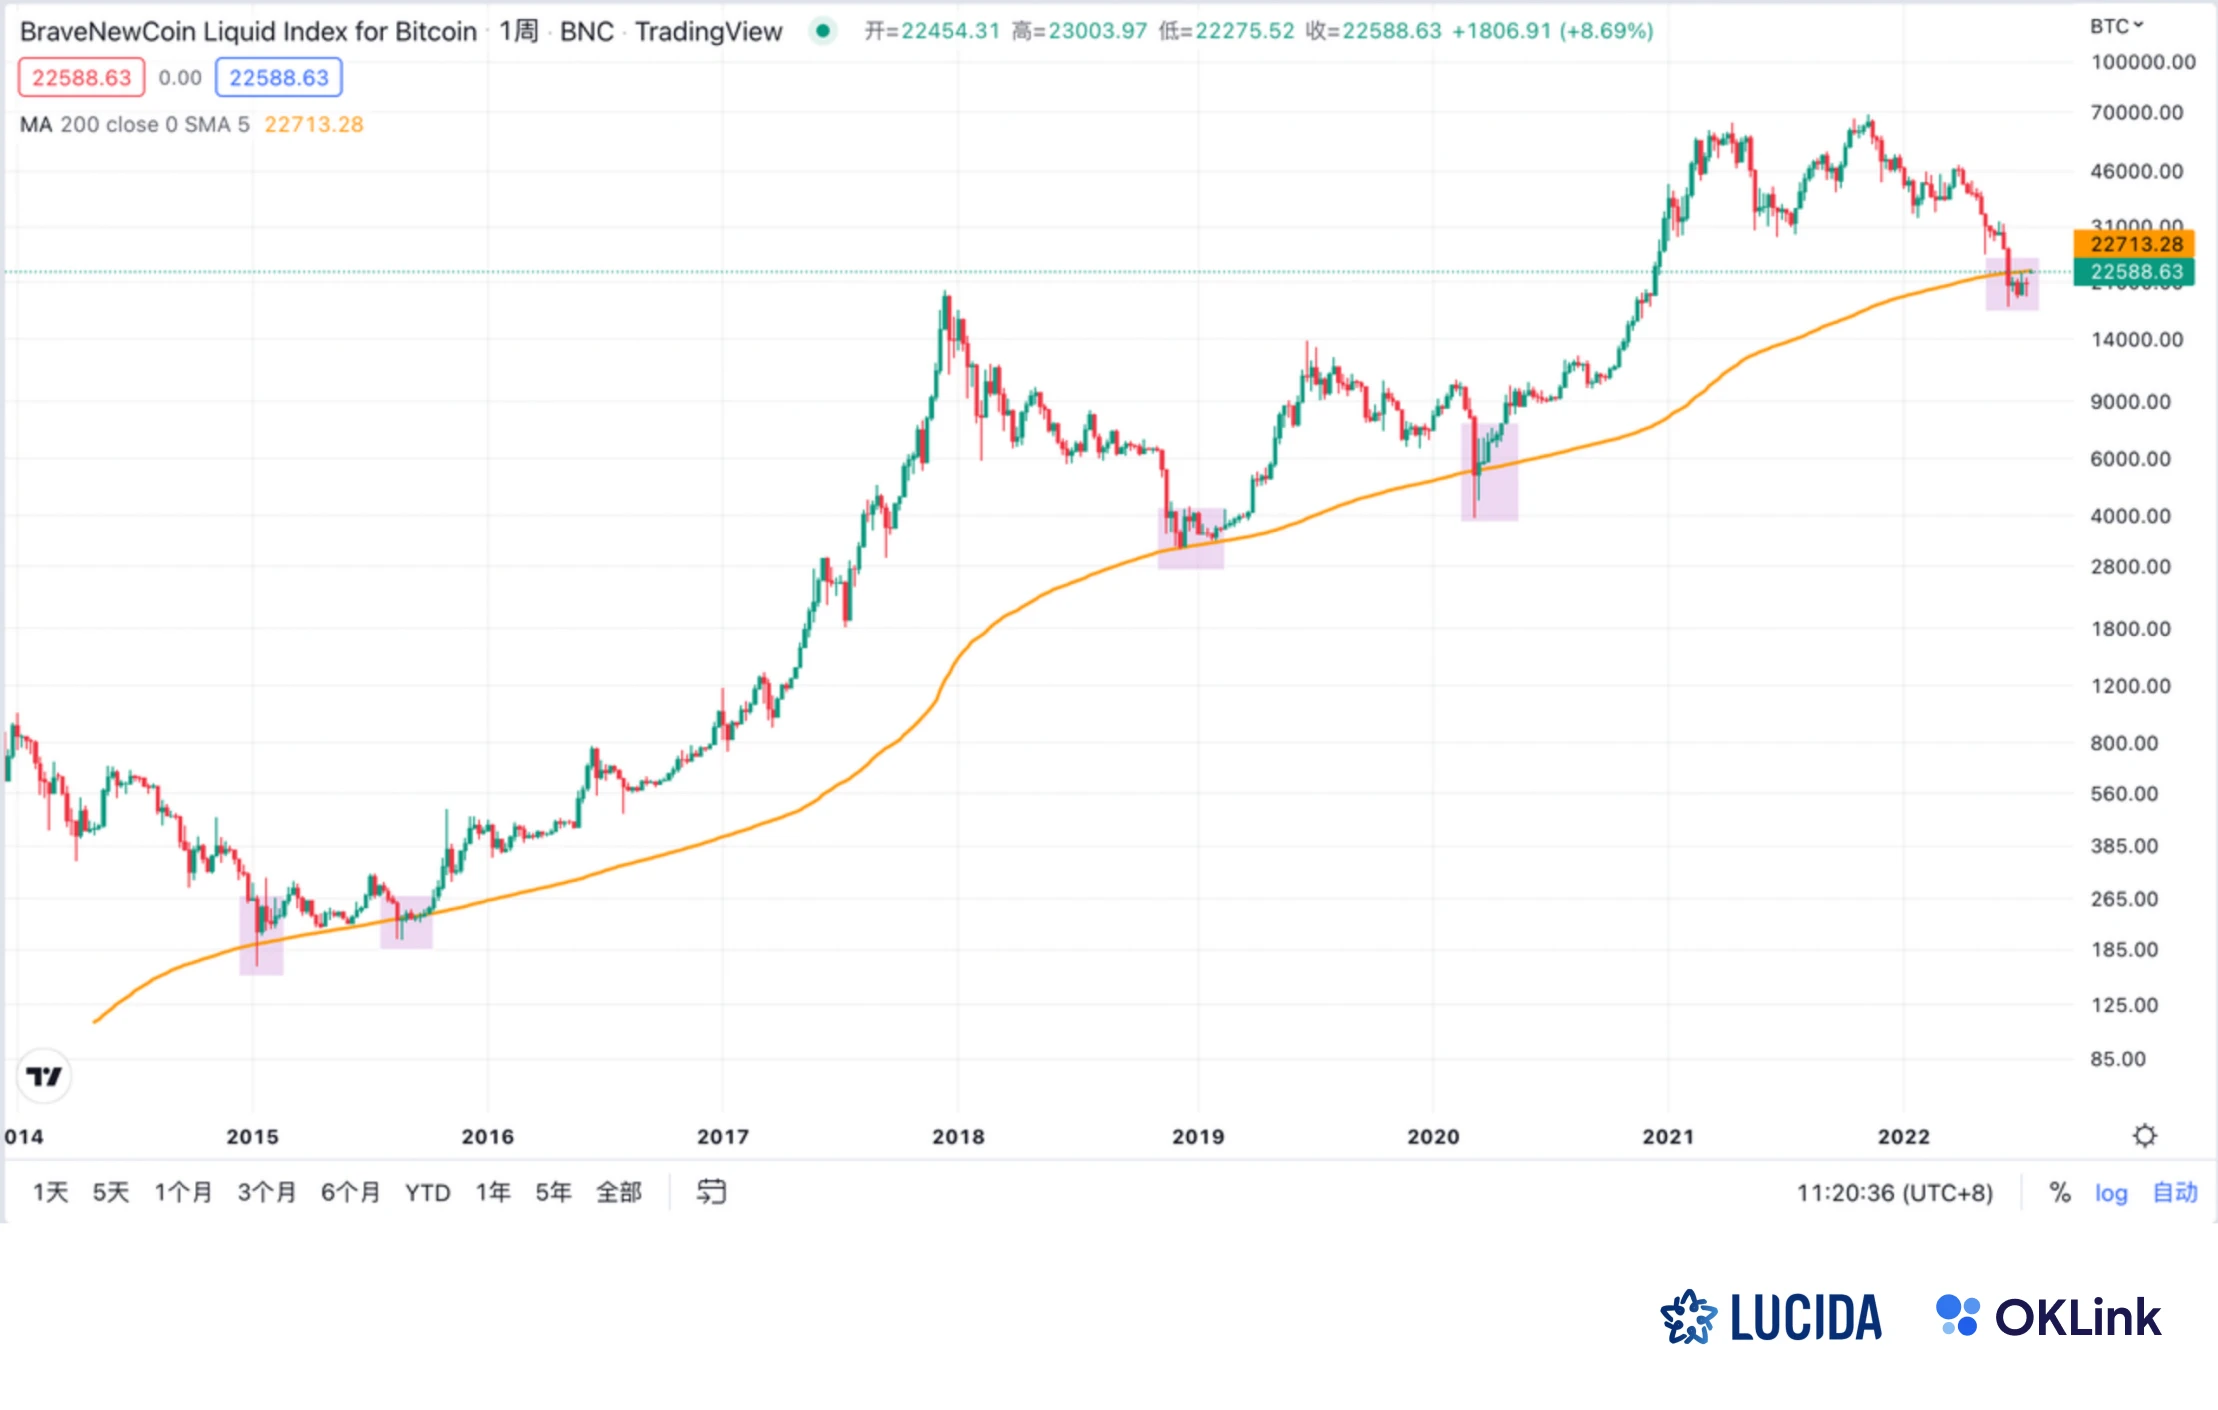
The 200-week moving average, that is, the 1400-day moving average, is generally considered to be the bottom of a dynamically changing BTC, because the bottoms of the previous bear markets happened to be around the 200-week moving average.
Since its birth, BTC has touched the 200-week moving average five times, namely 2015.01.14-2015.01.18, 2015.08.18-2015.10.05, 2018.12.14-2018.12.16, 2020.03.12-2020.03.19, 2022.06 .13-2022.07.24, some rebounded after touching, and some lingered for 1-2 months, but never effectively fell below.
image description
BTC 200-week moving average, Tradingview data
Looking back from the perspective of God, the points that touched the 200-week moving average these few times are almost the best buying points in history. Currently, the 200-week moving average, or the 1,400-day moving average, is at $22,705.
4) The number of currency-holding addresses reveals the class position
According to the BTC balance held by different addresses, we simply divide the holders into:
• Retail investors (0.001-0.1 BTC)
• Middle class (100-1k BTC)
• Giant Whale (1k-10k BTC)
Since users with different net worth have different influences on the market and different degrees of expertise, they have different information and sensitivity to the cycle, which in turn has different reference significance for us to predict bull and bear.
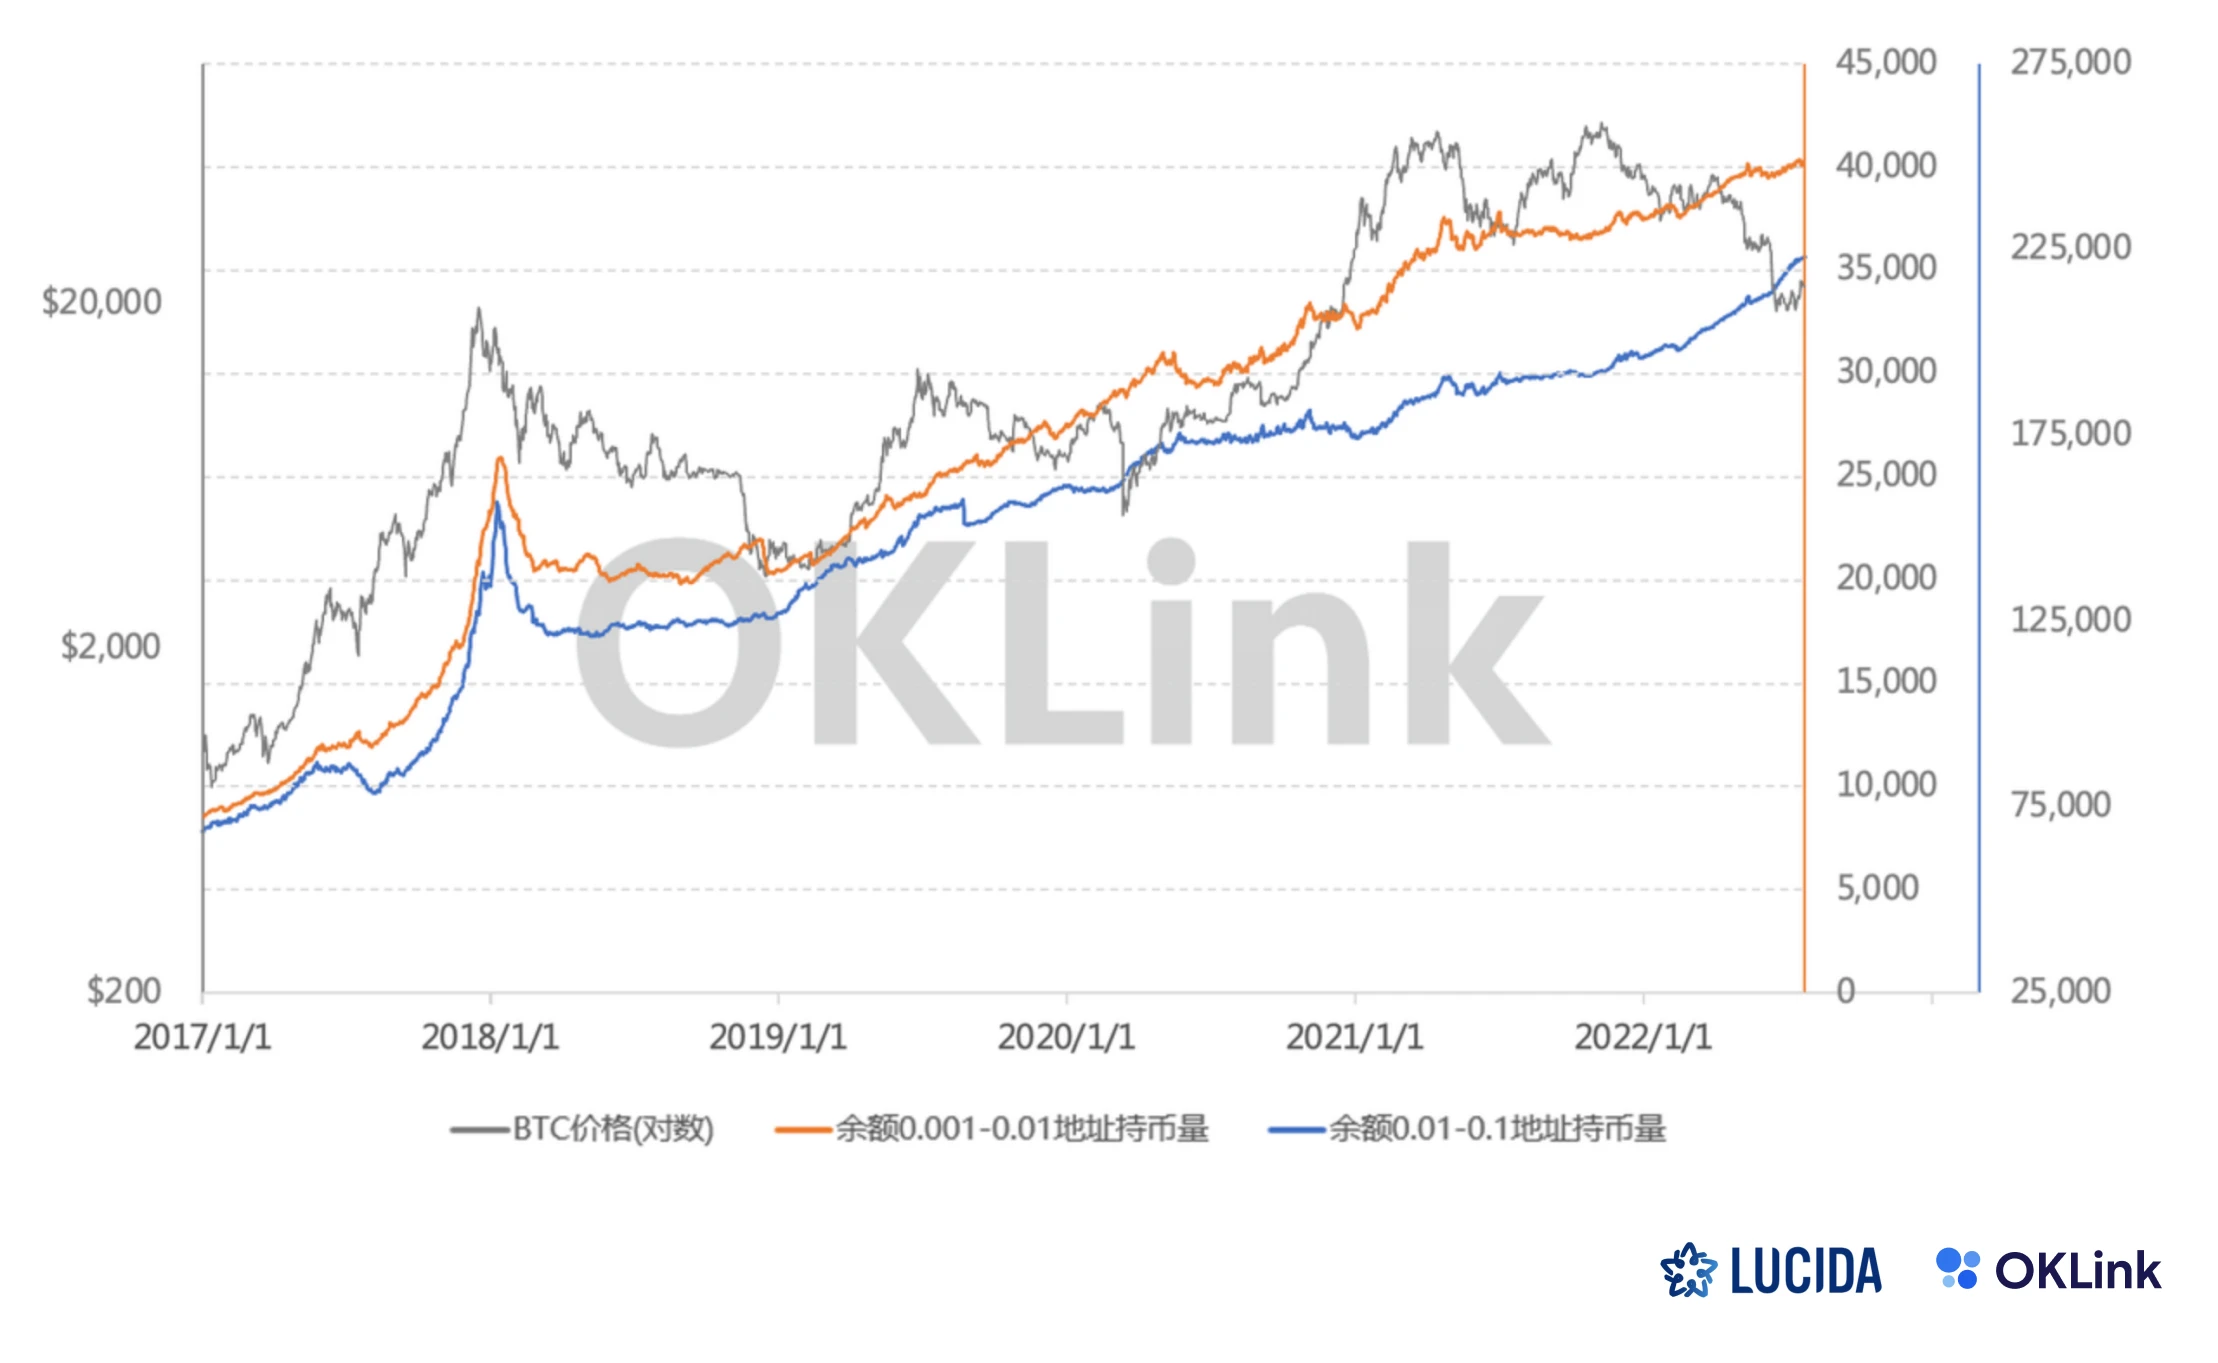
(1) retail investors
The fluctuation of the number of coins held by retail investors basically follows the law of the currency price, and the reduction of holdings lags behind the decline of the currency price, which is of little reference value.
image description
(2) middle class
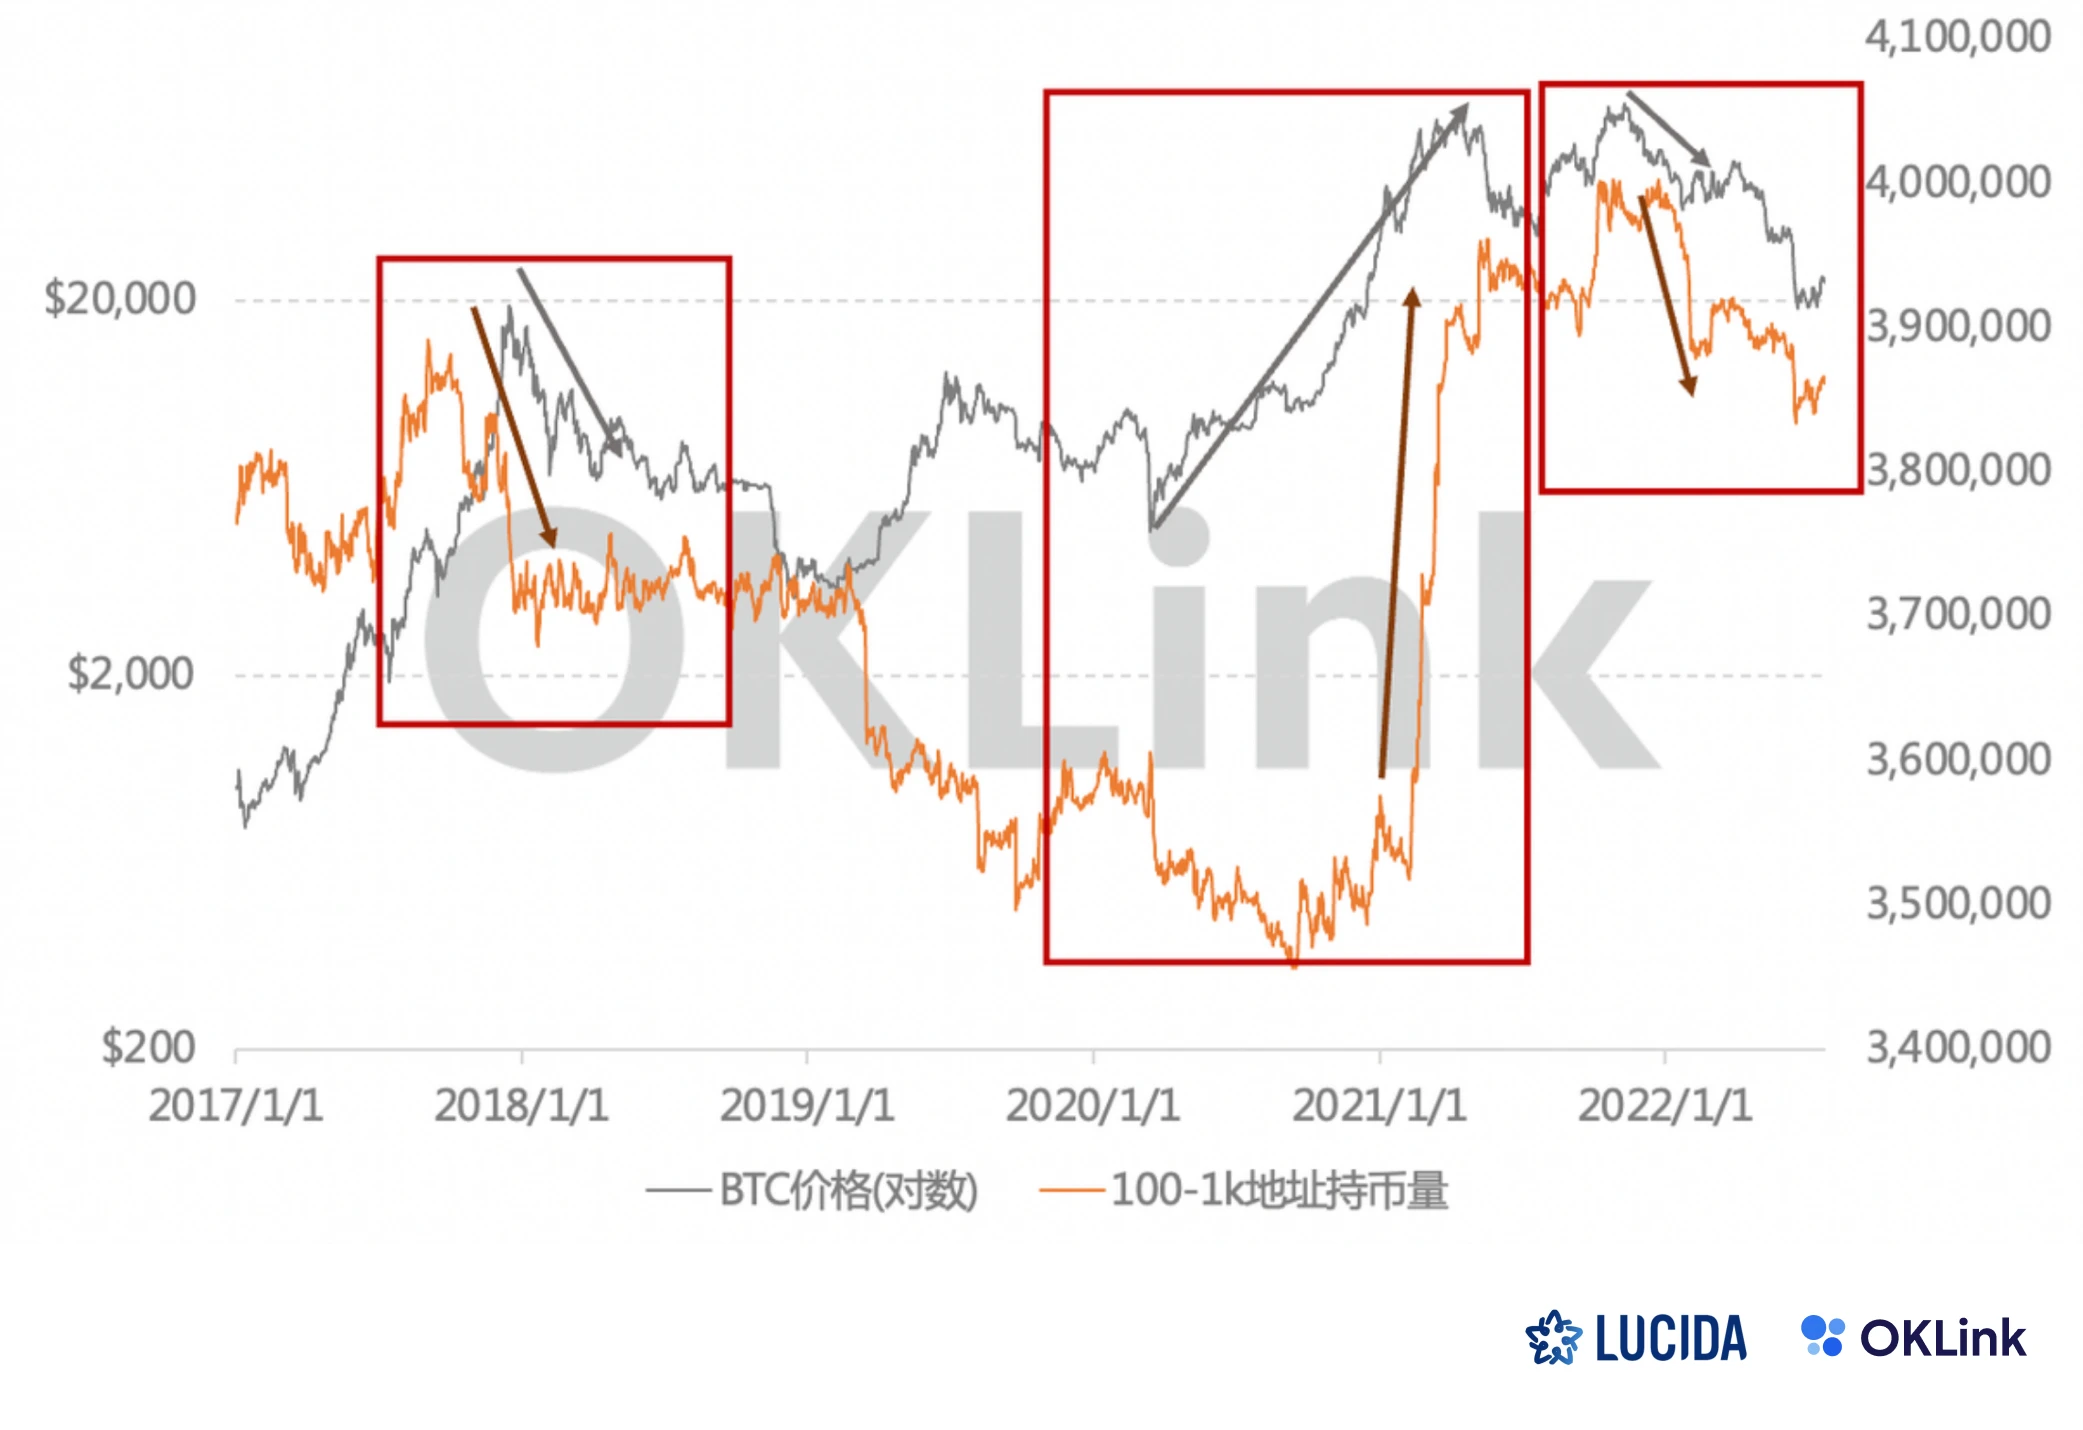
In the bull-bear cycle before and after the BTC price peaked in 2018, we can see that the addresses belonging to the middle class, that is, holding 100-10k BTC (dark brown arrow) began to reduce their holdings before the peak of the bull market (dark gray arrow) . But at the bottom of the bear market, the middle class continued to reduce their holdings, which deviated from the trend of BTC, which shows that there is no consensus on the bottom of the market.
After the start of the bull market in 2020, the middle class is also relatively behindsight. After the BTC price peaked at the end of 2021, there is no leading judgment on the later stage of the market, and it is basically at the same frequency as the market. Generally speaking, the middle class as a whole has a slightly stronger judgment on the cycle than retail investors, but the reference value for the judgment of the bull-bear cycle is not very significant.
image description
(3) giant whale
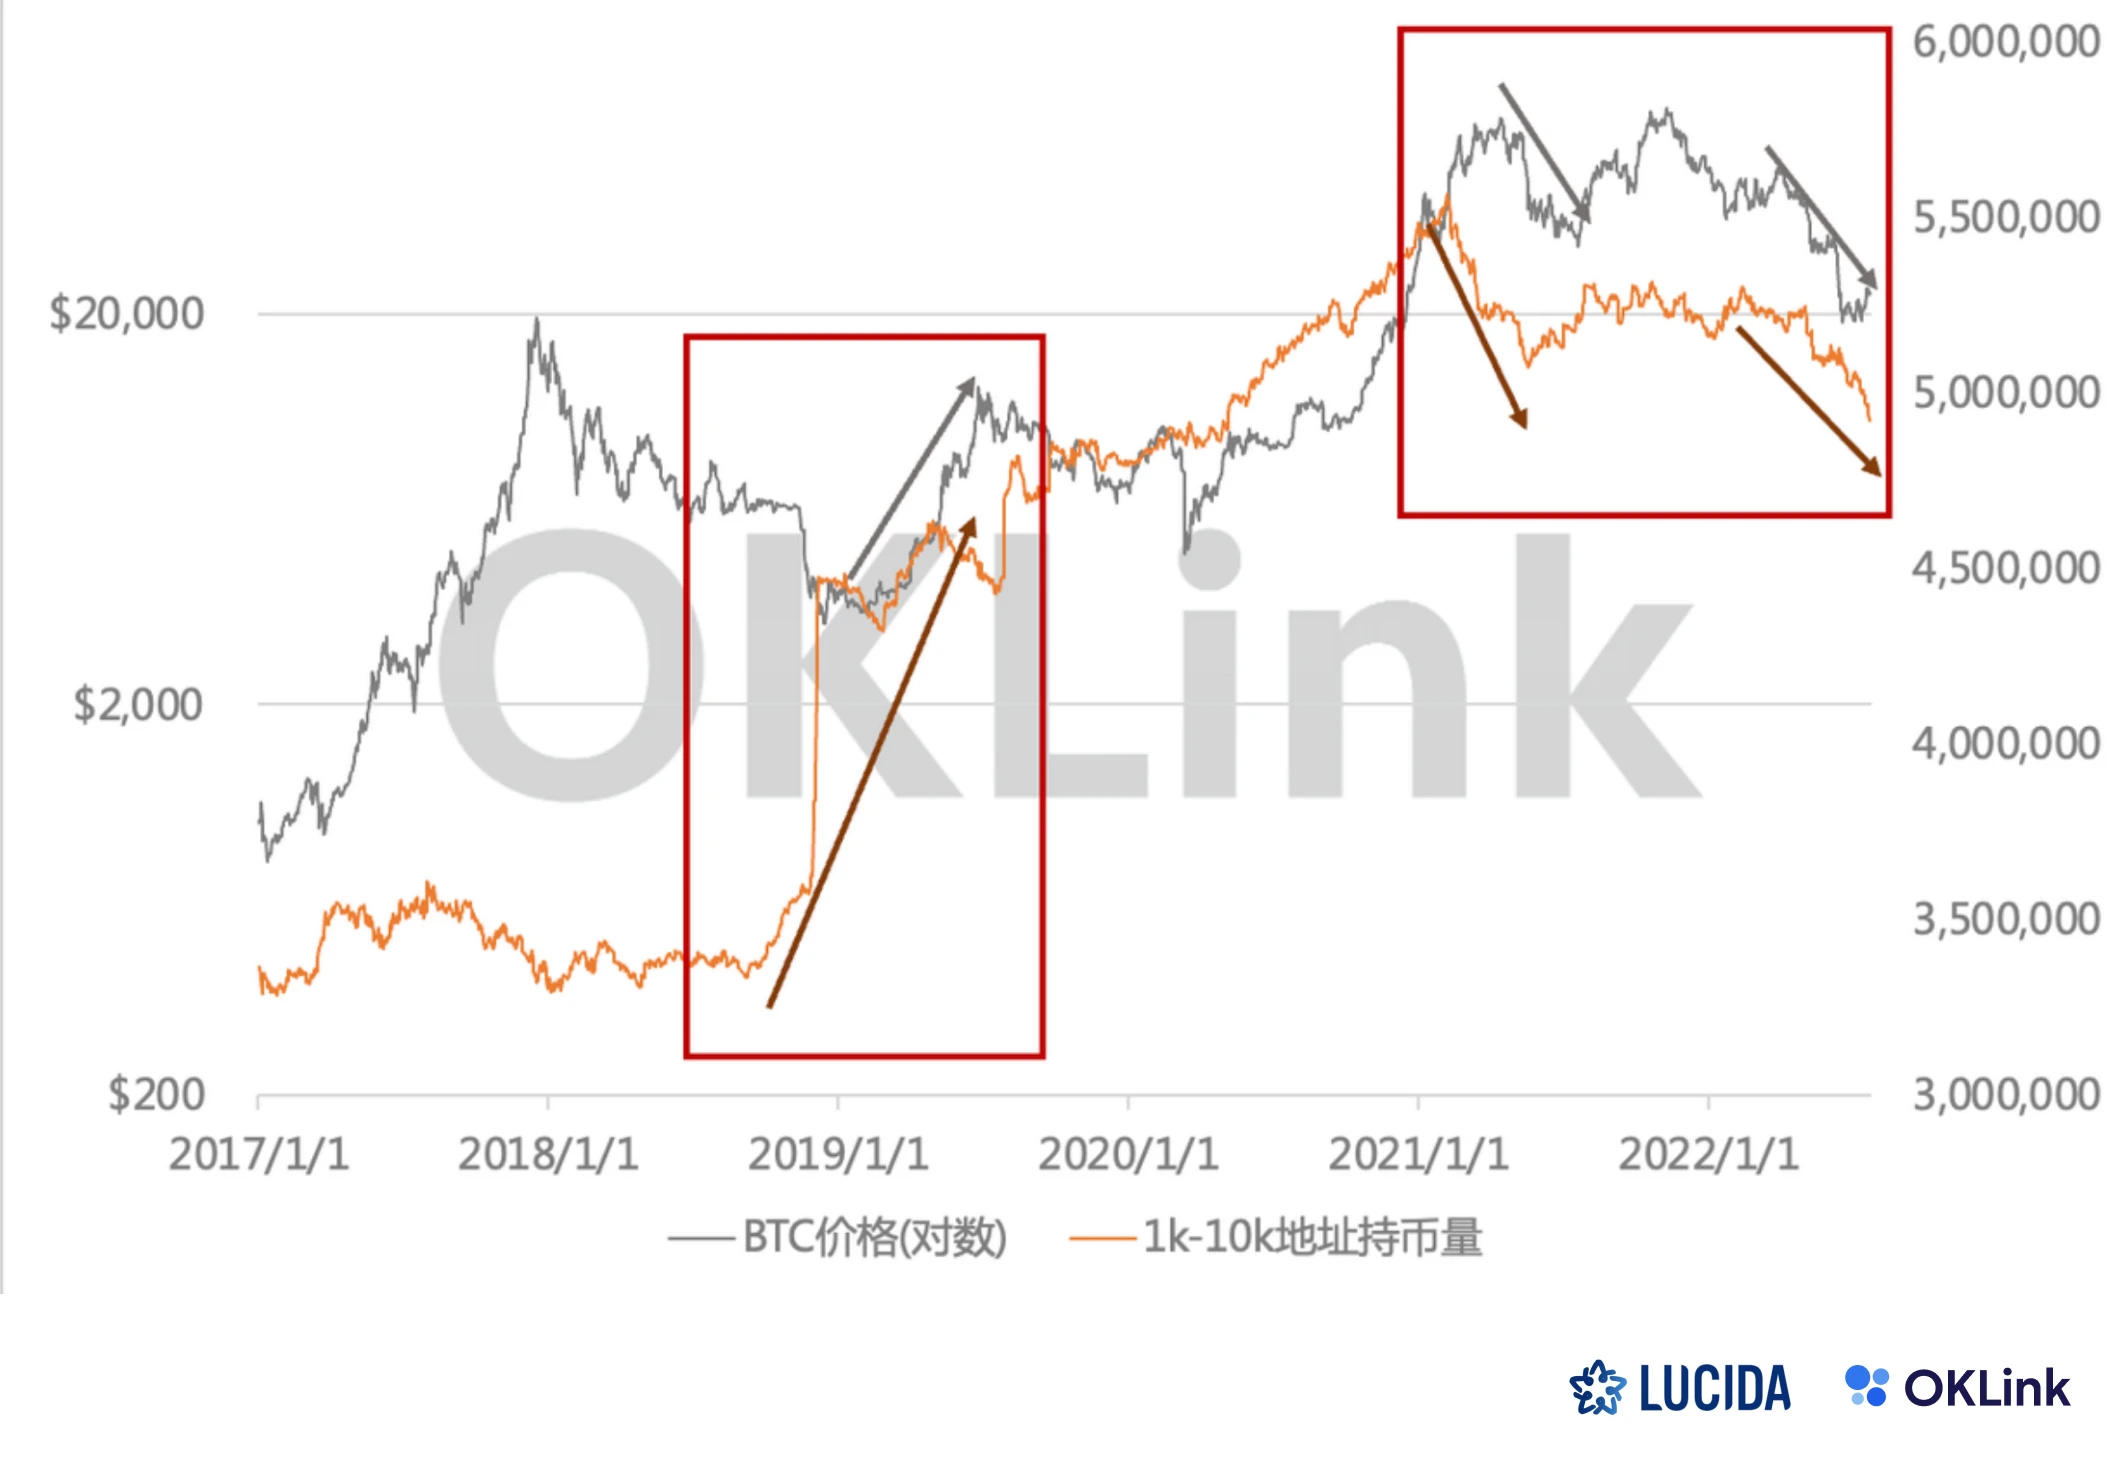
Addresses with larger balances mean lower appetite for risk, and the time to reduce holdings will be earlier, which means that in 2017, 2021 and 2022, we can see giant whales reduce their positions earlier than the middle class.
During the bottom of the bear market in 2018, when other users continued to sell, the giant whales continued to accumulate funds. In February 21, they began to reduce their holdings. Before 5.19, coincidentally the giant whales had another wave of reductions. After BTC hit a new high, the giant whales The overall is in a state of underweight. It can be seen that the giant whales judgment on the bottom is very firm and consistent, and the top shipment is very smart, which belongs to the Smart Money of this cycle.
1k-10k BTC address holdings vs BTC price
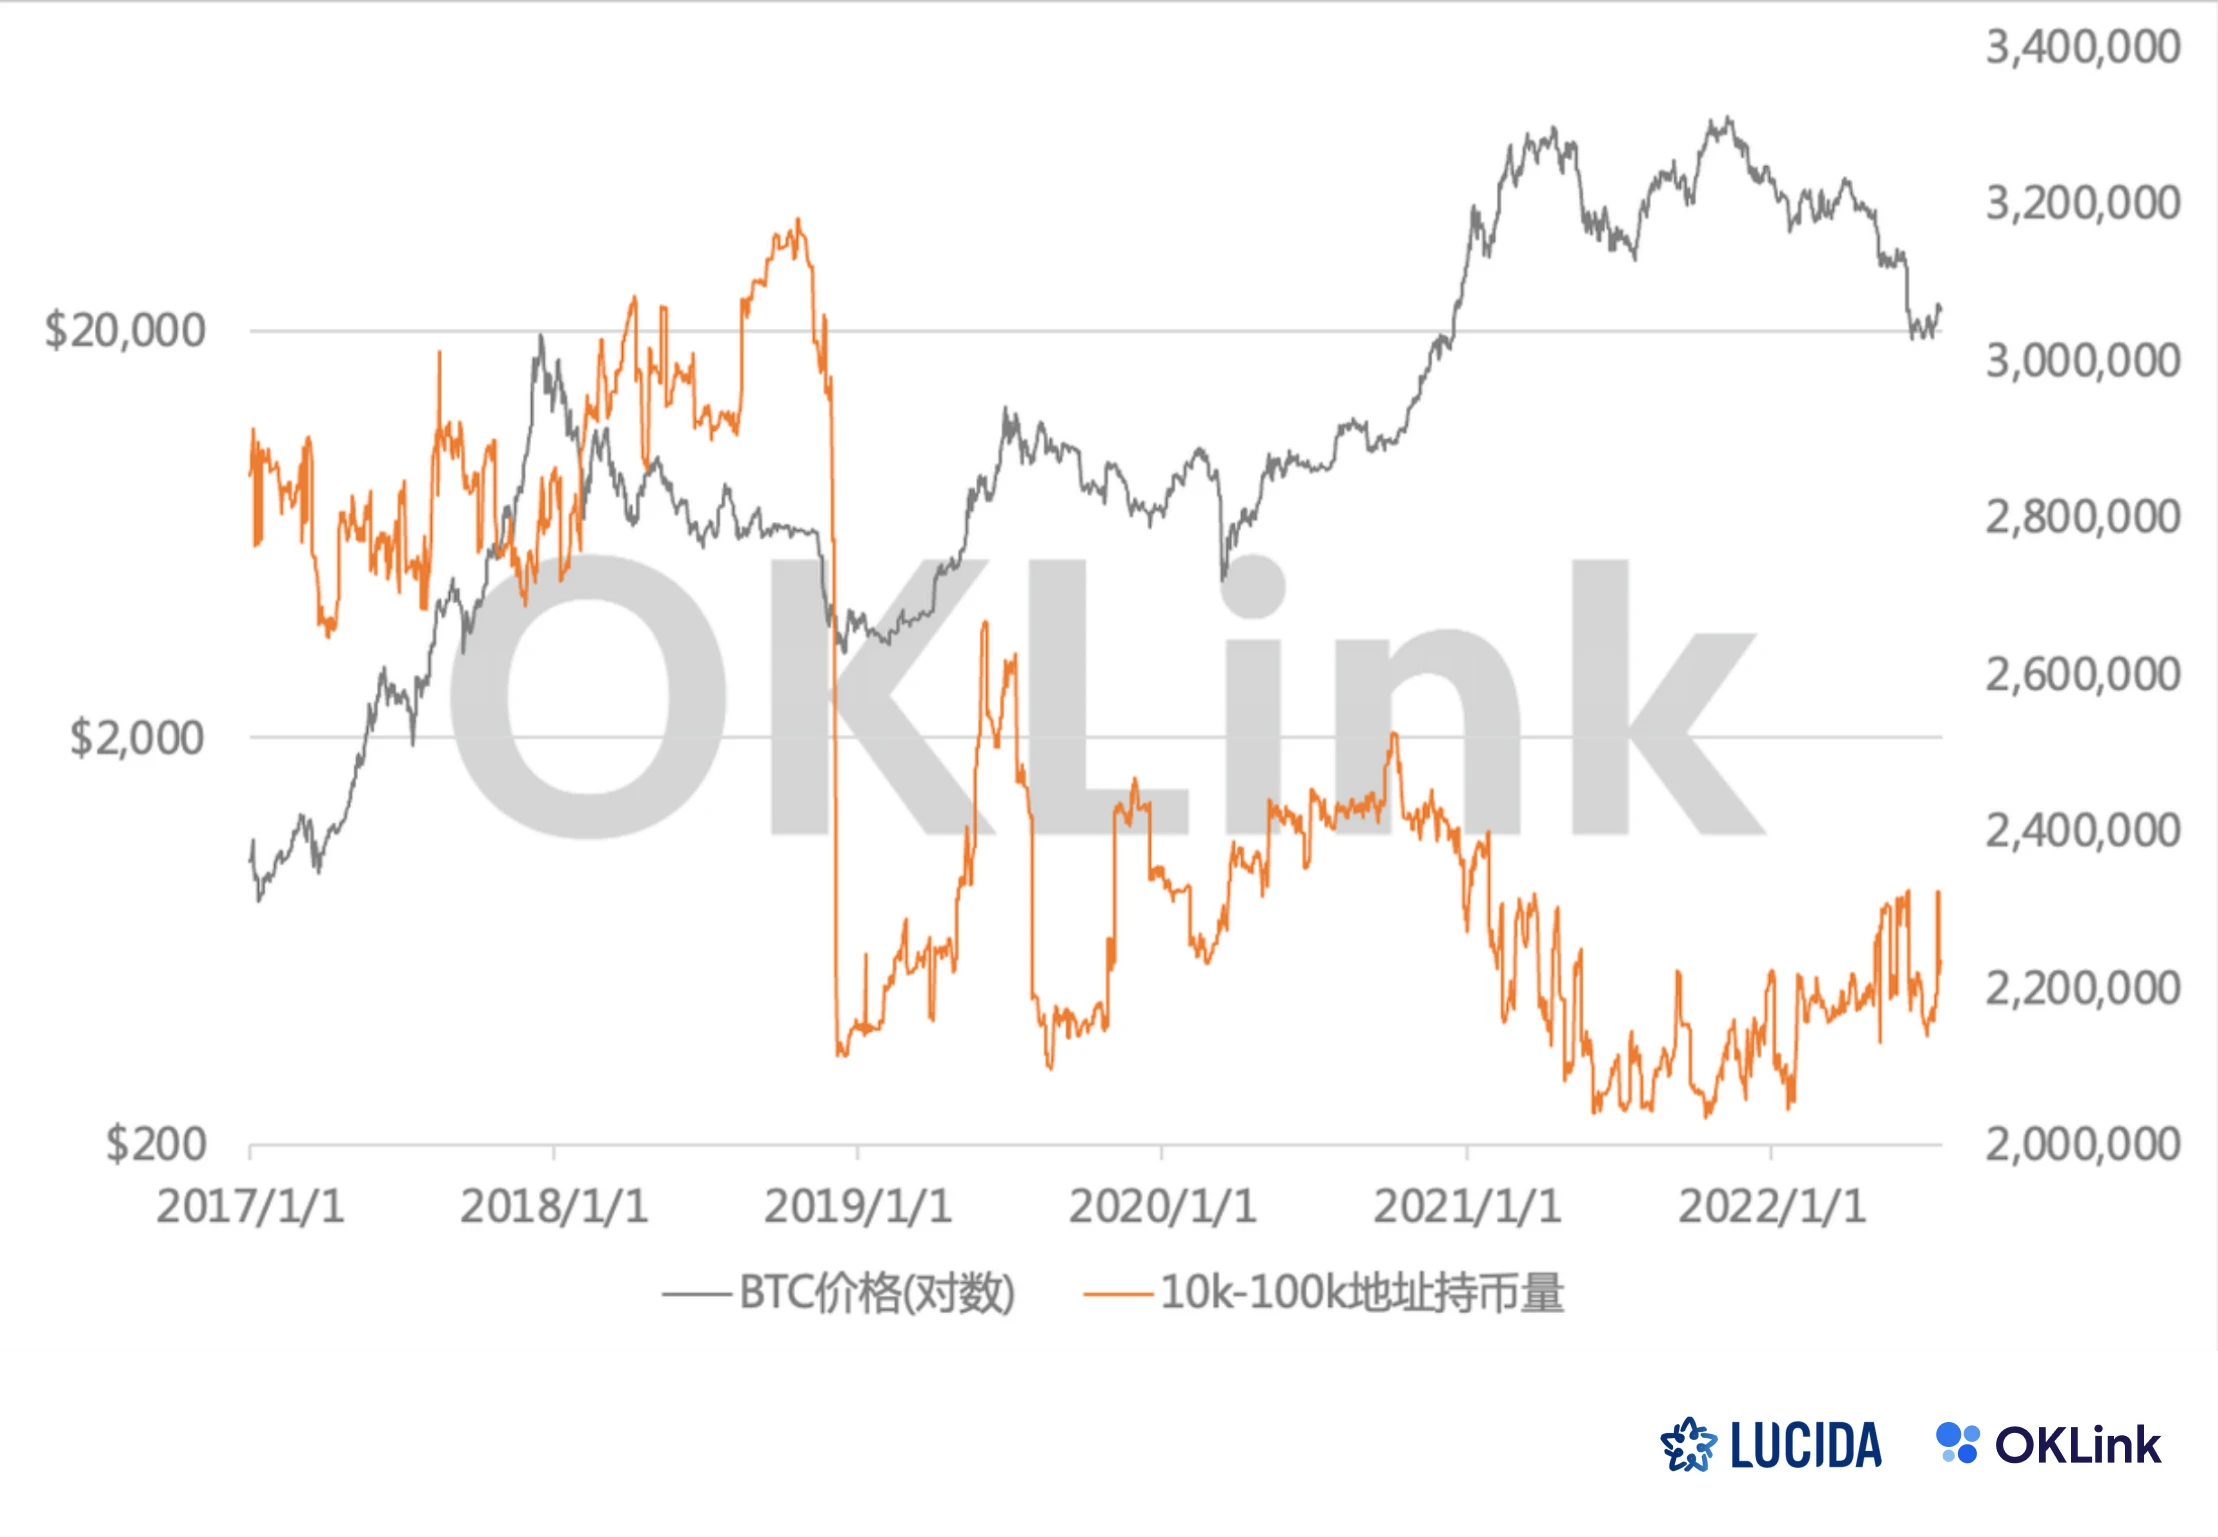
(4) Super Giant Whale
image description
10k-100k BTC address holdings vs BTC price
It can be seen that in the rising cycle of 2020-2021, the giant whales holding 1k-10k BTC are the backbone of this round of rising, and they have the ability to predict the top in advance, and those who hold 100-1k BTC The middle class will take over in the mid-term, and retail investors will contribute the final strength to the top. **To sum up, the 1k-10kBTC giant whale is more sensitive to the bull-bear cycle, and has obvious cycle prediction value.
first level title
Next, lets look at the on-chain data of the stablecoin track.
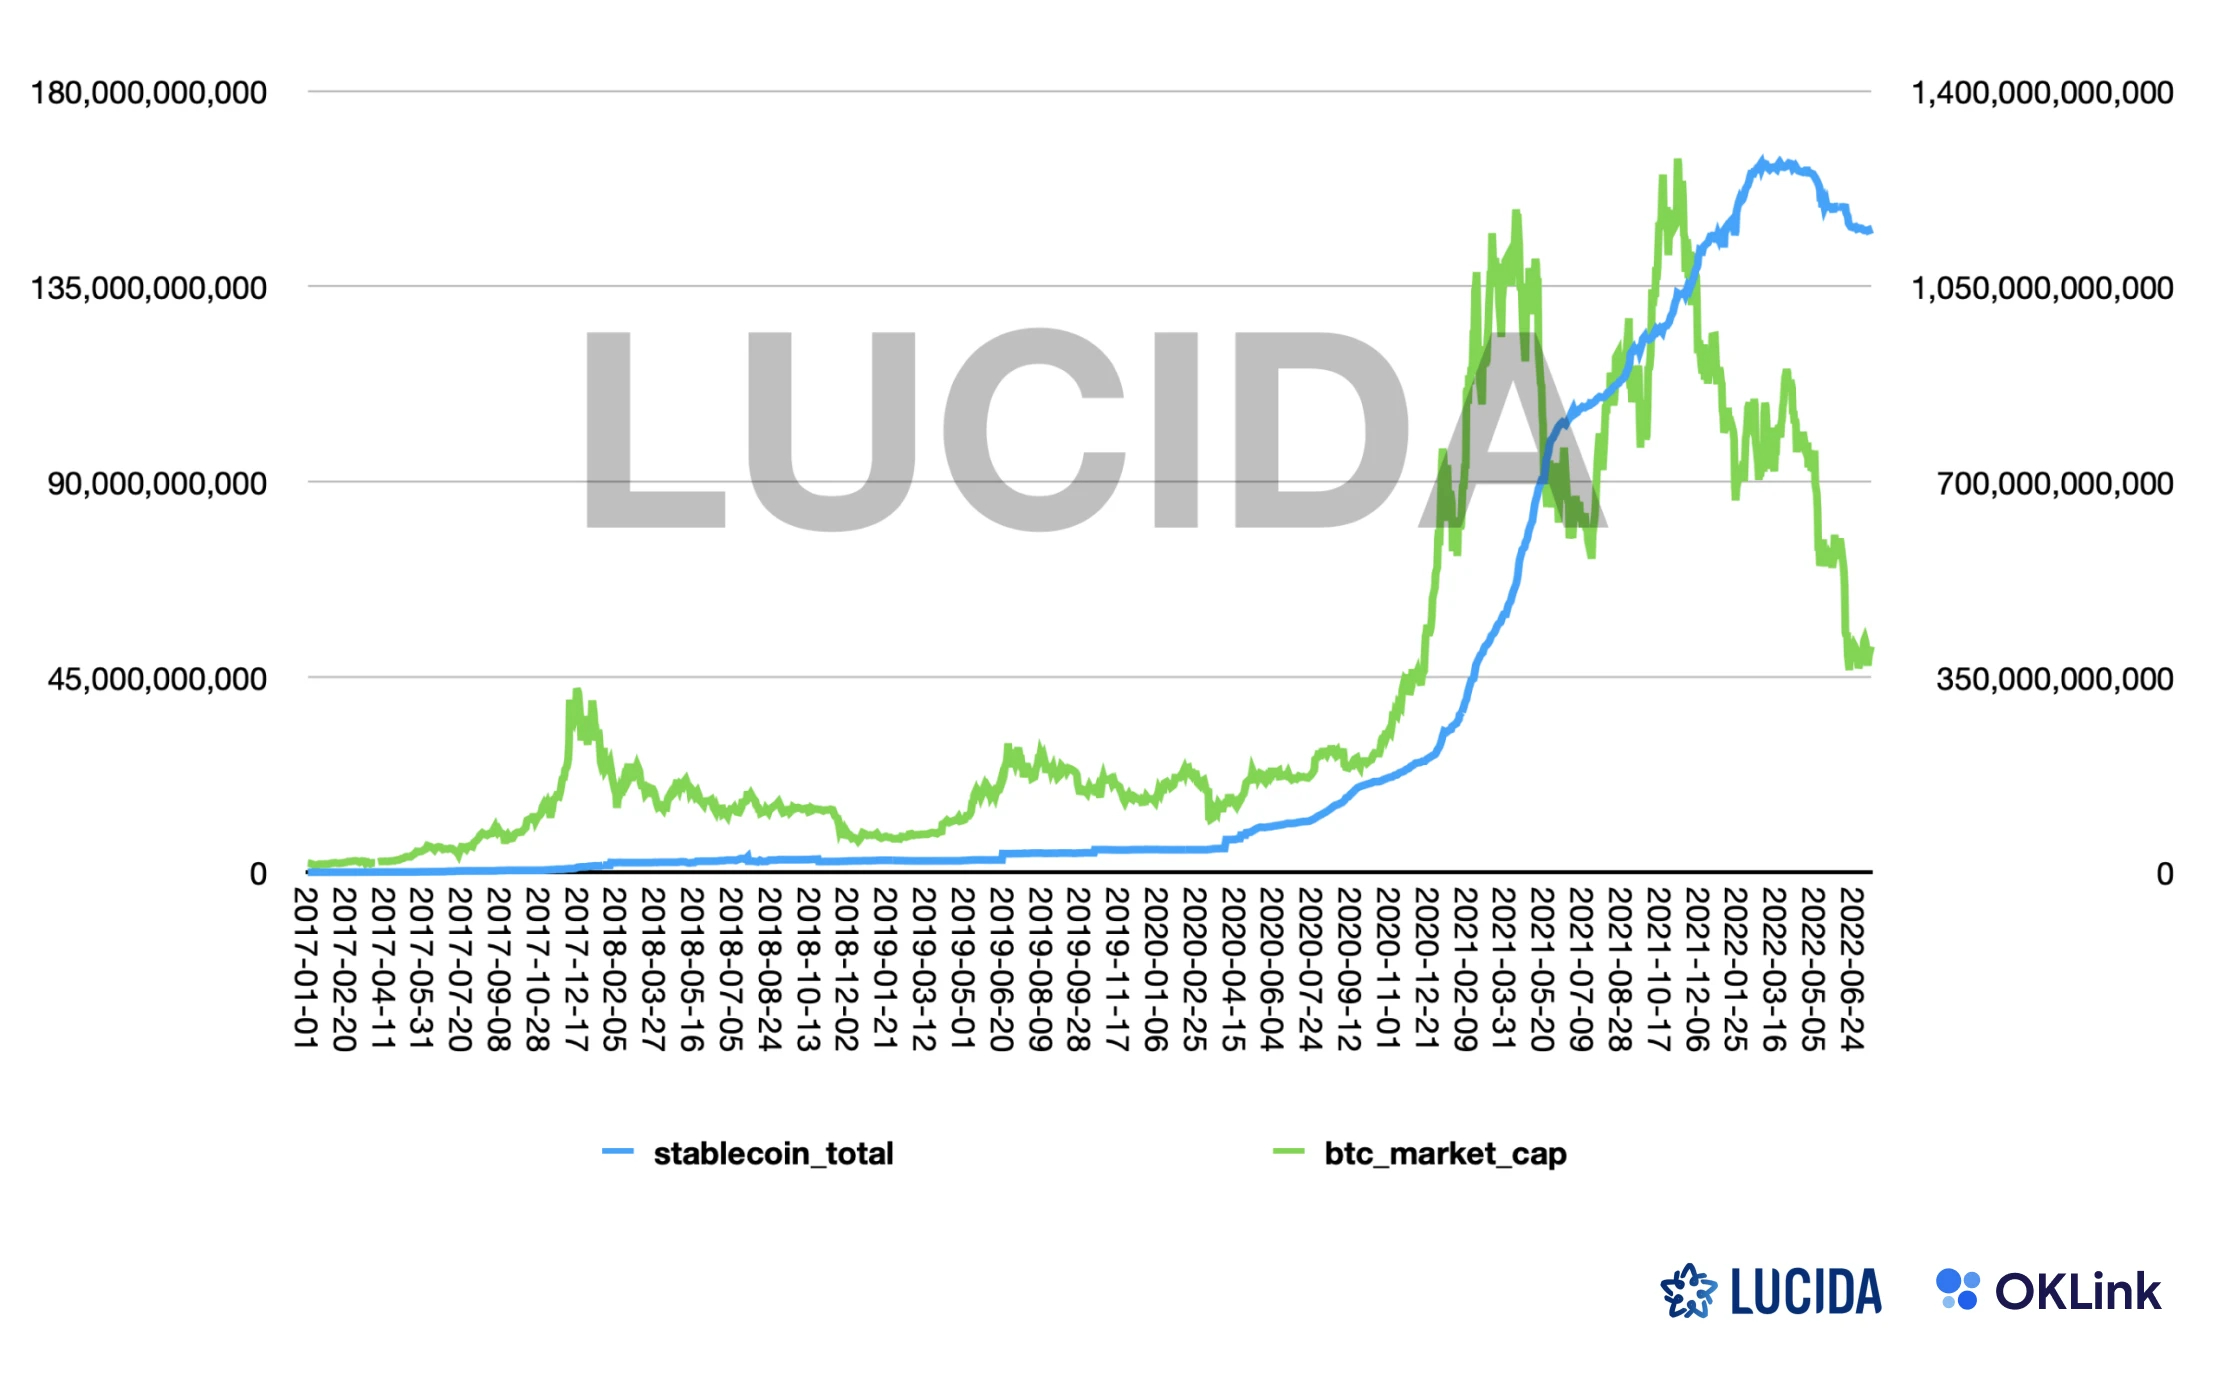
Stablecoins are a bridge linking the encrypted world with the outside world. We can judge whether the market is in an incremental/stock/shrinking state by observing the overall situation of the stablecoin track.
The blue line in the figure is the issuance curve of mainstream stablecoins denominated in US dollars, including USDT, USDC, BUSD, DAI, TUSD, and USDP. The market value of these 6 stablecoins accounts for more than 99% of the overall stablecoin track, so It can be roughly understood as the overall performance of the stablecoin track.
image description
We found that this round of bull market is accompanied by a large number of additional issuance of stable coins, indicating that a large amount of funds from the external market have poured into the encryption market, bringing the market into a state of incremental market.
In November 2021, shortly after BTC peaked at $69,000, stablecoins also stopped issuance and began to be redeemed slowly.
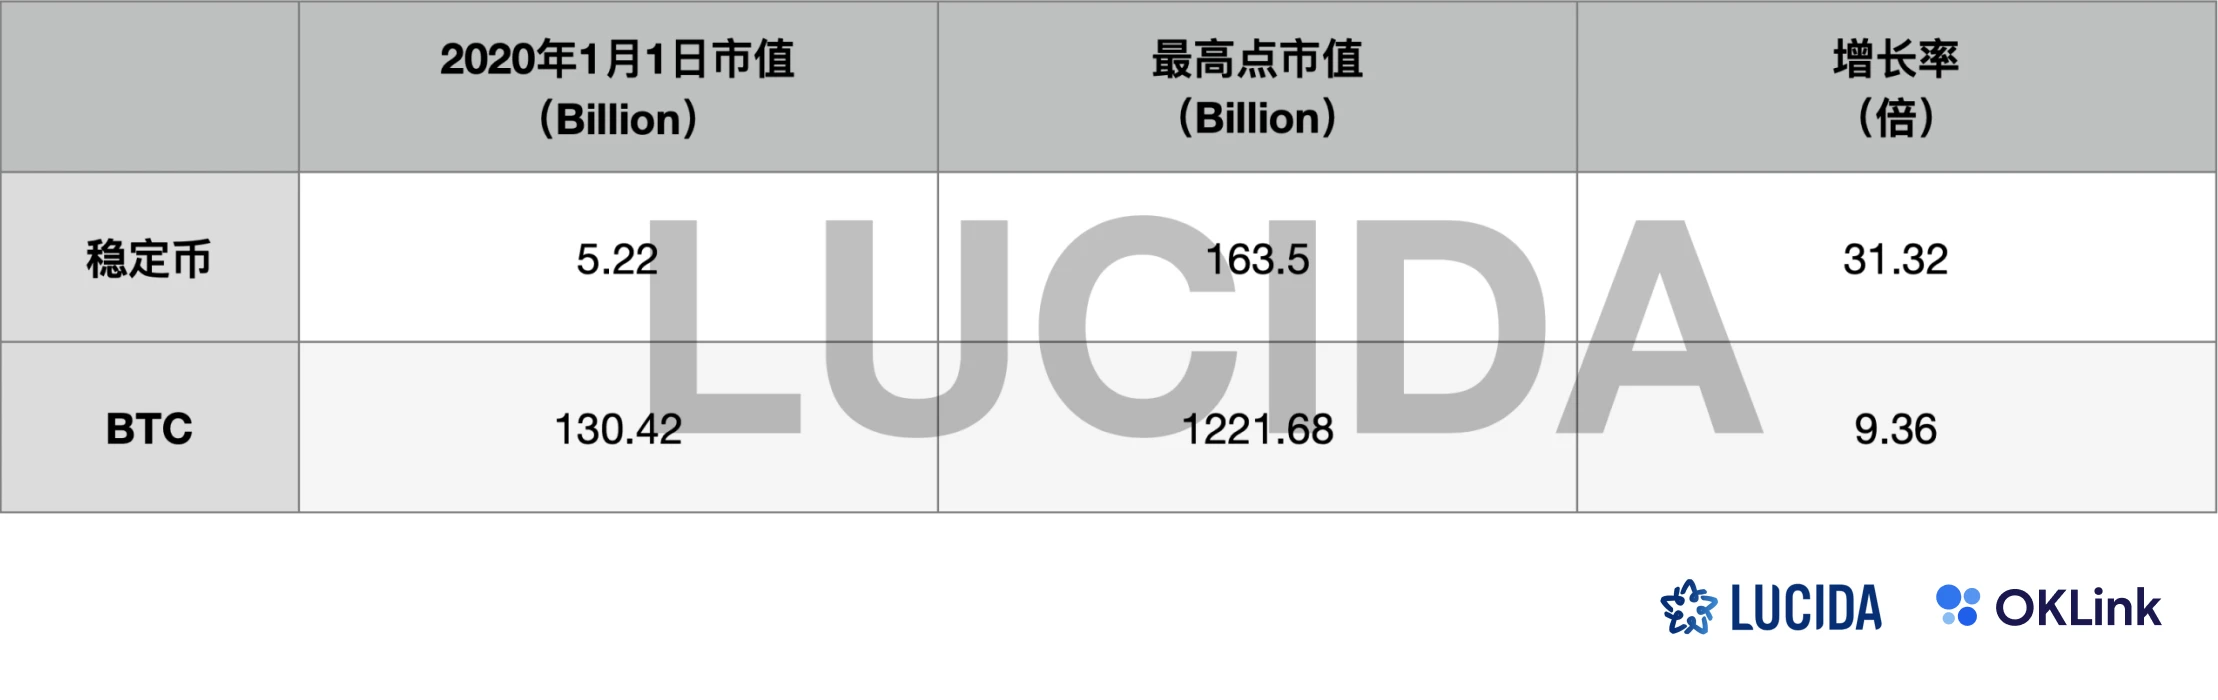
The total circulation of stablecoins increased from USD 5.2B on January 1, 2020 to a peak of USD 163.5B on March 20, 2022, an increase of 31.3 times. The total market capitalization of BTC increased from USD 130.4B on January 1, 2020 to a peak of USD 1,221.7B on November 10, 2021, a growth rate of 9.4 times.
secondary title
Predict market bulls and bears with Stablecoin Growth Rate Factor
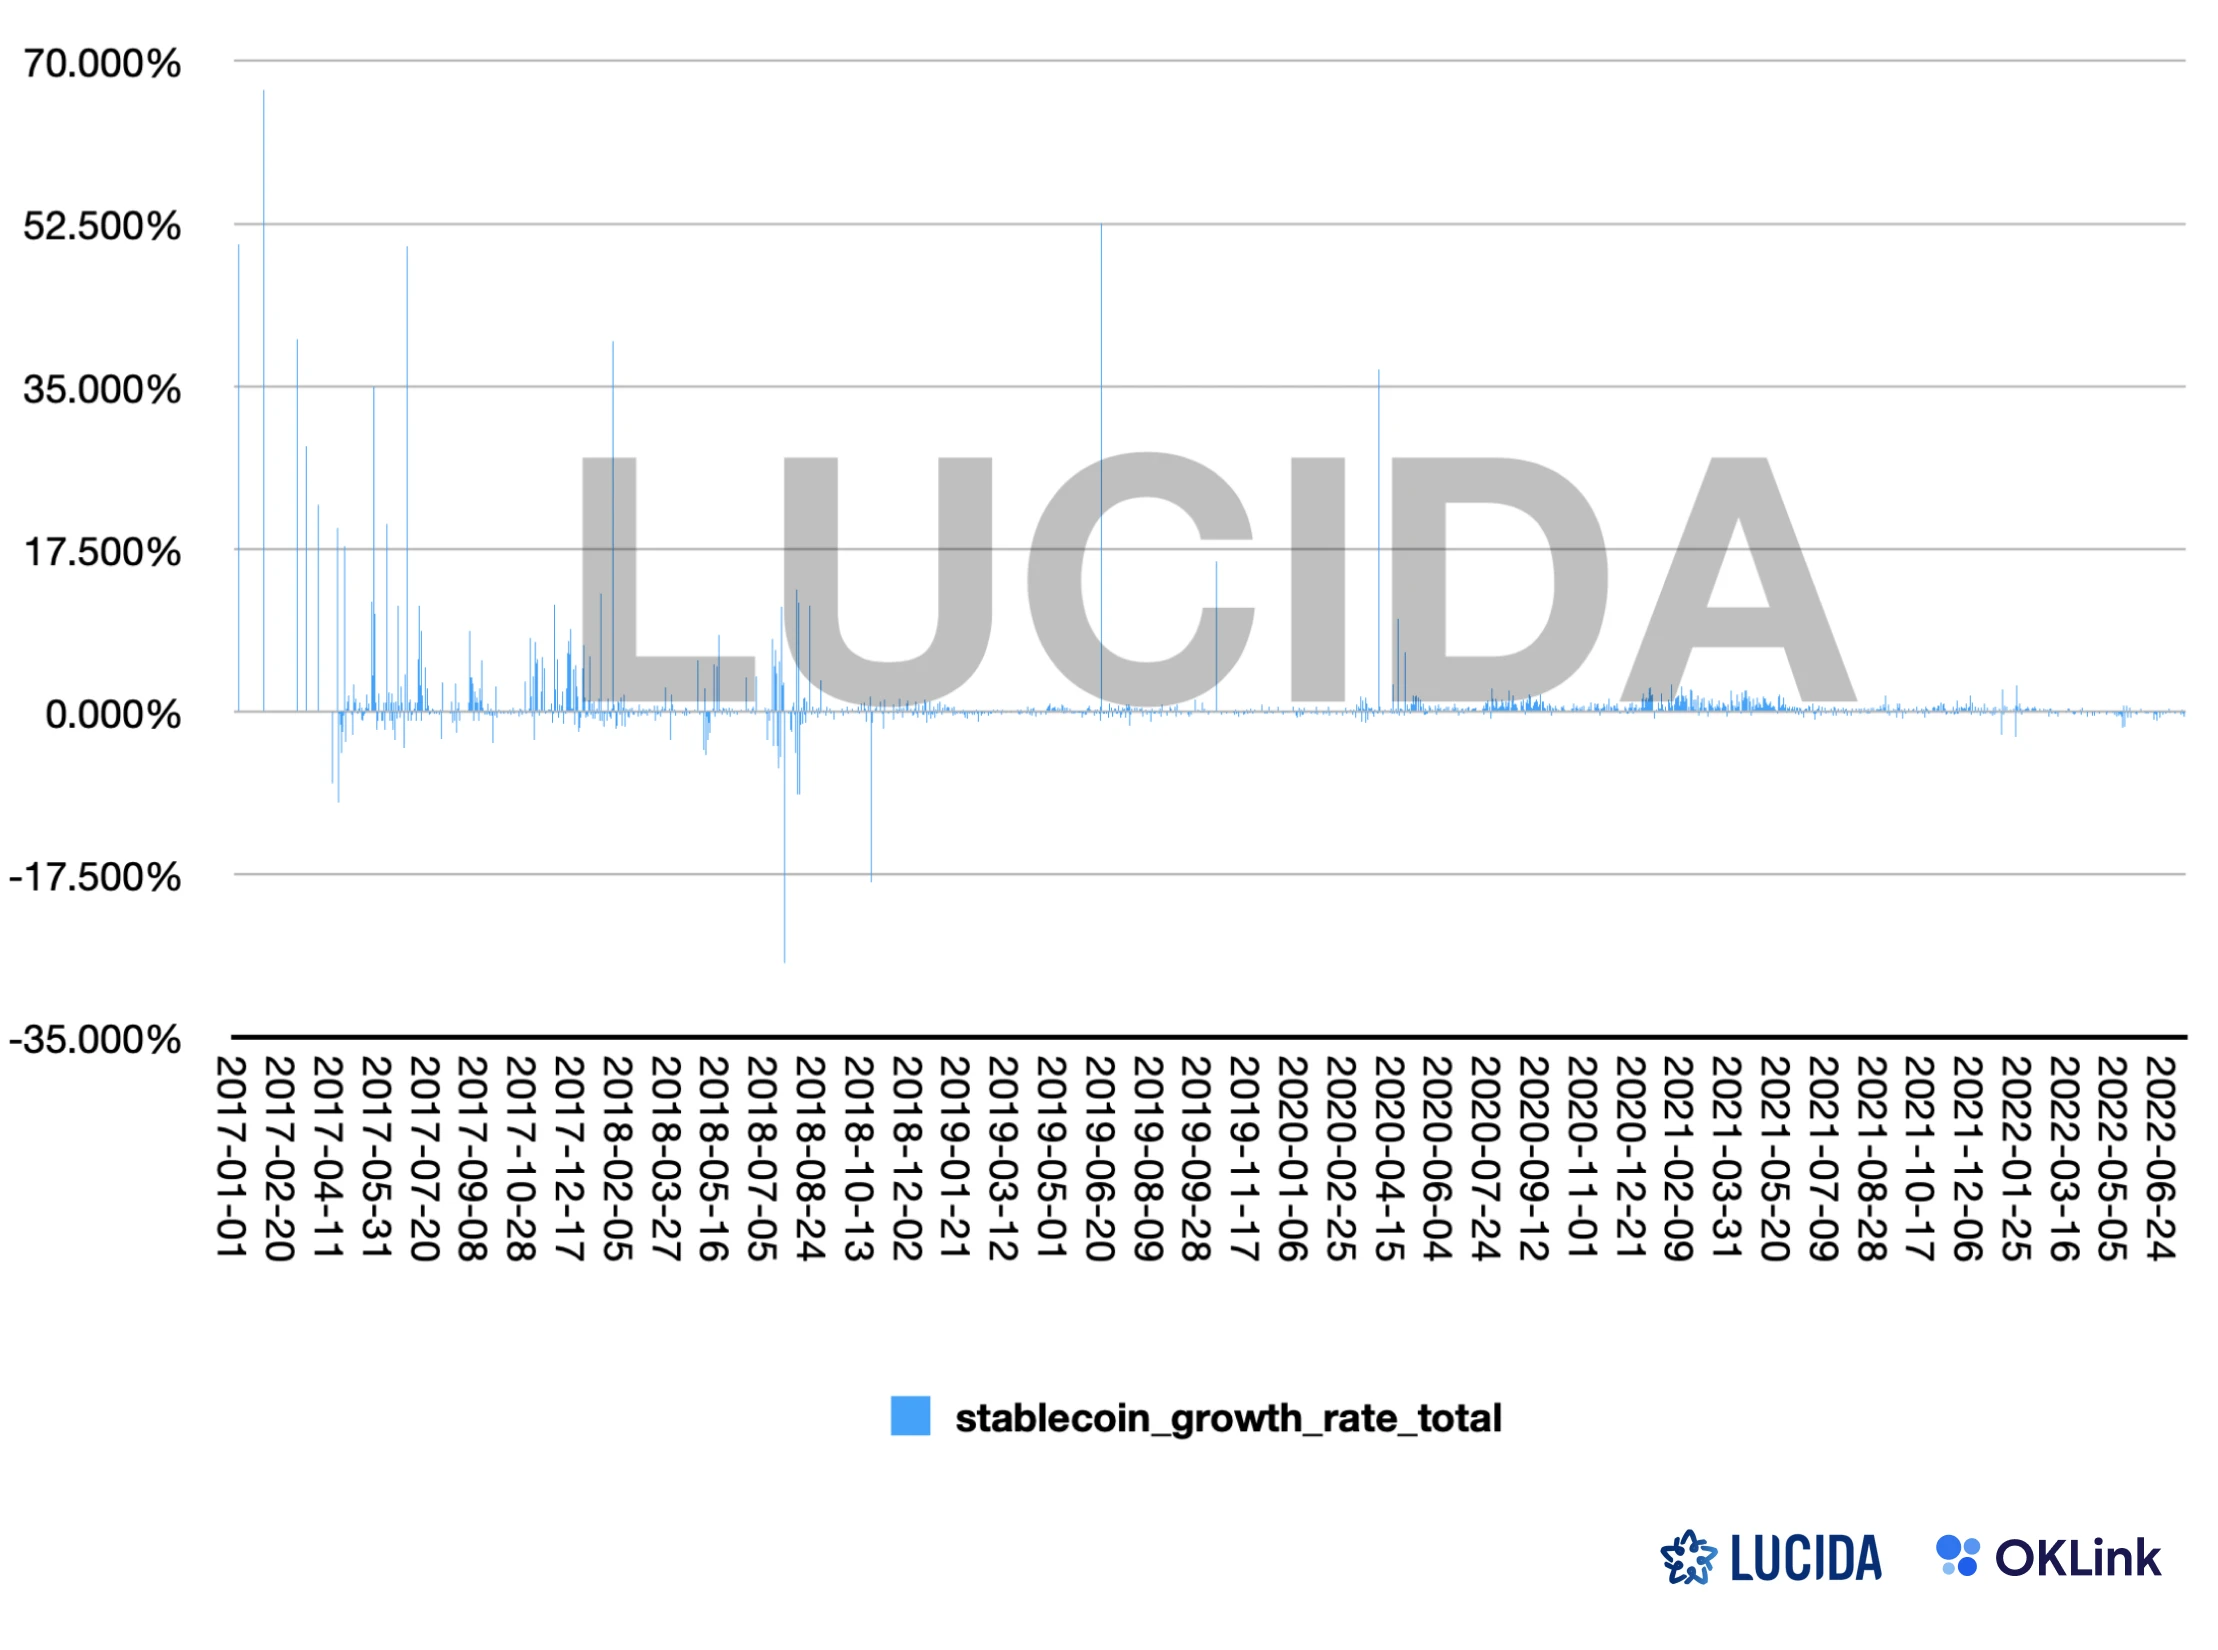 Stablecoin issuance rate factor = (∑Total stablecoin issuance on the current day - ∑Total stablecoin issuance on the previous day) / ∑Total stablecoin issuance on the previous day
The figure below is a time series chart of the rate factor of stablecoin issuance. In the two rounds of bull markets in 2017 and 2020, the rate of stablecoin issuance was above the 0 axis, and the issuance was intensive.
first level title
3. How to judge the development trend of the public chain
The public chain has always been an investment track that crypto users are keen on. In the process of the current round of the market from a bull market to a gradual bearish one, the fluctuation of public chain data indicators due to changes in the market environment provides a good analysis sample for public chain investment. We selected the representative public chains in this round of market changes, reviewed the performance of these public chains from the perspective of on-chain data, and tried to analyze which data indicators have guiding significance for public chain investment.
secondary title
In a bull market, capital leverage is high, and powerful public chains rely on various operating means and incentives to easily create market heat and form a growth flywheel brought about by the increase in the number of DApps and users. In the initial stage of this bull market, the emergence of such a growth flywheel can be seen from the indicators of major public chains.
This growth flywheel refers to the positive cycle brought about by the combination of the increase in the number of developers and the increase in the number of users. The increase in the number of developers brings more available DApps to the public chain, thereby attracting more users to participate in investment and obtain income; at the same time The increase in the number of users will also attract more developers to participate in the development of the public chain ecology.
As the most direct users of the public chain, the activity of developers and users on the chain can be used as a direct indicator to measure the quality of the public chain.
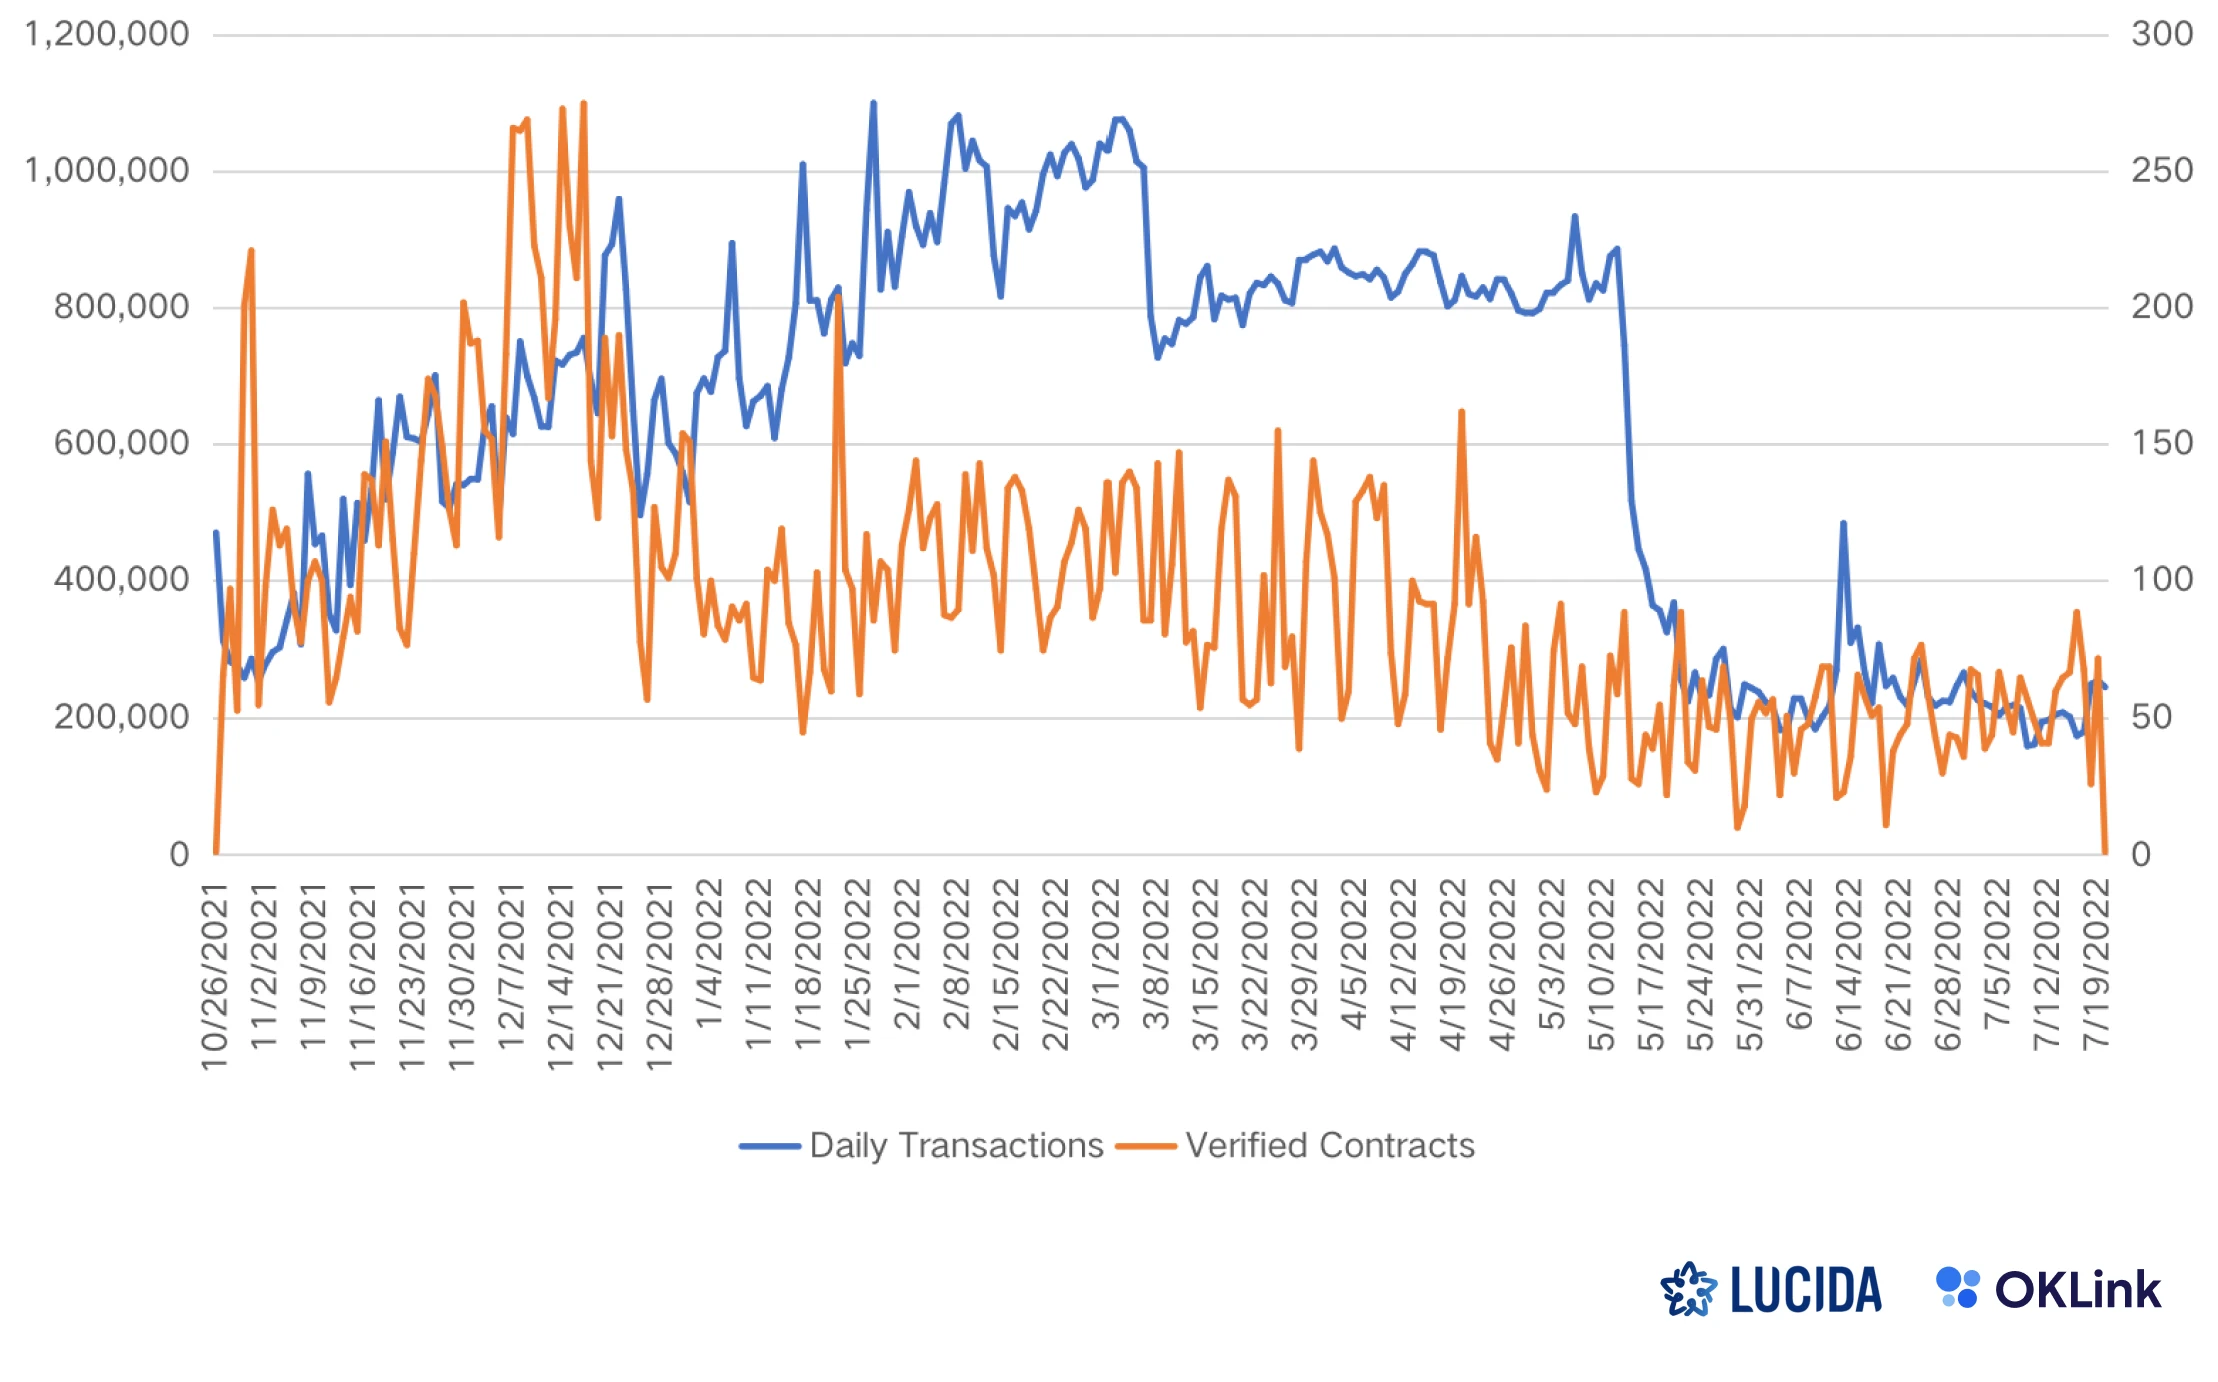
image description
Avalanche C-Chain daily average number of verified contracts/daily average transaction data
Taking Avalanche C-Chain as an example, at the beginning of the bull market, the number of verification contract addresses increased rapidly, which represented the influx of developers into the public chain ecosystem for development. With the increase in the number of developers, the average number of transactions per day is gradually increasing, which means the entry of ordinary users.
When the bear market comes, due to the exhaustion of liquidity and the disappearance of the hot spot effect, a large amount of hot money withdraws from the speculative field. At this time, only those public chains whose technical strength and ecological construction are long-term optimistic by investors can maintain a certain level of stability in the sharp drop in currency prices. The total amount locked.
The total lock-up amount is an indicator to measure the precipitation of funds on each public chain. A high total lock-up amount means that more users are willing to put their funds in the public chain agreement, which is a manifestation of user trust. At the same time, it also means that the public chain ecology can provide users with higher utility for their funds.
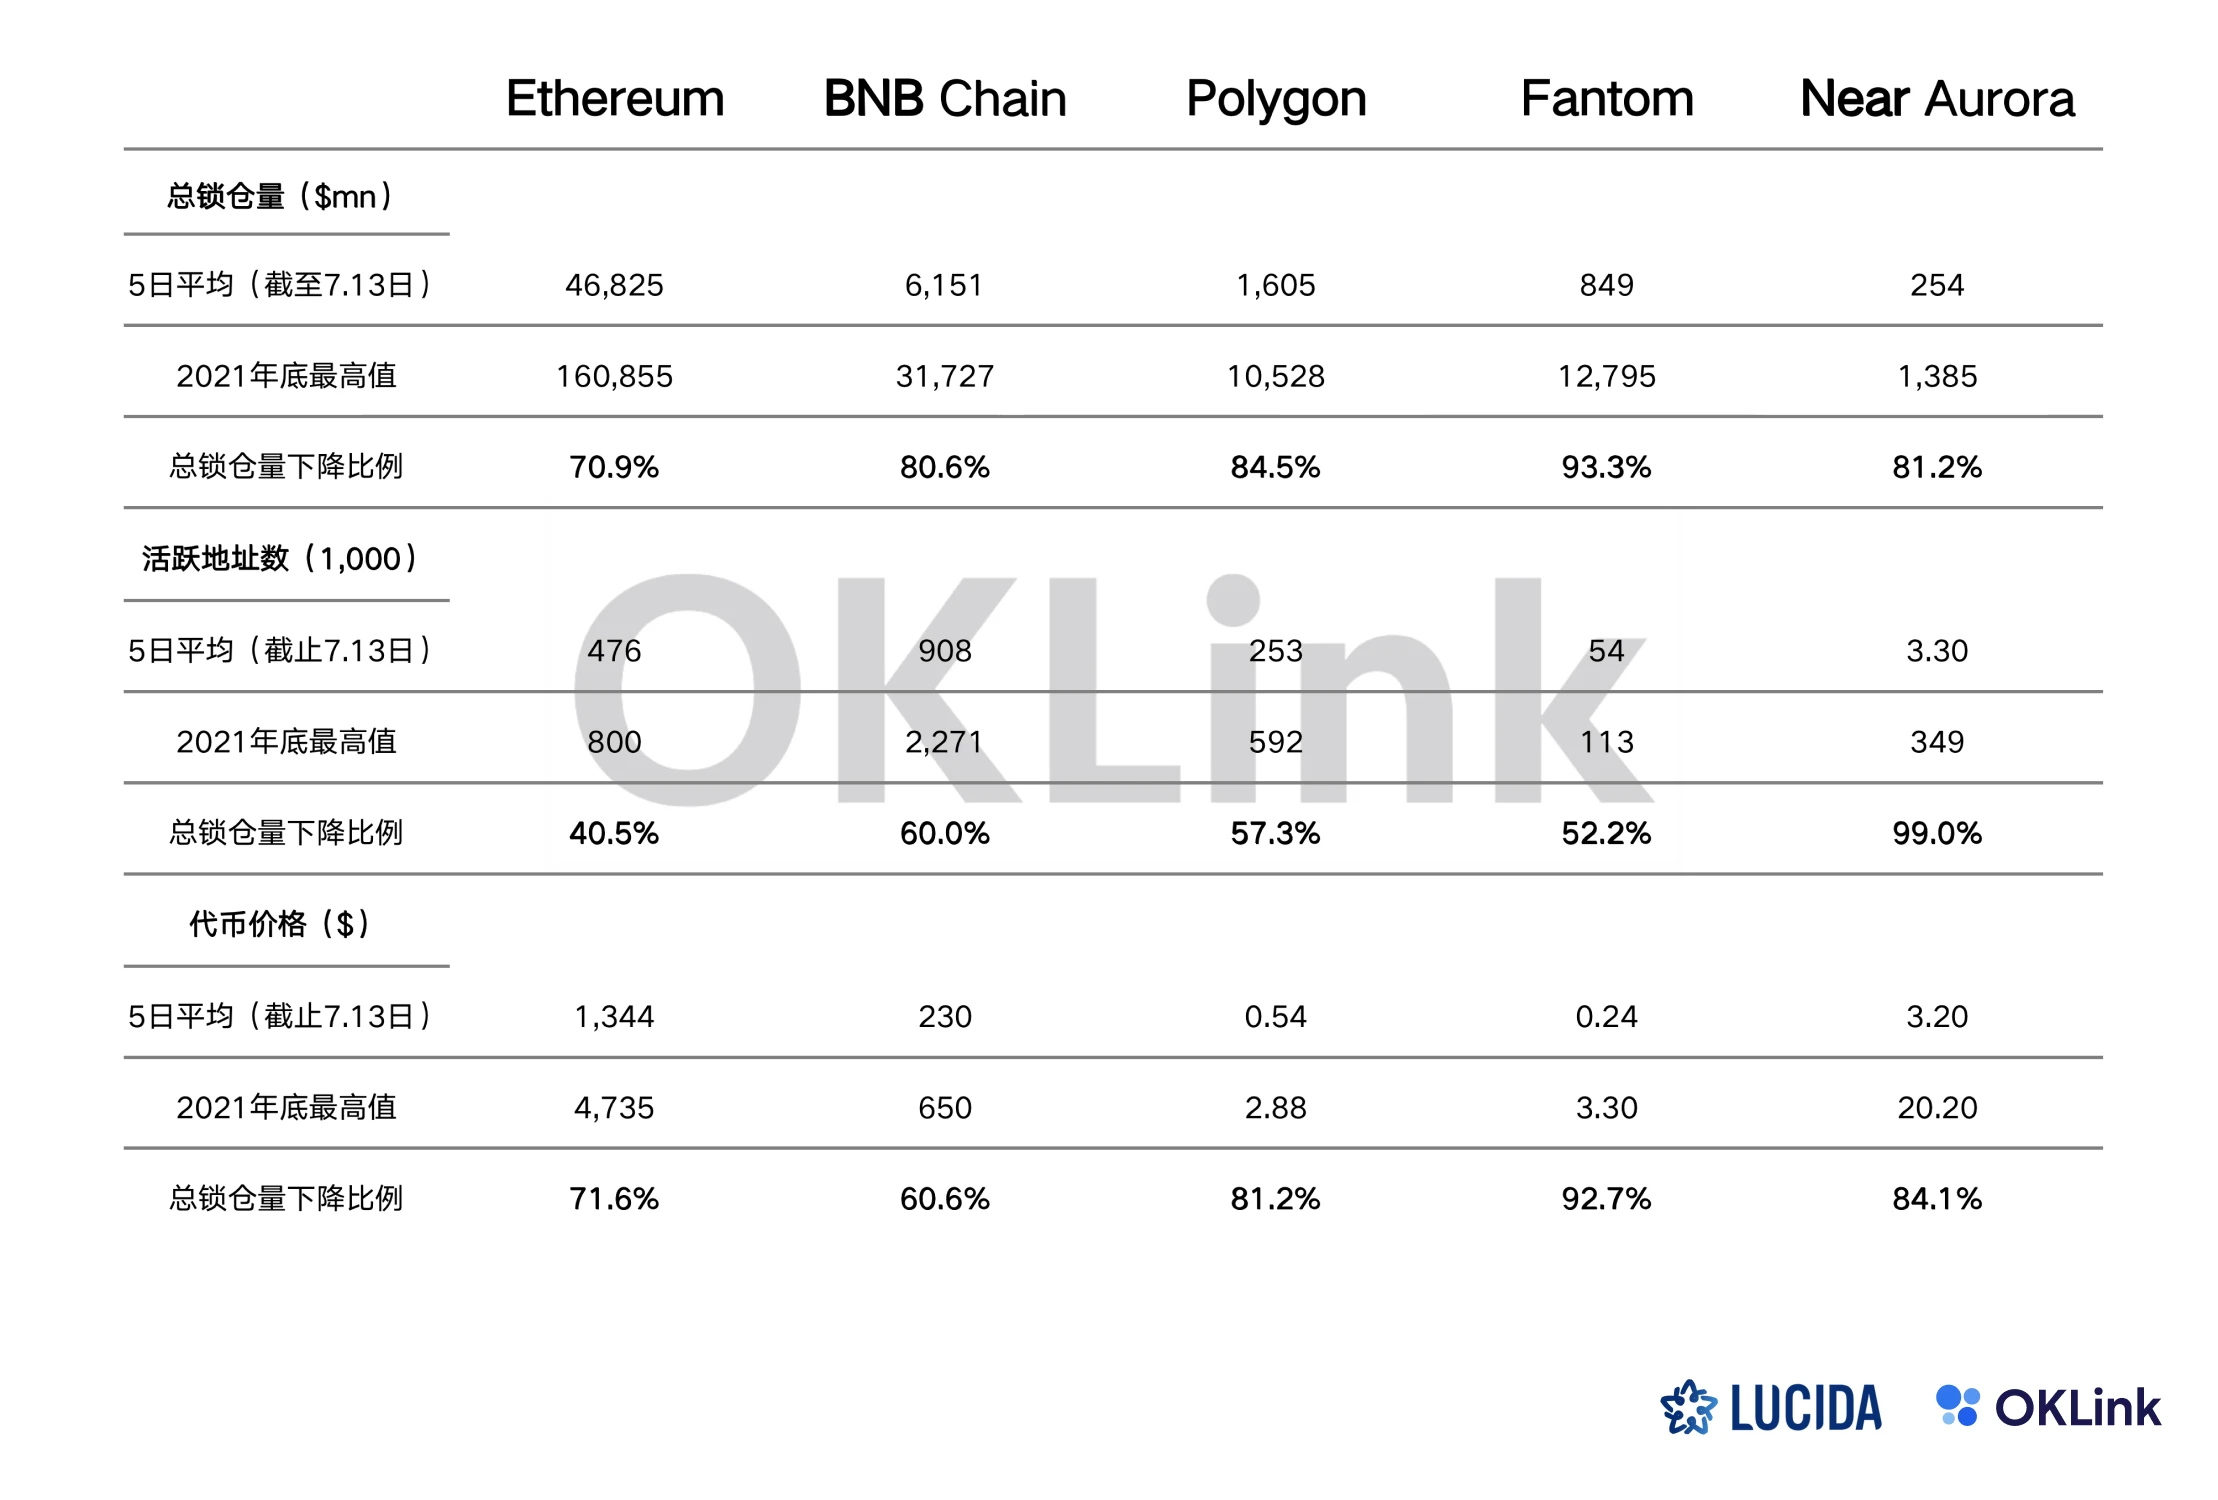
After the arrival of the bear market, all public chains have experienced a sharp drop in total locked positions:
Bear market performance data of each public chain, OKLink Explorer/Block Explorer data
It can be found that compared with the decline in the number of users, the decline in the total lock-up volume of the public chain has a greater impact on the currency price. **The total locked-up amount of the Fantom chain has the largest drop (93.3%) from the highest value in 2021, and the FTM 5-day average daily currency price has also fallen the most from a higher point.
In contrast, Near Aurora experienced the worst loss of users (99%), but the decline in currency price was still less than that of Fantom. As mainstream public chains, Ethereum, BNB Chain, and Polygon, although the total lock-up volume has also dropped significantly, their user retention is significantly higher, and the decline in currency prices is smaller than that of emerging public chains.
secondary title
2. The significance of data indicators to the secondary investment in the public chain market
When using standardized indicators to measure the quality of each public chain, it should be realized that the current public chain competition has transitioned from the early competition for cost performance and infrastructure to more complex ecosystem competition.
At present, new public chains have differentiated positioning, different operating strategies, technical characteristics and niche markets, and different incentives for developers. Although these differentiated characteristics cannot be measured by standardized indicators, they are still It is an important factor affecting the development of the public chain.
The amount of incentive locked positions has a huge impact on the performance of many public chains in this round of the market. Some public chains represented by Fantom have issued incentives based on the amount of locked positions during the bull market. These incentive policies make developers Investors are keen to set up a reward mechanism in the agreement, and set a higher-than-standard annualized return for the provider of the lock-up amount.
This measure of directly incentivizing developers to promote the ecological development of public chains has allowed these public chains to prosper rapidly in a bull market, but in a bear market as liquidity dries up, these public chains have also suffered strong backlash.
In contrast, indicators such as ecological activity and locked positions on the ** chain are more suitable for judging the current development trend of the public chain. **When conducting secondary investment in the public chain market, it is also necessary to evaluate whether the current development trend of the public chain is sustainable. It is necessary to combine quantitative and qualitative analysis to comprehensively evaluate a public chain’s support for funds, developers, applications, and users power and attractiveness.
first level title
4. AltCoin
Next, analyze the Altcoins assets represented by ERC20.
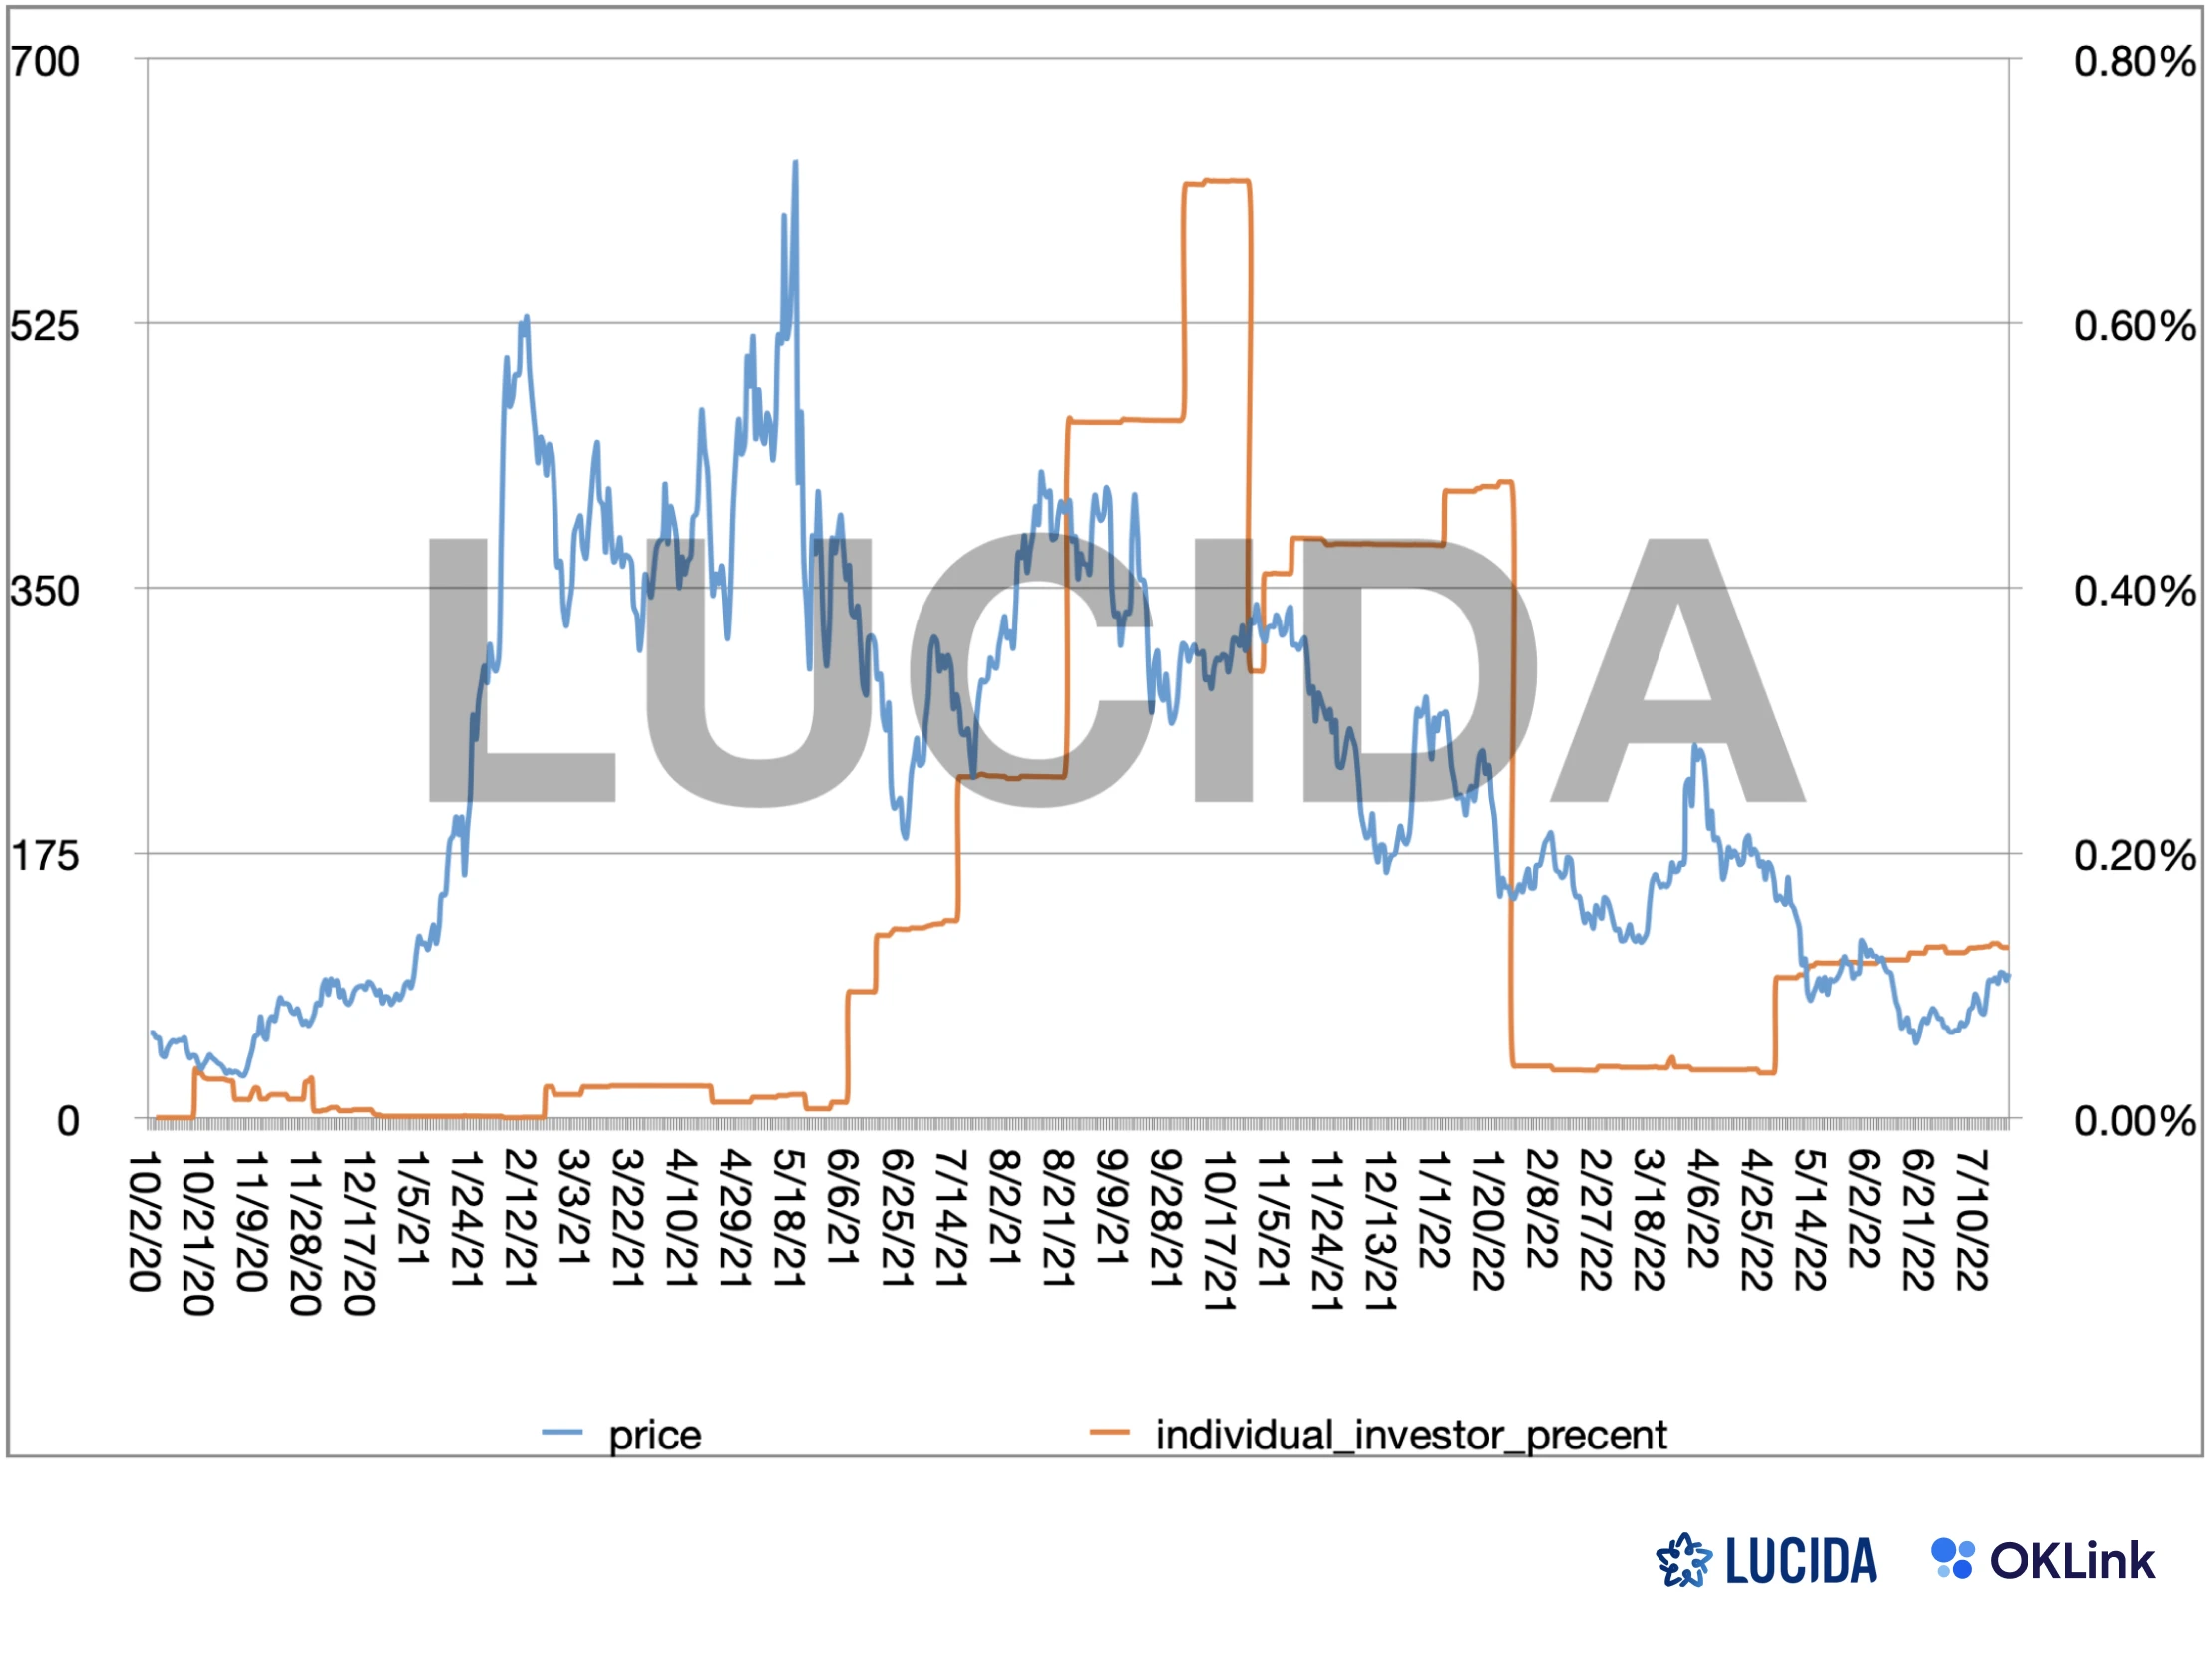
The blue line represents the price of AAVE tokens, and the orange line is the proportion of independent investors positions marked by LUCIDA in a certain statistical dimension. The specific algorithm is: the balance of this type of currency holding address / the total circulation of the currency on that day.
From May to June 2021, due to the impact of the overall market slump, the currency price of AAVE also dropped severely. However, from June onwards, the smart independent investors marked by LUCIDA began to build positions gradually and made a lot of profits in the rebound , and before the market immediately entered a new round of slump in November, all positions were cleared and left.
first level title
5. Scope of application and failure of factors
secondary title
1. Changes in the market environment
secondary title
2. Changes in time frames
The OrderBook factor is more suitable for short-term forecasts, and the stablecoin issuance rate factor (written above) is more suitable for long-term forecasts... Different factors are also suitable for different time frames.
Lucida vaguely remembers that there was a magic indicator in 2019: long-short leverage ratio. This indicator had a very high success rate in short-term forecasting at that time, but in the past three years, its forecasting accuracy has dropped a lot. First of all, 2019 is based on the market structure of the game of stock funds. Secondly, when everyone uses this indicator, who is the opponent?
epilogue
To sum up, there is no such thing as a one-size-fits-all trick in the market, and the ability to flexibly use various data in a timely manner is a hard indicator to measure the level of a fund manager or trader.
epilogue
History will not repeat itself, but it will always be surprisingly similar. Experienced investors often understand the power of this proverb. Whether it is from a technical perspective or a fundamental analysis, for investors in the unpredictable encryption market, maintaining awe of the market should be placed in the first place, and in the process of making decisions, if you can dig out Some valuable on-chain data will obviously allow us to get twice the result with half the effort and discover valuable projects or content earlier, so as to better guide investment.
About Lucida
Email: zhengnaiqian@lucida.fund / contact@lucida.fund
Twitter:@ZnQ_626 / @lucidafund
website:https://www.lucida.fund


