Author: Kevin, the Researcher from BlockBooster
Murad described Memecoin’s super cycle, and he argued in a way that VCs are familiar with, including the prospects of altcoins, the turn of the crypto industry, and the shift in future trends:
Defining the Memecoin Supercycle, spurning altcoins with $500 in daily revenue but a $7 billion valuation;
Outlining the golden age of Memecoin comes at the cost of finalizing the altcoins that have fallen to the bottom but were once full of bull market myths. All altcoins are essentially Memecoins, just more complicated versions.
Murads view may seem radical, and we have no intention of judging it, but his mention of Memecoin trading trends are changing deserves further discussion. This article will use data analysis and take $MOODENG as an example to explore the development history of Memecoins that need to build communities and make long-term investments in the early stages. At the same time, it will analyze the common characteristics of the top five Memecoins recommended by Murad and objectively observe the new trends of Memecoins.
Review of $MOODENG
Moo Deng, a pygmy hippo, was born on July 10, 2024, at the Khao Kheow Open Zoo in Thailand and quickly became a celebrity after the zoo shared photos of his birth on its official Facebook page. Due to Moo Dengs growing popularity online, the zoos average daily visitor numbers doubled in early September 2024.
There are currently three Memecoins related to Moo Deng: $MOODENG on Solana and Ethereum, and $HIPPO on Sui. The three launched tokens on September 10, September 15, and September 27, respectively.
First, let’s take a look at the common on-chain data of Solana $MOODENG:
The natural growth of the number of holders is rapid, and bots are waiting for opportunities to intervene
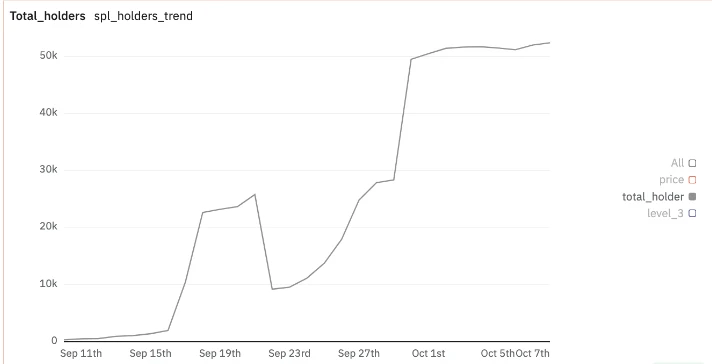
Total number of SOL $MOODENG addresses increased
Looking at the chart of total wallet address growth, there are three notable periods of unusual activity:
First, the number of addresses increased dramatically between September 16 and 18, jumping from 1,970 to 22,645;
After three days of natural growth, there was an unusual drop between September 21 and 22, when the number of addresses decreased from 25,790 to 9,204;
The second unusual surge occurred between September 29 and 30, when the number of addresses jumped from 28, 344 to 49, 502.
Additionally, out of the current total of 52,413 addresses, 25,464 have never sold their holdings since their initial purchase, a whopping 48% of all addresses are Diamond Holders.
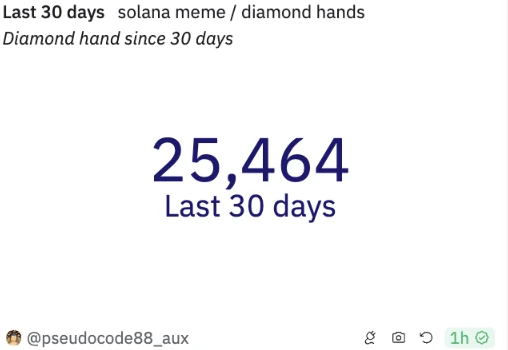
SOL $MOODENG Diamond Lot Address Number
When we do a simple screening of the on-chain address holding levels, we can find that the $MOODENG holdings of the above abnormal addresses are all less than 100. When the natural growth was not as active as expected, the team quickly, massively, and linearly released nearly 20,000 addresses within three days, allowing the on-chain indicators of $MOODENG to trigger the alarm indicators of the chain-sweeping robot, while maintaining a stable upward channel in price, attracting market attention.
At the same time, we observe the following three charts, which show the total number of wallet addresses holding $MOODENG, the number of addresses holding 0.0005% of $MOODENG (4,950 addresses, about $693), the number of addresses holding 0.005% (49,500 addresses, about $6,930), and the number of addresses holding 0.05% (495,000 addresses, about $69,300). After filtering out bot addresses and raising the minimum holding threshold to 4,950 $MOODENG, we can see a clearer trend: the number of holders of small and medium positions continues to grow steadily, while the number of large holders stops growing after the 21st.
Focusing on small positions, we can see that starting from September 16, the number of addresses soared due to a surge in new addresses. As the FOMO effect intensified, the natural growth of small positions accelerated further, peaking on the 20th. When the team observed this steady natural growth, they removed the bot addresses that were launched between the 16th and the 18th. As the price of $MOODENG peaked on the 28th, the number of addresses began to decline, in sync with the price trend.
The growth of medium-sized positions slowed down after the 18th, and the selling volume after the 28th was larger than that of small positions.
From September 28 to October 6, small positions decreased by 12.2%, medium positions decreased by 16.5%, and large positions decreased by 25.8%.

SOL $MOODENG ladder address speed increase
The peak times of the three types of positions are also different: large positions reached their highest on September 21, medium positions peaked on September 27, and small positions reached their maximum number on September 28.
High concentration of chips
Further digging into the on-chain data of $MOODENG, we can see that after ignoring the interference of the top 10 addresses, the top 5% of the remaining addresses hold nearly 90% of the circulation. Specifically, the top 5% of addresses held 46% on the 10th, jumped to 71% on the 11th, and remained above 90% between the 21st and 24th. It is currently around 85%. Therefore, the holding of $MOODENG tokens is highly concentrated.
Mature team operation
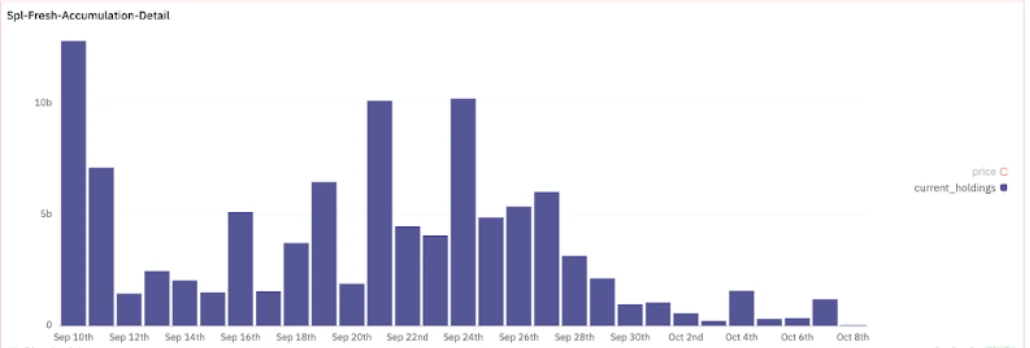
SOL $MOODENG Large purchases from a single address
The team has been buying since the token was issued until the 28th. As shown in the figure, the team accumulated a large number of chips in the first two days, especially on the 10th and 11th, and also achieved remarkable results in maintaining the K-line trend. Combining the above and below figures, we can intuitively see that the team made two strong price pushes on the 21st and 24th, with three days as a box, and rhythmically broke through the consolidation range.

SOL $MOODENG Price Chart
Comparison with Ethereum $MOODENG
Using the indicators mentioned above to observe the on-chain data of Ethereum $MOODENG, we can find that for retail investors, before Vitalik sold the $MOODENG in his wallet, people had already lost interest in it, the on-chain address had hardly increased, and the team did not actively maintain the community and trend pattern, which is a very common situation in copycats. In the 10 days before that, the total number of addresses did not increase at all, and the team had already given up.
Interestingly, the addresses of medium-sized holdings have chosen to sell tokens as the price continued to fall during this period. From the 25th to the 5th, medium-sized holdings have been selling to reduce losses. In contrast, the buy and hold strategy of retail investors.
On October 5, with Vitaliks tweet, the FOMO sentiment on the ETH chain was ignited, causing a sudden surge in small holdings. Medium holdings also increased, but after reaching a peak on the 7th, many addresses began to sell, as did large holdings. From the chart above, we can see that large addresses started selling on the 5th, while medium and large addresses only started selling on the 7th. It is self-evident that the team is anxious to ship.
In terms of chip concentration, the concentration of $MOODENG tokens on the ETH chain is not as high as that on the SOL chain, but it has been steadily rising since the 5th, reaching a peak of 58.6% on the 8th.
Controlling the Token Holding Structure and Trend Pattern: A New Idea for Memecoin Marketing
$MOODENG on SOL did not conduct much KOL promotion. Instead, the team focused on promoting its own X account. Its core strategy is reflected in controlling the trend of tokens. While building the community, a large number of tokens were accumulated in the early stage, the chips were highly concentrated, and a breakthrough was achieved after multiple consolidation phases. In terms of price trend control and trading strategy, the ETH team pales in comparison. The SOL team successfully centralized and controlled 90% of the tokens, while the ETH team only controlled 48%. However, controlling chips is commonplace for any Memecoin. This is not to say that controlling chips is not important, but what to do after controlling chips is the place to distinguish the superior and the inferior. In terms of expanding influence, todays Memecoin no longer relies on KOL promotion. For the team, the key is how to trigger these robots and platform indicators manually. If operated properly, these robots and platforms can become free marketing tools.
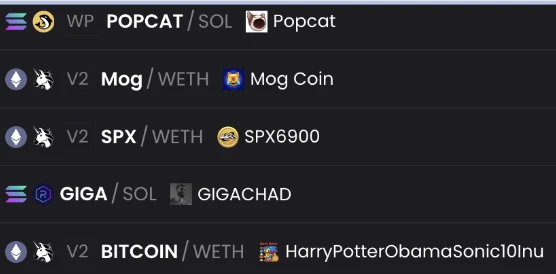
A look at Murads top five Memecoins by market cap
Murad mentioned that when choosing Memecoin, the reference criteria are as follows: mid-market value between $5 million and $200 million; located in Solana and Ethereum; at least six months of history. These criteria can also be understood using the indicators mentioned above. In my opinion, they can be converted into two directions: the teams willingness to maintain the price; the degree of Fomo that inspires users.
The former refers to the ability of the team/whale/community to maintain the price when the price falls, form a long period of stable consolidation, and strongly push the price when a breakthrough is needed. For Memecoin, it is difficult to continuously drive the price up by user sentiment alone, because no one can control the buying and selling behavior of retail investors. Therefore, for the team, attracting large holders or retail traders ultimately depends on their own price behavior on the token, especially during declines and breakthroughs. Therefore, the concentration of team/whale chips in some ways implies the willingness and determination of the team to take action at key price nodes. Of course, this process is also inseparable from the support of the community. For example, the price trend of $SPX is not strongly correlated with the teams actions, which is due to Murads influence. The latter can be analyzed from the increase in the number of user holdings, and observing the changes in the head holdings can guide us when to sell.
In terms of the top 5% dominance rate, the top five tokens recommended by Murad are all strong market makers, with the team and big investors controlling most of the chips. Among them, the concentration rate of $POPCAT and $GIGA exceeds 85%. The remaining three are also above 60%. The highly concentrated chip structure ensures that when the price pattern changes or breaks through, the price can follow the teams wishes to a certain extent and is not easy to collapse. For tokens with a small number of team holdings, you may see a sharp rise in price, but it will begin to collapse within 1-3 days, which is a greater test of the grasp of the timing of selling.
Among these 5 tokens, the ones that best reflect these two directions are $POPCAT, $MOG, and $SPX.
The most recent intervention of the $POPCAT team into the token occurred on October 10. A week before that, on October 4, the team did not significantly push the price to break through the ATH, but after three days of rising, retail investors began to sell. Within three days, the selling volume did not decrease, but the daily price drop was about 5%. Therefore, on the 10th, the team bought a lot to keep the price in the rising channel. Similarly, the teams three recent adjustments to the $MOG trend occurred in late September and early October. The current major trend of $MOG is a six-month consolidation box, and the minor trend is a more than one-month rising channel. When the price begins to approach the middle axis of the box, retail investors will sell. The closer to the upper edge of the box, the stronger the retail investors selling sentiment. The team controlled the pattern at the price that was about to break through the rising channel three times, showing that the team has a strong desire to maintain the trend and potential breakthrough hints. Both $POPCAT and $MOG have obvious team/whale/banker manipulation behaviors, giving the market clear signals and gathering upward forces.
$SPX is different from the other two. It is one of the most fomo tokens in the market in September, so retail investors have a strong buying sentiment. As the price is accelerating through one rising channel after another, it does not require the team to intervene strongly in the token trend to maintain the amazing increase. Murads amazing ability to bring goods has brought the retail investor Fomo level of $SPX to a high point.
Memecoin Exchange List
Among the top 200 tokens, except for the 5 recommended by Murad, the remaining Memecoins have their main liquidity in exchanges. During this cycle, the trends of Memecoins in exchanges are also different. According to the liquidity dominance rate and the duration of a single pattern, it can be suggested whether there will be a strong price performance after the breakthrough. Compared with this price performance and the on-chain Memecoin, which side is stronger?
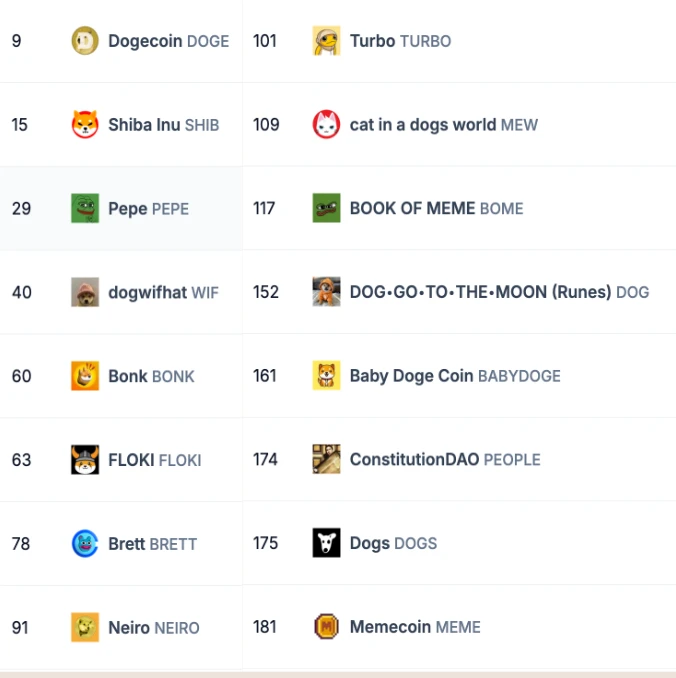
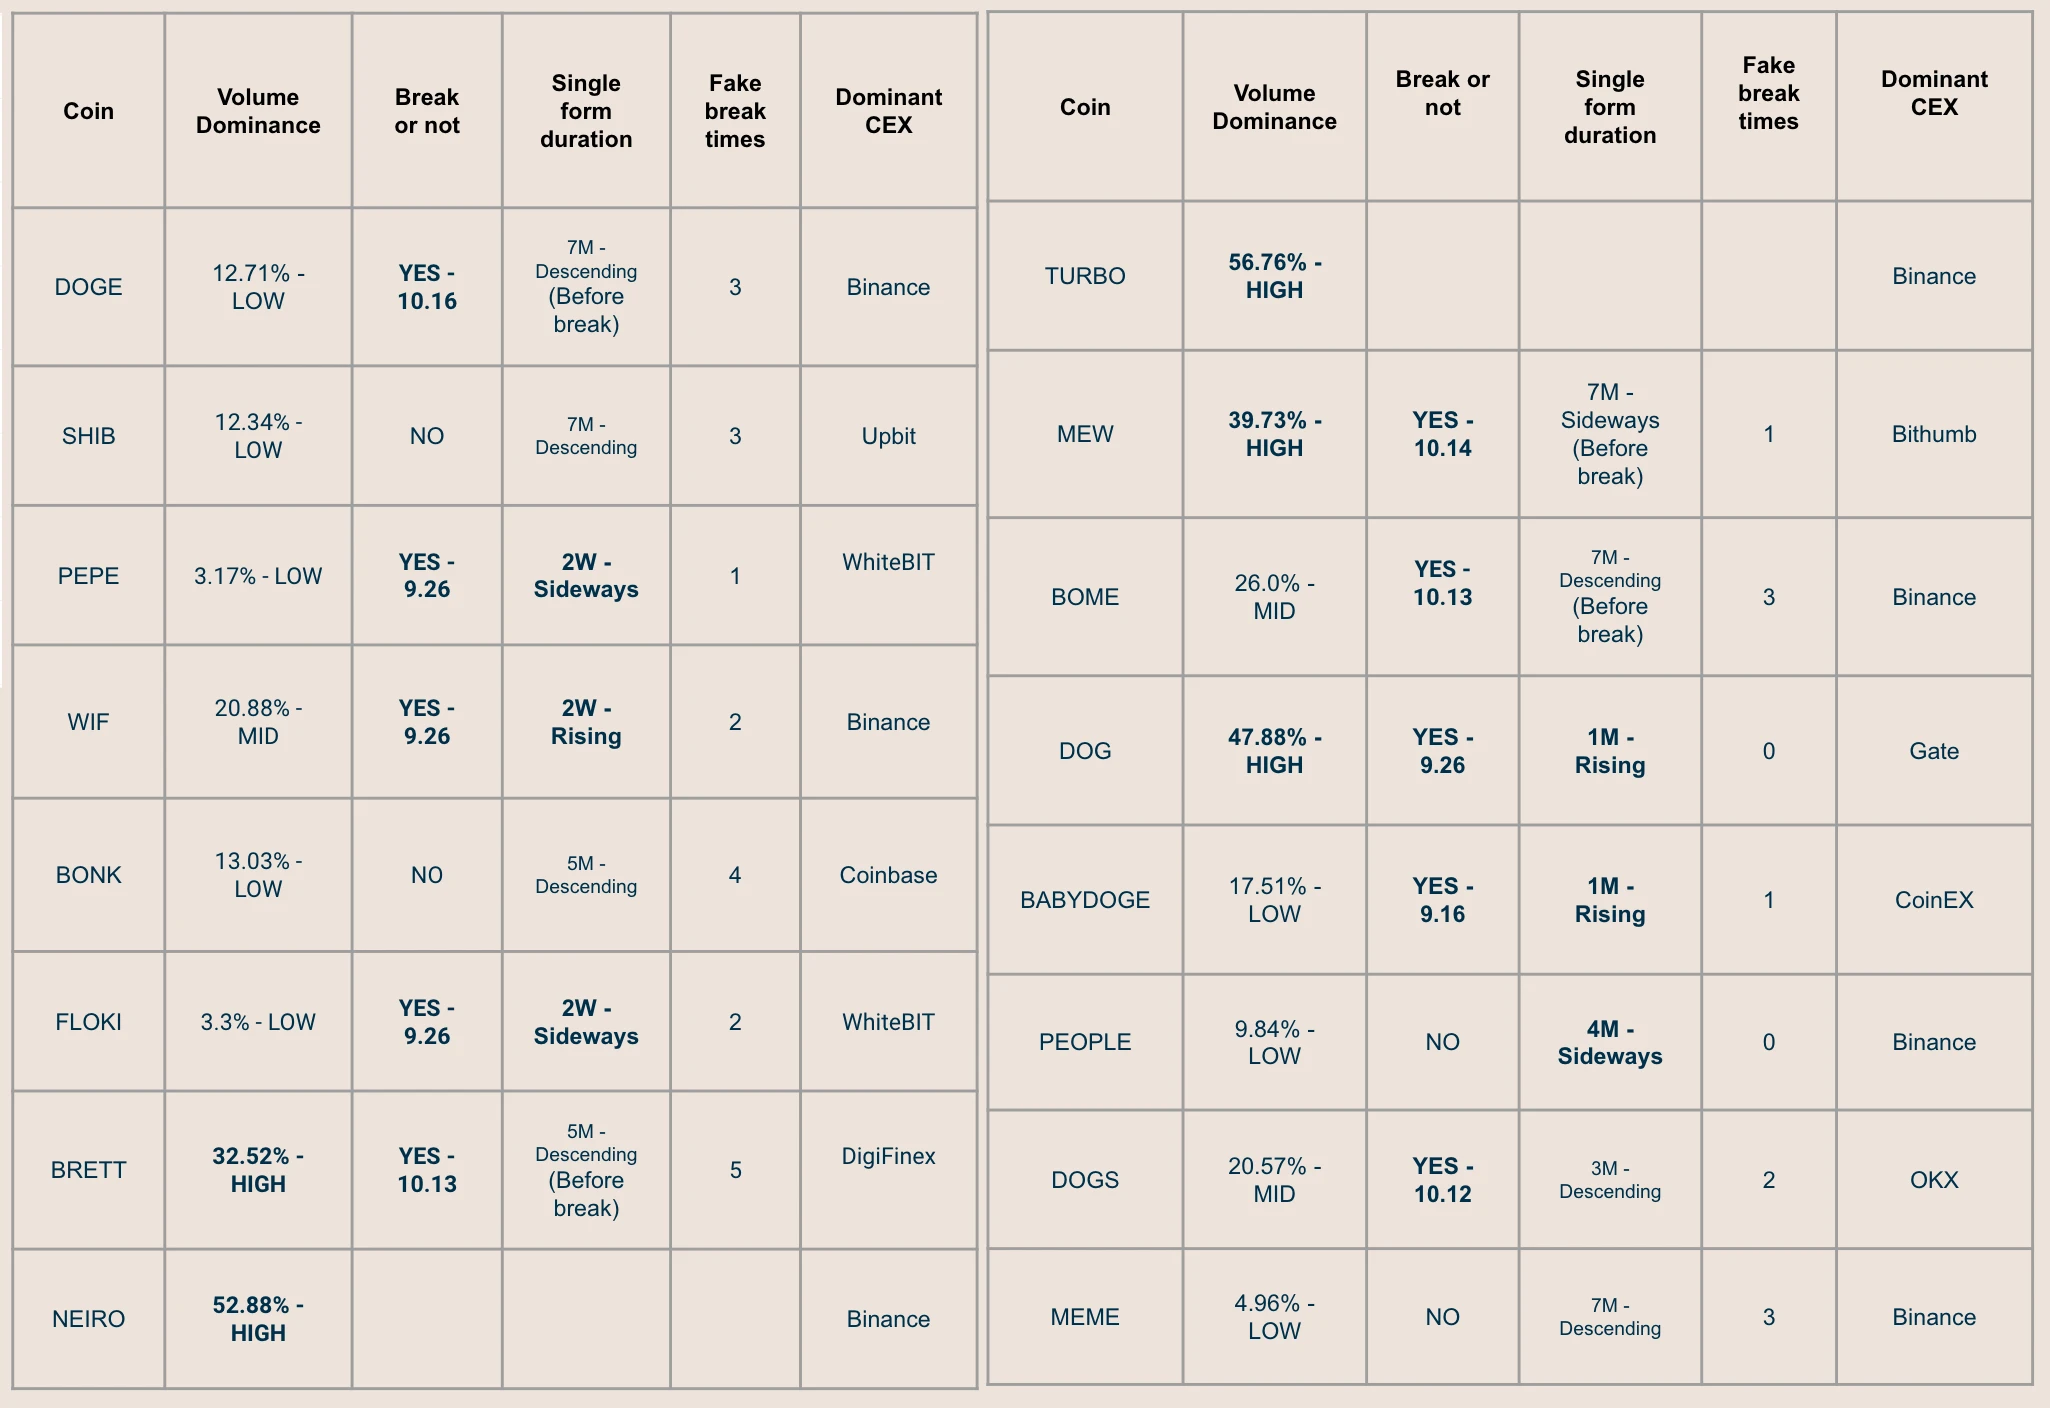
Specifically, $Neiro and $TURBO both have very high dominance rates, and the main liquidity is in Binance. When Binance has the vast majority of chips, it no longer needs to consolidate and absorb chips, and can drive the market immediately.
BRETT, MEW, and DOG are the remaining three tokens with high dominance rates, and they have also recently achieved a transformation or breakthrough. BRETT achieved a breakthrough in a 5-month descending channel, and MEW achieved a breakthrough in a 7-month descending channel, but because their liquidity is not in the mainstream exchanges, the trend after the breakthrough is not as strong as Memecoin listed above. After the breakthrough, DOG maintained an upward channel for a month.
Due to dispersed liquidity, some tokens failed to maintain the upward channel after breaking through, which is quite regrettable. For example, pepe, after breaking through the 7-month consolidation period, is currently in a 2-week sideways box, which is not very good compared with other hot Memecoins.
In addition, other Memecoins that have achieved price breakthroughs include Wif, Bome, DOGS and DOGE. Among them, Wif is in a 2-week rising channel, Bome is the latest to break out among the Binance-led Memecoins, and DOGE, like Bome, has broken out of a 7-month consolidation period. We look forward to their next trends. DOGS is still in a 3-month falling channel.
The remaining tokens that have been sideways for 7 months but have not achieved a breakthrough include SHIB, BONK, and MEME. The more false breakthroughs there are, the more likely it is that the token will not be able to break out of its own independent market trend, and it needs to rely on the market trend. It is suggested that you need to pay attention to the stop loss price when buying on the right side. People has been sideways for 4 months, and you also need to pay attention to the buying position when the price breaks through.
summary
The Memecoin craze is far from over, but altcoins are by no means worthless. Whether focusing on fundamentals can bring corresponding returns in this cycle is still an open question. This article introduces how to verify the common points of the development of hot Memecoin from on-chain data, hoping to provide you with one of the possible future trends of Memecoin.
(All the pictures in this article are made by the author. Please contact the author if you need to use them)
About BlockBooster: BlockBooster is an Asian Web3 venture studio backed by OKX Ventures and other top institutions, committed to becoming a trusted partner for outstanding entrepreneurs. Through strategic investment and in-depth incubation, we connect Web3 projects with the real world and help high-quality entrepreneurial projects grow.
Disclaimer: This article/blog is for informational purposes only and represents the personal opinions of the author and does not necessarily represent the views of BlockBooster. This article is not intended to provide: (i) investment advice or investment recommendations; (ii) an offer or solicitation to buy, sell or hold digital assets; or (iii) financial, accounting, legal or tax advice. Holding digital assets, including stablecoins and NFTs, carries a high degree of risk and may fluctuate in price or become worthless. You should carefully consider whether trading or holding digital assets is appropriate for you based on your financial situation. If you have questions about your specific situation, please consult your legal, tax or investment advisor. The information provided in this article (including market data and statistics, if any) is for general informational purposes only. Reasonable care has been taken in preparing these data and charts, but no responsibility is assumed for any factual errors or omissions expressed therein.

