


Original article from The Defi Report
Compiled by Odaily Planet Daily Golem ( @web3_golem )

Editors note: In early March, researchers at The Defi Report believed that January 2025 was the peak of this round of bull market, and the market has entered a bear market that will last for 9-12 months (Related reading: The evidence is strong, we are entering a bear market ). Looking back at Bitcoins performance since 2025, Bitcoin hit a record high in January, but then fell 17.67% in February, with a monthly closing price of $84,339. March is about to end, and if there is no major fluctuation in the market in the next two days, the closing price in March should be between $85,000 and $86,000, which means that Bitcoin has been in a sideways fluctuation phase throughout March.
So, what will happen to Bitcoin and the entire crypto market in the future? Given that the market situation is constantly changing, researchers at The Defi Report have reassessed the market, but they still maintain the view that we are in the early stages of a bear market, rather than a short-term consolidation . Odaily Planet Daily has compiled its full analysis of the market as follows, condolences~
Analyzing Bitcoin through Momentum Indicators
Using the 50, 100 and 200 day simple moving averages is very useful for identifying long term trend reversals, helping us to eliminate the impact of short term volatility and gain a clearer understanding of the markets directional bias.
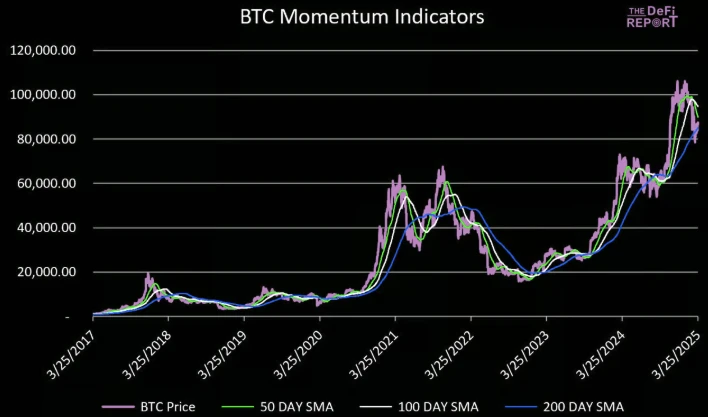
Bitcoin Momentum Indicator
BTC is currently trading below its 50-day moving average price ($89,900) and 100-day moving average price ($94,600). In addition, the shorter 50-day moving average fell below the 100-day moving average price on March 4, 2025 (after the price peaked on January 30, 2025), which indicates that Bitcoins upward momentum has weakened and the bull market structure may have been interrupted.
BTC price is still slightly above its 200-day moving average price ($85,000), which is a critical support area because once the 50-day moving average price falls below the 200-day moving average price, the bearish trend is like final confirmation. Here is an analysis of Bitcoins history of 50-day moving averages that fell below the 100-day moving average after a sustained uptrend of at least 2 years:
2013 Cycle : Bitcoin’s 50-day moving average fell below its 100-day moving average on February 20, 2014, after the price peaked on December 4, 2013. The 50-day moving average then fell below its 200-day moving average on March 24, 2014 (commonly known as the “death cross”). About a month later, the 100-day moving average fell below its 200-day moving average. This was the final confirmation of a long-term downtrend, as Bitcoin entered a bear market thereafter, with prices bottoming out about a year later.
2017 Cycle : Bitcoin’s 50-day moving average fell below its 100-day moving average on February 15, 2018, after the price peaked on December 18, 2017. The 50-day moving average fell below its 200-day moving average on March 30, 2018 (a “death cross”). A month later, the 100-day moving average fell below its 200-day moving average. BTC then experienced a year-long bear market, with the price bottoming on December 14, 2018.
2021 Cycle : Bitcoin’s 50-day moving average fell below the 100-day moving average on December 27, 2021, after the price peaked on November 14, 2021. The 50-day moving average fell below the 200-day moving average on January 14, 2022 (a “death cross”). A month later, the 100-day moving average fell below the 200-day moving average. BTC then experienced a year-long bear market, with the price bottoming on November 17, 2022.
Notable exceptions
2020 COVID-19 : Bitcoin’s market trend was broken during the COVID-19 pandemic in March 2020, which was the beginning of the upward trend. This was because of the massive fiscal and monetary stimulus that was implemented at the time.
May 2021 : After Bitcoins massive rally from late 2020 to March 2021, Bitcoins market structure trend collapsed after a 50% correction mid-cycle. But the market then rebounded and Bitcoin (barely) hit a new high 6 months later. We were in a period of sustained fiscal and monetary stimulus + multiple catalysts in the alt market (NFT, metaverse).
September 2024 : Bitcoin price fell slightly below its key moving average last September before regaining it less than a month later. There were still many bullish catalysts yet to land, namely: Fed rate cuts + Trump/strategic Bitcoin reserves.
Bitcoin could break support in early April
Bitcoin is now trading below two of the three key long-term moving averages, with the 50-day moving average below the 100-day moving average about a month after Bitcoin peaked ($109,000). This is consistent with what we have seen in past cycles (uptrends that lasted at least 2+ years) before the start of a longer downtrend.
That being said, Bitcoin price is currently trading above its 200-day moving average ($85,000). If the price breaks below this support and fails to recover quickly, it would be further confirmation that the bull market structure has broken down . If history is any guide, if this continues, we can expect the 50-day moving average to break below the 200-day moving average (a “death cross”) sometime in early April .
Of course, we still need further context (and data) to assess the likelihood of a rebound and a reversal to an upward trend. Therefore, the following will analyze some on-chain data and the current macro environment.
Bitcoin on-chain data
This section will focus on short-term Bitcoin holders and key momentum data to further assist the momentum indicator analysis above.
Short-term holder costs
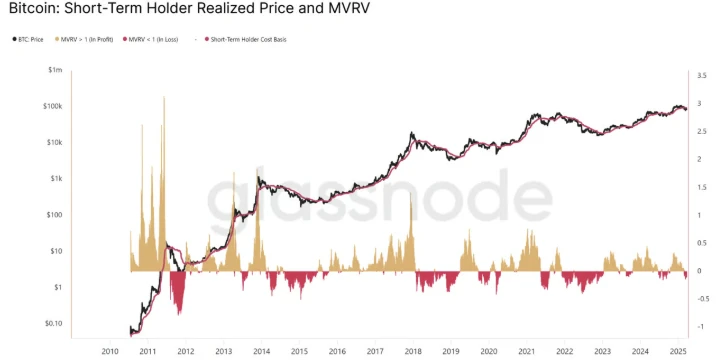
Data: Glassnode
Short-term holders are currently in a floating loss on average, and the cost of short-term holders is currently $93,400. Similar to the analysis above, what happens when the cost of short-term holders falls below the price of Bitcoin after a sustained upward trend of at least 2 years in history?
The study found that in each cycle, when the price of Bitcoin falls below the cost of short-term holders, there will be a relief rebound that brings the price of Bitcoin back above the cost of short-term holders, but the rebound will eventually fall below it because new paper hands entering the market in the late cycle usually sell off.
In the current cycle, this happened in early March when the price dropped to $78,000 and recovered to above $90,000 after Trump tweeted about the strategic reserve, but the price did not hold. There may be another relief rally, and we need to see if the price can hold and regain upward momentum.
Long-term holder dynamics
Long-term holders tend to buy at the bottom, while short-term holders tend to quickly push prices to all-time highs when prices plummet.
Long-term holders are buying the dips after taking profits in Q1 and Q4 of last year (shown in green on the far right of the chart below). But this does not necessarily mean that we are at a new bottom in this cycle. We can see similar situations early in past bear markets, where investors quickly bought the dips before prices eventually fell and then got caught.
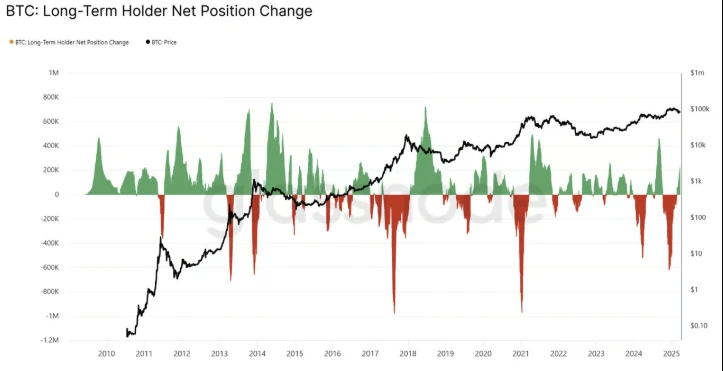
Data: Glassnode
Bitcoin transaction volume
Bitcoin trading volume fell sharply in March, averaging $9.6 billion per day, below pre-election levels . It has now been four consecutive months of declining average daily trading volume, similar to the period from November 2021 (price peak of the previous cycle) to February 22, 2022.

Data: Glassnode
Animal Spirits on the Chain
This section assesses the situation of “ Animal Spirits ” on Solana, where cryptocurrency casinos play a role in this cycle. (Odaily Note: Animal Spirits refers to the influence of investors’ confidence, emotions, and psychological expectations on market decisions. This concept was first proposed by Keynes in “The General Theory of Employment, Interest, and Money” (1936). He used “animal spirits” to describe the intuition, impulse, and optimism shown by investors in the face of uncertainty)
DEX Trading Volume
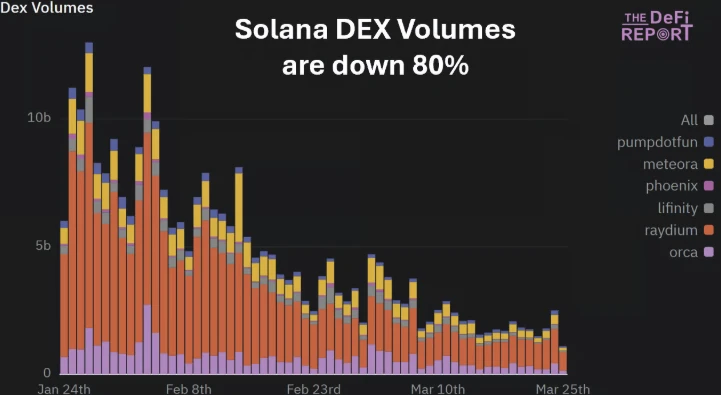
Average daily DEX volume on Solana has fallen by about 80% over the past month and is down 95% from its peak in mid-January. Over the same period, Ethereum’s DEX volume has fallen by 45% and Base’s DEX volume has fallen by 65%.
Newly Listed Tokens
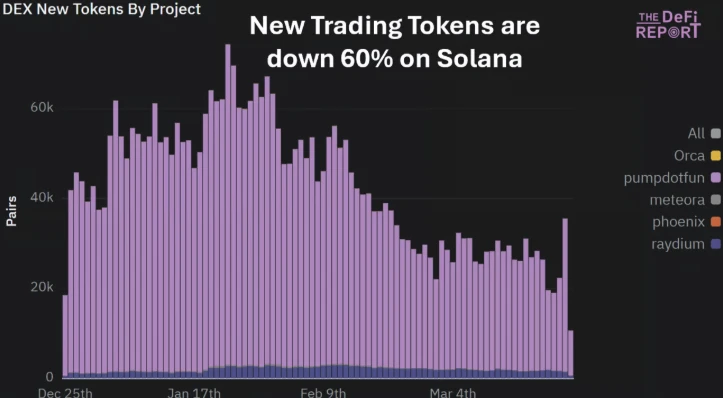
Solana has averaged about 24,000 new tokens per day over the past week, down about 60% from its peak in late January but similar to levels from late September to early October last year.
Still, 24,000 tokens per day is still a lot, and the animal spirits haven’t completely died out. A more intuitive statistic is the number of tokens that “graduate” daily, with Solana currently graduating about 175 tokens per day, down about 85% from its peak (1,100 per day at its peak).
The macro level is still worrying
In addition to the loss of the upward trend in Bitcoin price action, Bitcoin trading volume and ETF flows have also dropped significantly. The decrease in DEX trading volume, the decline in token issuance, and the negative funding rate of BTC also further confirm that the bull trend is weakening.
Finally, if prices continue to move in a bad direction, the unwinding of hidden leverage in the two largest sources of Bitcoin purchases (ETFs and Strategies) could trigger a Black Swan event.
But if there is a favorable catalyst in the market, the situation may improve. But the macro level is still worrying.
Global mobility: The 2024 push may no longer be in place
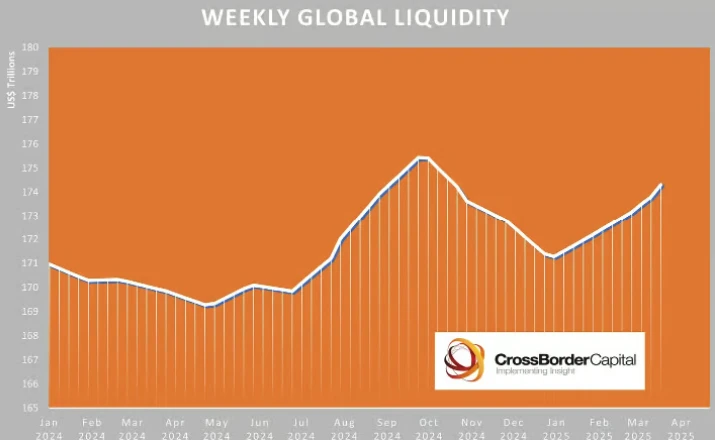
Data: Cross Border Capital
Global liquidity is rising, but at a slower pace. Two key factors are driving growth right now: a weaker dollar and improved central bank liquidity, especially from the Peoples Bank of China, and a more cautious Fed.
But the risk is that the forces driving implicit quantitative easing in 2024 through reverse repurchases and early issuance of new bonds may not exist this year, and liquidity on the US fiscal side (DOGE) may also decrease.
Last weeks FOMC meeting was not dovish
The Fed kept interest rates unchanged last week, which was expected, but there were other clues from the meeting that can help us predict where the market is headed in the short term:
The Fed lowered its GDP growth forecast for this year from 2.1% to 1.7%, and also raised its inflation forecast from 2.5% to 2.8%. This is worrisome because they are basically indicating that there will be some kind of stagflation in the future.
QT was cut from $25 billion per month to $5 billion per month. This may be positive for marginal liquidity, but it is not a catalyst for a new round of risk appetite.
Two rate cuts are expected for the rest of the year, with rates stabilizing at 3.9% by December. While this is unchanged from what was said at the last meeting, the number of Fed officials expecting one or fewer rate cuts went from four to eight, which could suggest a hawkish shift. Additionally, the number of officials expecting three or more rate cuts fell from five to two, also a hawkish shift.
All in all, this may not be a dovish meeting, but neutral at best.
Final Thoughts
Taking all of the above information into account, we believe that the odds for the future market still point to a longer bear market, rather than a short-term consolidation before another rally. Of course, everyone wants to buy more of their favorite crypto assets, we just think we will be able to buy them at more favorable prices later this year.


