


Global macro-finance, especially in the United States, has undergone a rapid and dramatic shift.
Rising U.S. inflation data and falling consumer confidence to a 15-month low have led traders to begin pricing in expectations of a U.S. recession, pushing the three major U.S. stock indexes to quickly fall to around their 120-day moving averages.
Funds started to seek safe havens, the yield on 10-year U.S. Treasury bonds fell rapidly, and gold also showed signs of peaking.
Affected by the linkage with the U.S. stock market, BTC, which had been accumulating momentum to rise, broke down and plummeted in the last week of February, ushering in the largest retracement and the largest loss week of this cycle.
EMC Labs believes that the essence of this market is the pricing of the Trump deal. Based on the logic of the self-adjustment of US policies and the optimistic outlook for the crypto market in the medium and long term, we believe that BTC is facing a good opportunity for medium and long-term allocation, and it can be stepped up and long on a cautious basis.
Macro Finance: Expectations of a US economic recession push the market downward, and the market may continue to be under pressure in the short and medium term
The economic and employment data released by the US government in February and the chaotic conflict caused by Trumps tariffs have become the two core factors affecting the recent trends in the macro-financial and crypto markets.
On February 7, the U.S. Bureau of Labor Statistics took the lead in releasing core employment data. The seasonally adjusted non-farm payrolls in January were only 143,000, significantly lower than the expected 170,000. The unemployment rate was 4%, slightly lower than the expected 4.1%. The significant reduction in the size of the non-farm payrolls has begun to increase market expectations for a U.S. economic recession.
The CPI data released on February 12 showed that the monthly CPI rate in January was as high as 0.5%, far higher than the expected 0.3% and higher than 0.4% in December last year, pushing the annual rate to 3% from the expected 2.9%. Since then, US inflation data has rebounded for three consecutive months, making the market believe that the Fed has more reasons to postpone the interest rate cut. Even if the economy is expected to decline, it may be difficult for the Fed to change its decision.
On February 21, the University of Michigan released the U.S. Consumer Confidence Index for February, with a final value of 64.7, lower than the initial value of 67.8, falling to the lowest point in 15 months. The continued downturn in consumer confidence will inevitably be transmitted to the corporate side.
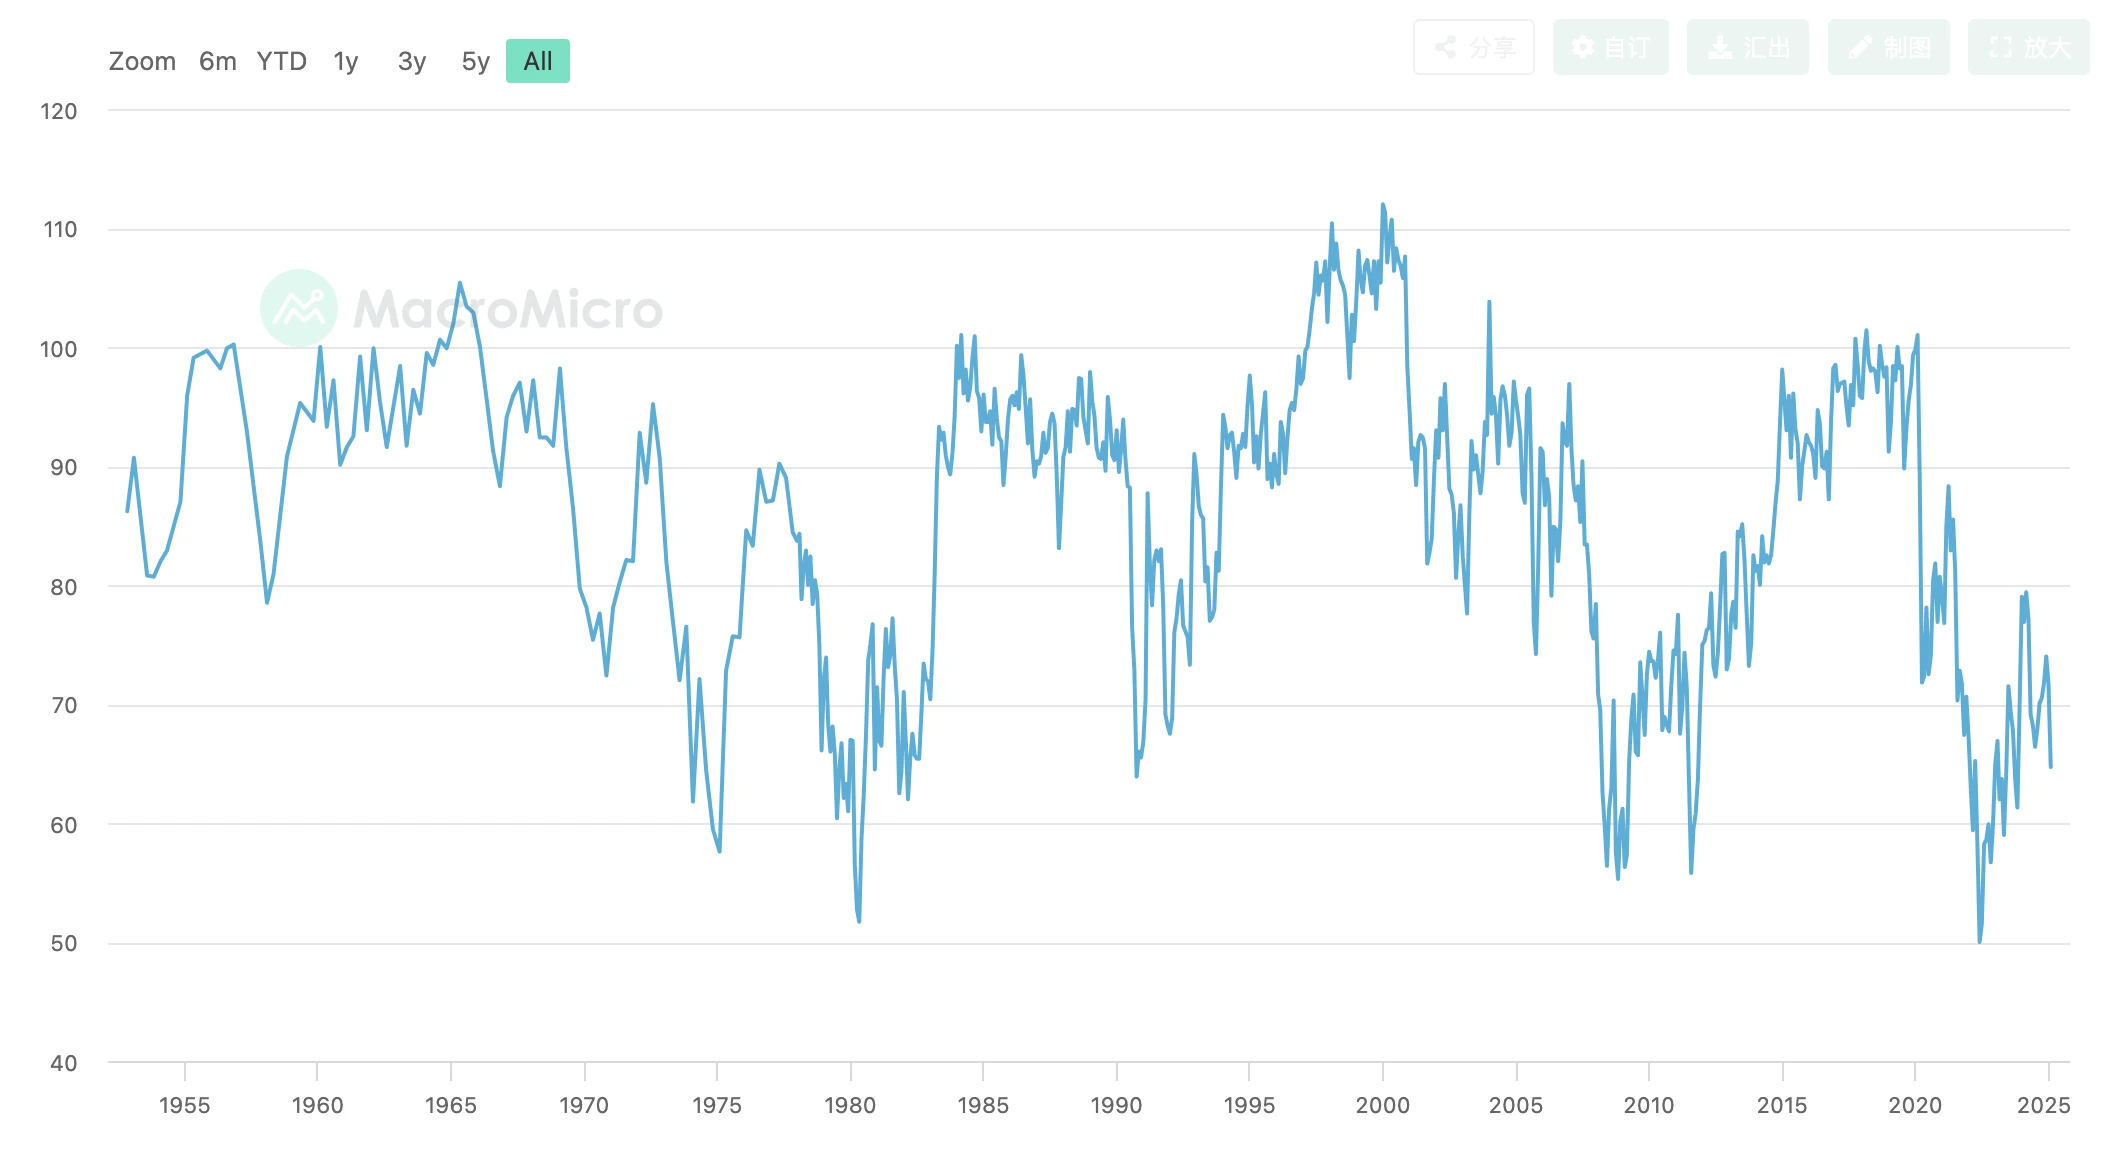
University of Michigan Consumer Sentiment Index
Combined with the previous negative information, this data that was far beyond expectations finally defeated market confidence. The three major U.S. stock indexes all fell sharply that day.
After two consecutive years of sharp rises, the US stock market, which was at a historical high, continued to fall sharply in the week after the 21st (Friday), wiping out all the gains this month and continuing to fall. The Nasdaq fell 3.97% on the month, the Dow Jones fell 1.58% on the month, the SP 500 fell 1.42% on the month, and the small and medium-sized enterprise index RUT 2000 fell 5.45%. Both the Nasdaq and the SP 500 fell below the 120-day moving average.
For traders, with inflation rebounding continuously, employment conditions may begin to decline, and the shadow of recession looming again, cutting long positions may be the best option.
The crisis does not end there. In addition to the deterioration in economic and employment data, Trumps chaotic and repetitive decisions on tariff policies have also made the market confused and pessimistic.
In January, Trump signed the America First Trade Policy memorandum, and at the end of the month announced a 25% tariff on Mexican and Canadian goods, and a 10% tariff on Chinese goods (already implemented). Later, he announced that the tariffs on Canada and Mexico would be suspended for one month, and at the end of the month, he directly announced that they would be implemented on March 4, and an additional 10% tariff would be imposed on China. During this period, Trump also announced that he would implement a reciprocal tariff policy on Europe and other countries.
Previously, the market viewed Trumps tariff policy as a political negotiation tool, but now it will soon be implemented and begin to become an important factor in driving inflation. This may also exceed market expectations, making traders more pessimistic.
The only thing that could have a positive effect on inflation and interest rate cuts, the Russia-Ukraine negotiations, progressed well for most of February, but on the last day of February, the two presidents had a dramatic conflict at the White House press conference, which caused the mineral agreement that was about to be signed to fail. European politicians have declared their support for Ukraine, and the rift between the United States and Europe will continue to widen. The Russia-Ukraine war, which was already a foregone conclusion, has encountered new twists and turns and is unlikely to end in the short term. At this point, the expectation of ending the war and increasing oil production to reduce inflation has been greatly discounted.
Since November last year, the Trump deal has been launched based on the expectation of strong economic growth. Now, with low employment data, high inflation, and tariffs exacerbating inflation expectations, market expectations have reversed, and the exit from the Trump deal has started recession pricing. Based on this logic, the decline of the three major stock indexes may just be the beginning.
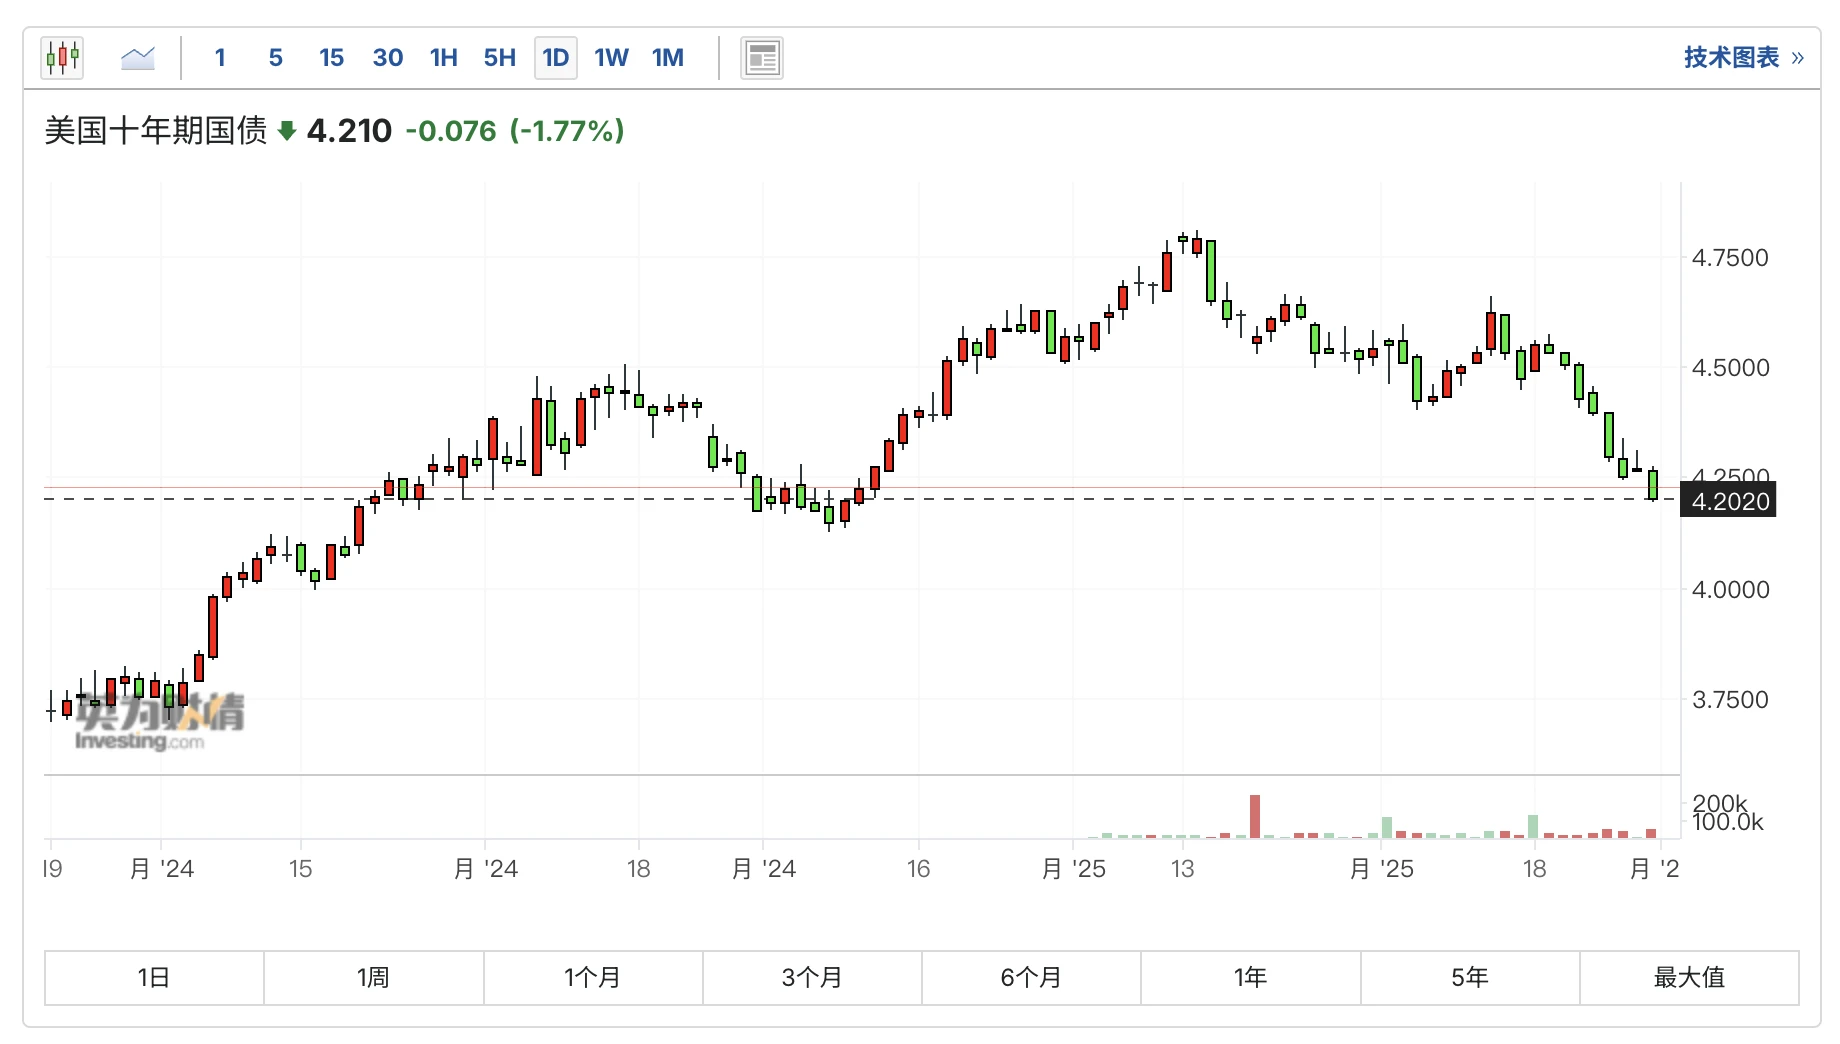
U.S. 10-year Treasury yield (daily)
After mid-January, the yield on 10-year U.S. Treasury bonds continued to decline, from a peak of 4.809% to 4.210%. The substantial change in the “pricing anchor” reflects the capital market’s substantial downward revision of its pricing for an economic recession.
With inflation rebounding, signs of economic decline, and sharp declines in the stock market and 10-year Treasury yields, the markets expectations for the Feds rate cuts this year have begun to increase, from 1 to 2. Technically, both the Nasdaq and the SP 500 have fallen below the 120-day line. Based on the current severe situation, the market has raised expectations for rate cuts. If there is no positive response, the short-term sell-off may continue.
Crypto assets: The Trump bottom has been broken, and the mid- and long-term investment opportunities are coming
In February, BTC opened at $102414.05 and closed at $84293.73, with a high of 102781.65 and a low of 78167.81. It fell 17.69% to $18113.53 for the whole month, with an amplitude of 24.03%. It fell by 28.52% from its high point, recording the largest retracement since this cycle (January 2023).
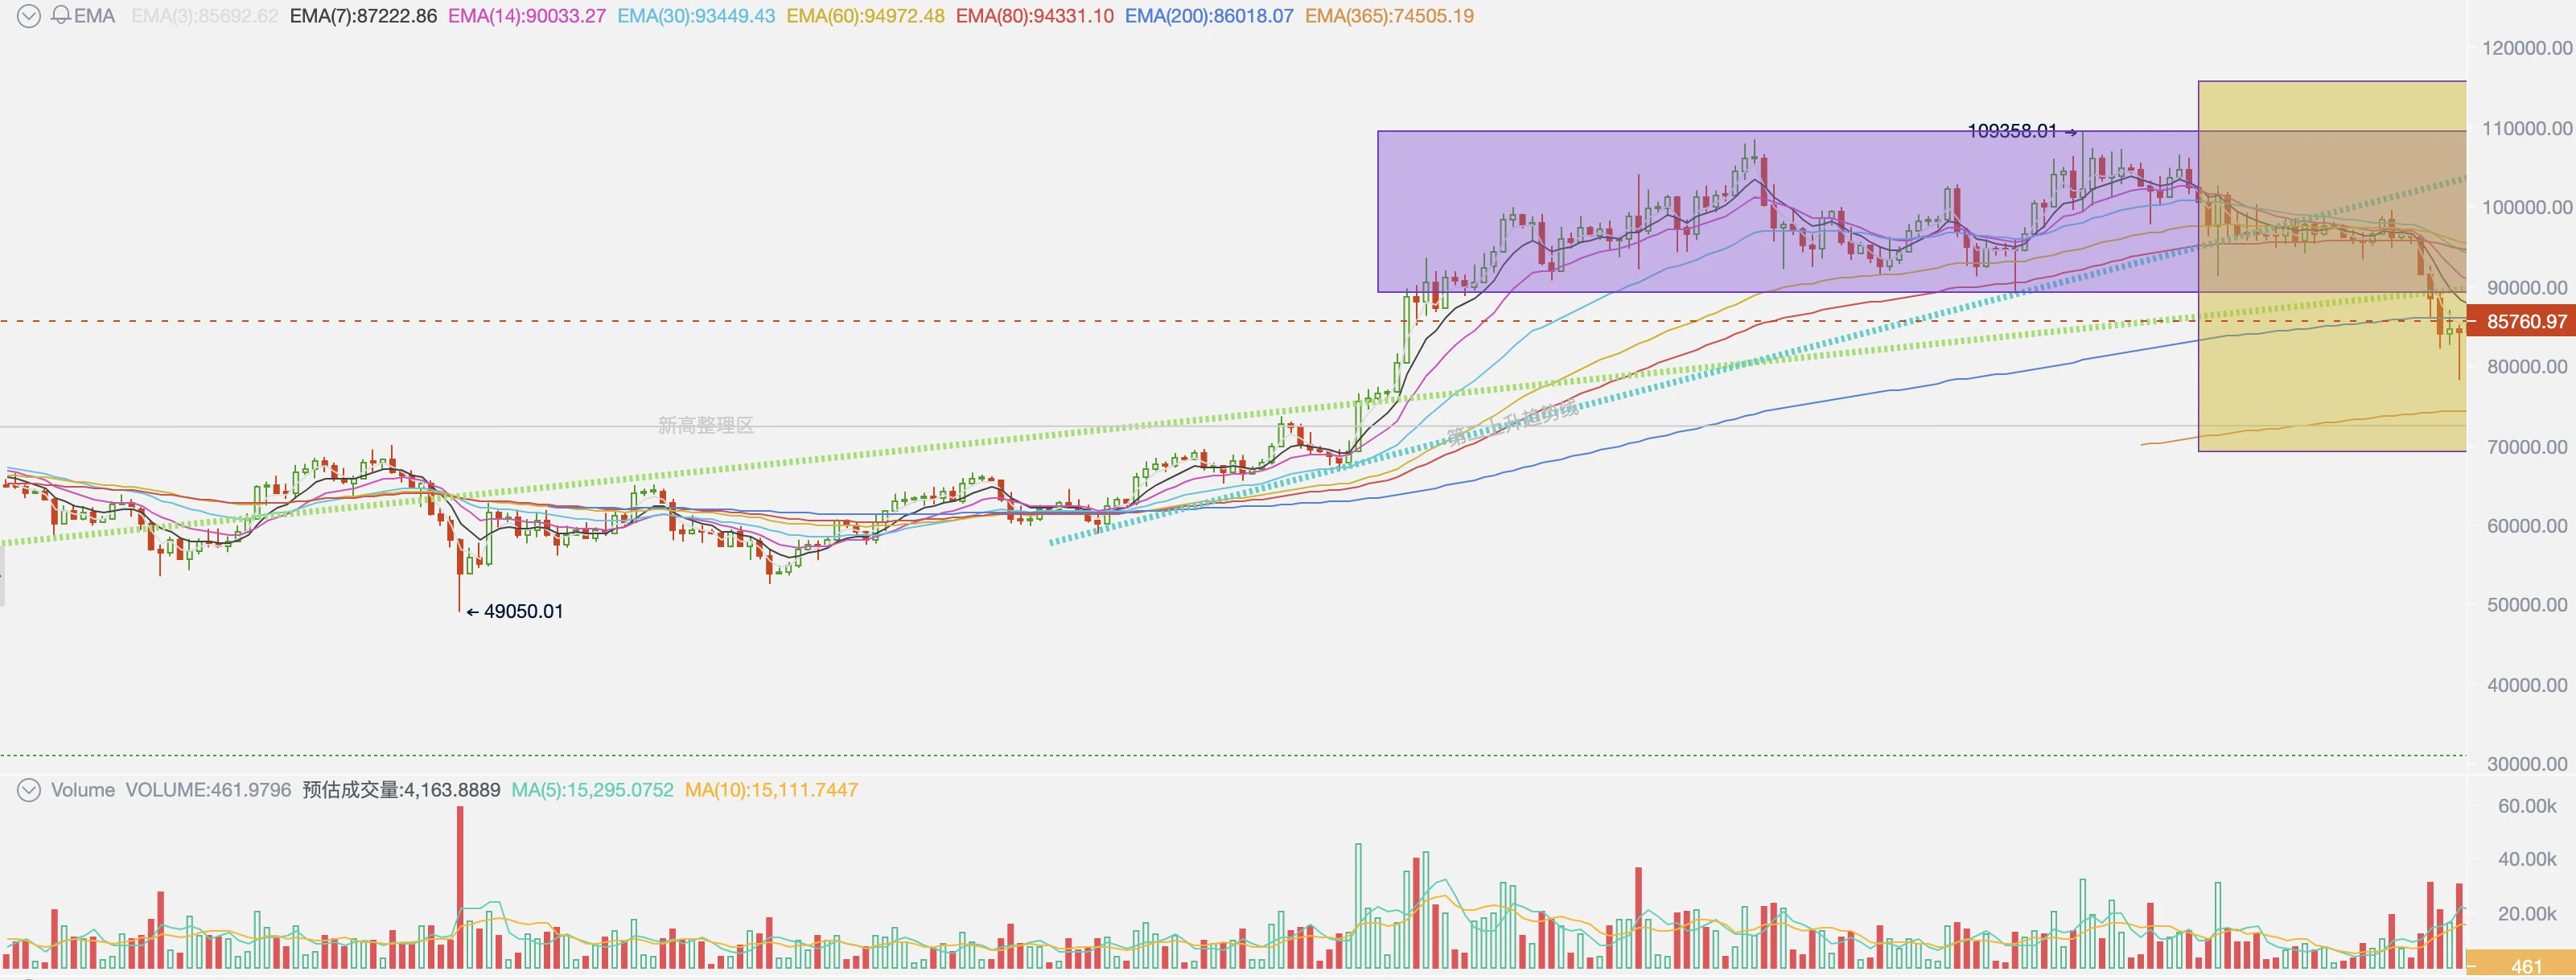
BTC price trend (daily)
The decline for the whole month was concentrated in the last week, and the rapid short-term sell-off caused the market to enter an extremely panic state. Corresponding to the largest decline in the cycle, the Fear and Greed Index fell to 10 points on February 27, the lowest point since the cost cycle, close to 6 points when LUNA collapsed in the bear market stage of the previous cycle.
Technically, the Trump bottom (purple area in the above figure) has been effectively broken, which also echoes the US stock markets retreat from the Trump deal. The first rising trend line and second rising trend line of this cycle that EMC Labs had previously focused on were quickly broken in a short period of time. By the end of the month, the BTC price closed near the 200-day moving average.
In addition to the linkage with the U.S. stock market, the cyclical sell-off in the crypto market this month is also related to negative events within the market.
On February 14, Argentine President Javier Milley published a post on the X platform to promote the MEME coin Libra, triggering a speculative boom and pushing its market value to $4.5 billion. Subsequently, the creator withdrew funds from the trading pool, causing the coin price to collapse rapidly and investors to suffer heavy losses.
On February 21, suspected North Korean hackers exploited a technical vulnerability in the Bybit exchange and stole more than 400,000 ETH and stETH, with a total value of more than US$1.5 billion, making it the largest attack in US dollar terms in the history of cryptocurrency.
On February 23, the Infini contract was attacked and more than $49 million was stolen.
In addition, the unlocking of SOL tokens due to the bankruptcy and liquidation of FTX on March 1 will reach 11.2 million, with a total value of only US$2 billion. The unlocking scale reached 2.29% of the total issuance of SOL, pushing the price of SOL to fall by more than 50% in the weak market.
EMC Labs believes that the biggest drop in the crypto market in February was directly caused by the decline of the U.S. stock market driven by the expectation of economic recession, which can also be understood as the pricing of the Trump deal. Based on the decline of the U.S. stock market, BTC can theoretically fall to $73,000 at most, but considering that the Trump administration has improved the fundamentals of BTC much more than the U.S. stock market, the probability of achieving this theoretical low point is low. The cycle is still continuing. Based on the logic of the self-adjustment of U.S. policies and the medium- and long-term optimism of the crypto market, we believe that BTC is facing a good opportunity for medium- and long-term configuration, and it can be stepped up on a cautious basis.
Funds: BTC Spot ETF channel outflow exceeds $3.2 billion, becoming the direct cause of the decline
As Trumps trading sentiment cooled, the capital inflow into the crypto market slowed down significantly in February. This slowdown in inflow and the continuous interaction of price declines eventually led to the BTC price breaking through the $96,000 level in the last week of February after hovering for a long time. The scale of capital inflow in February dropped sharply to $2.111 billion.
Crypto market capital flow statistics (daily)
Entering the classified funds, EMC Labs found that stablecoin funds and BTC Spot ETF channel funds showed divergent attitudes. The stablecoin channel had an inflow of $5.3 billion throughout the month, while the ETF channel had an outflow of up to $3.249 billion.
Crypto market capital flow statistics (monthly line)
In previous reports, we have repeatedly pointed out that BTC Spot ETF has mastered the medium- and short-term pricing power of BTC, so the price trend of BTC shows a high correlation with the trend of US stocks.
This month, the outflow of BTC Spot ETF channel exceeded 3.2 billion US dollars, which became the most direct external reason for the decline, setting a record for the largest single-month sell-off since its listing. The subsequent trend of BTC will also mainly depend on the improvement of US economic expectations and the return of funds from the BTC ETF Spot channel.
Secondary selling: The bloody chips come from the short-hand group
Since the start of the secondary sell-off in early October 2024, 1.12 million BTC chips have shifted from long-hand holding to short-hand holding. We regard the secondary sell-off as a necessary condition for the end of a bull market cycle. The logic behind it is that when the scale of active BTC grows to a certain extent, it will drain liquidity, causing the upward trend to be completely destroyed.
Looking back at the consolidation and sudden plunge in February, the long-term group remained extremely restrained and only sold 7,271 coins. In fact, the existing long-term group has long ignored the quotes in the Trump bottom range (89,000 to 110,000 US dollars) and chose to hold the coins for appreciation.
In the last week of February, the bloody chips that were transferred came from the short-hand group. According to the on-chain data analysis, the short-hand group held on until February 24, and the defense was broken on the 25th. On that day, the short-hand group on the chain alone realized a loss of 255 million US dollars. This is the second largest loss day in this cycle, second only to August 5, 2024 (on-chain loss of 362 million). Historically, after the short-hand group experienced a similar scale of large losses, the market often ushered in a staged bottom.
Statistics on the scale of losses on the chain by long and short groups
In-depth on-chain analysis shows that since February 24, the number of BTC distributed between $78,000 and $89,000 has increased by 564,920.06, while the number of BTC distributed in the Trump bottom range (US$89,000 to US$110,000) has decreased by 412,875.03.
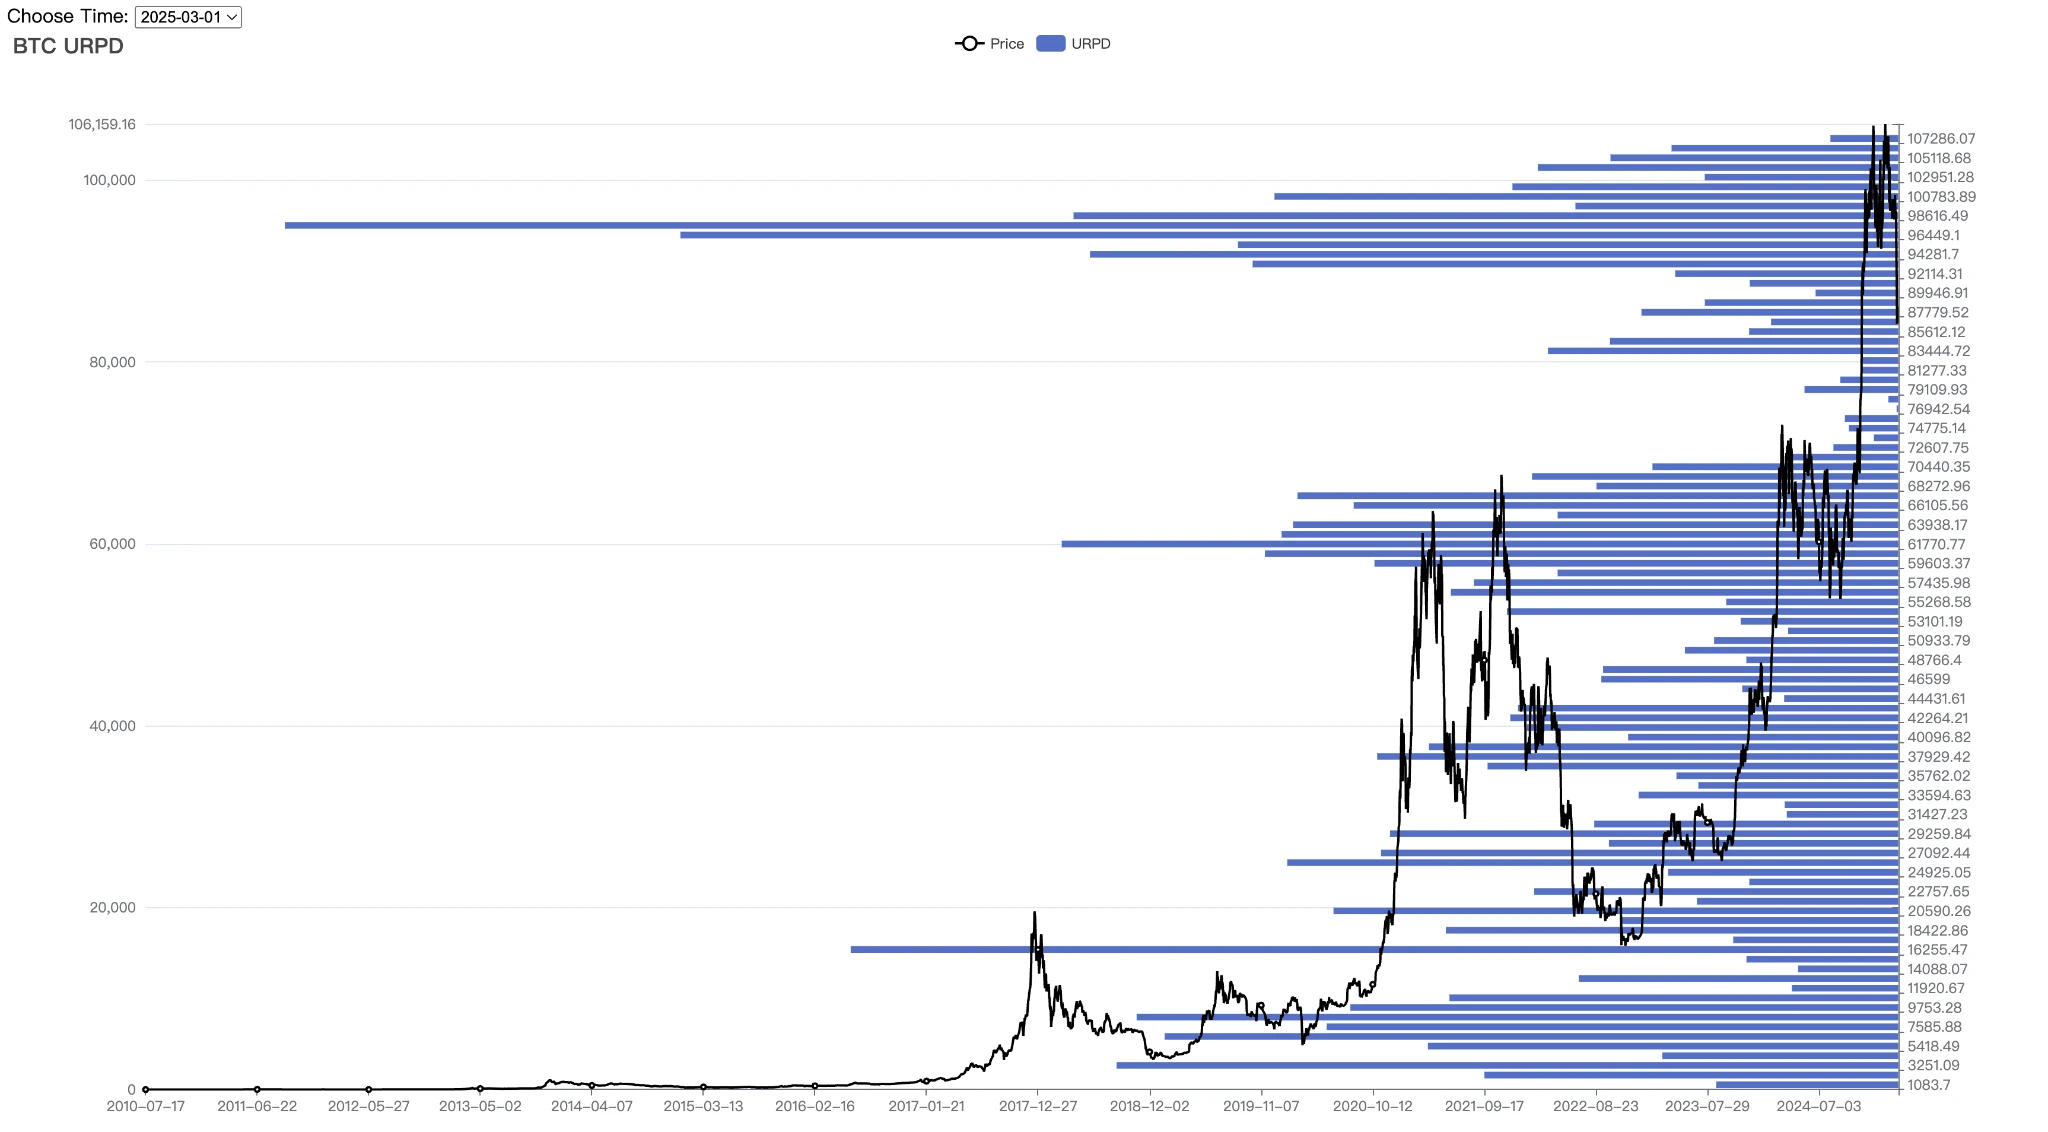
BTC price distribution statistics
The Trump bottom range was minted between November last year and February this year. The holders of this range are typical short-hand groups. The short-hand group sold bloody chips in an attempt to build a mid-term bottom, and also consolidated the 73,000 ~ 89,000 range with fewer chips.
Conclusion
In the January report , we emphasized that the biggest external uncertainty comes from the chain reaction of interest rate cut expectations and capital supply after the implementation of Trumps economic policies. Once liquidity is constrained, volatility will rise sharply.
This worry has already come true.
According to our previous analysis, the selling of bloody chips came from the short-hand group, while the long-hand group has quietly slowed down the selling and held the coins for a rise. EMC Labs believes that the current bull market is only in a relay state, not a bear market.
We believe that the largest BTC retracement in this cycle in February was caused by the massive outflow of funds from the BTC Spot ETF as the U.S. stocks at historical highs revised down their pricing for “economic recession expectations”. The driving force for this turning point will also come from the shift in expectations and the rebound in the U.S. stock market trend.
The internal structure is relatively stable, BTC and the crypto market are still operating within the cycle rate, and the short-term price decline brings good opportunities for medium- and long-term allocation.
What needs to be carefully observed are the trends in the U.S. macro-economy, market expectations and the Federal Reserve’s attitude towards restarting interest rate cuts.
EMC Labs was founded by crypto asset investors and data scientists in April 2023. It focuses on blockchain industry research and Crypto secondary market investment, takes industry foresight, insight and data mining as its core competitiveness, and is committed to participating in the booming blockchain industry through research and investment, and promoting blockchain and crypto assets to bring benefits to mankind.
For more information, please visit: https://www.emc.fund


